. 2024 Feb:69:102972.
doi: 10.1016/j.redox.2023.102972. Epub 2023 Nov 24.

ALS-linked SOD1 mutations impair mitochondrial-derived vesicle formation and accelerate aging

Affiliations

ALS-linked SOD1 mutations impair mitochondrial-derived vesicle formation and accelerate aging

Ying Guo et al. Redox Biol. 2024 Feb.

Abstract

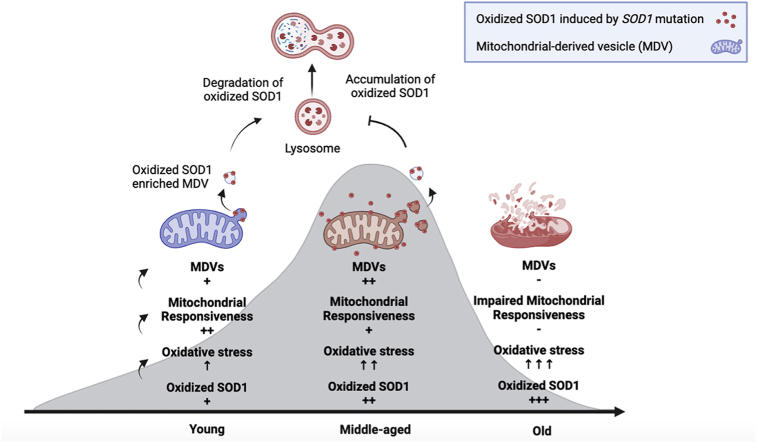
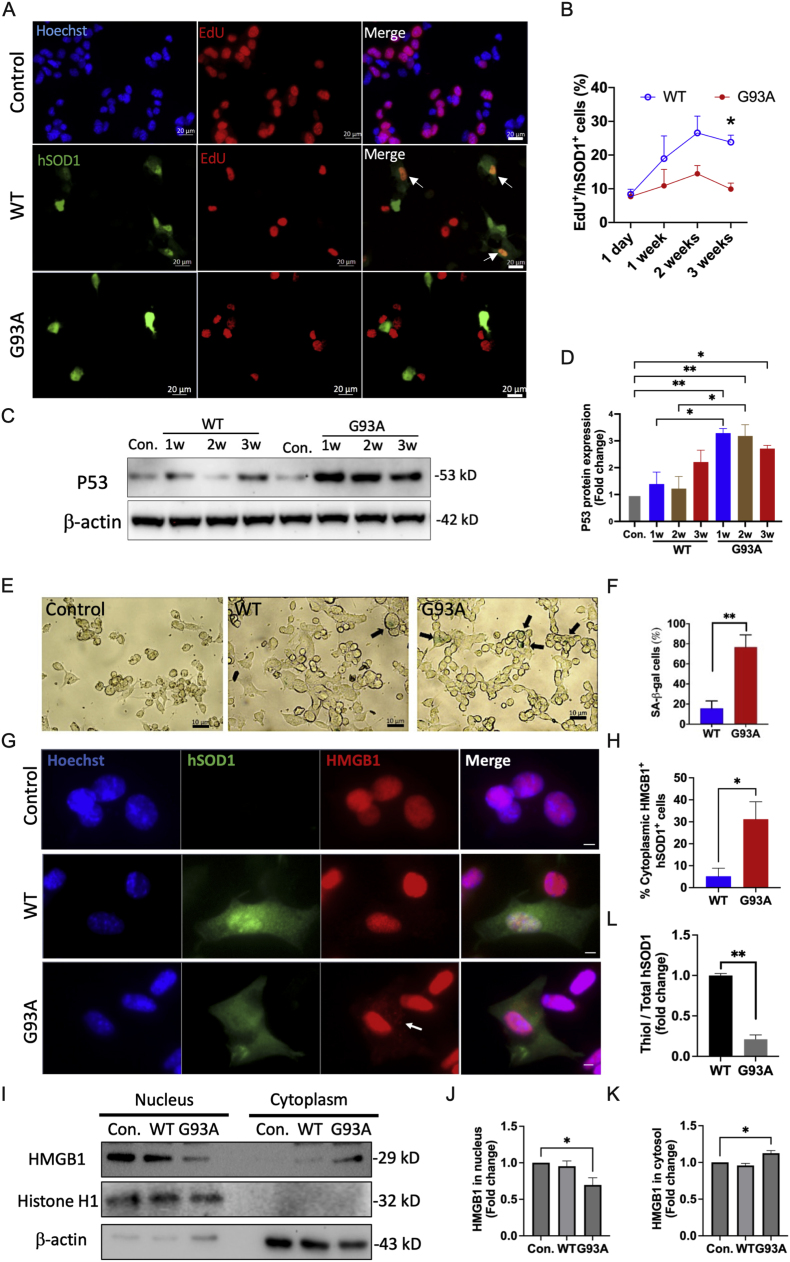
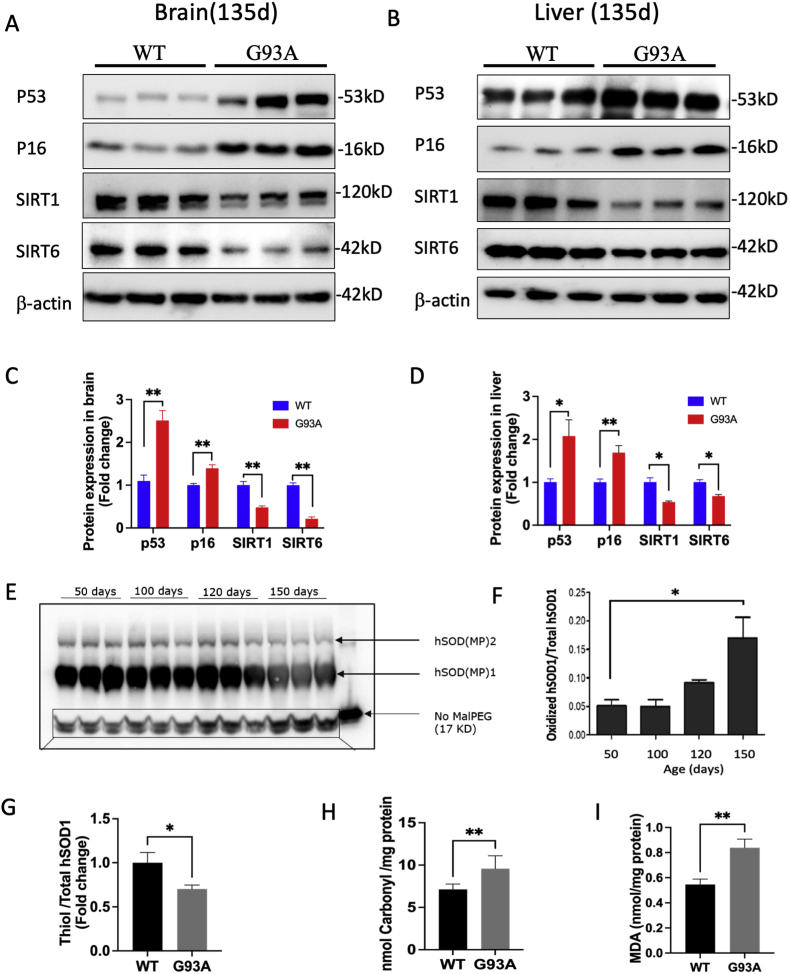
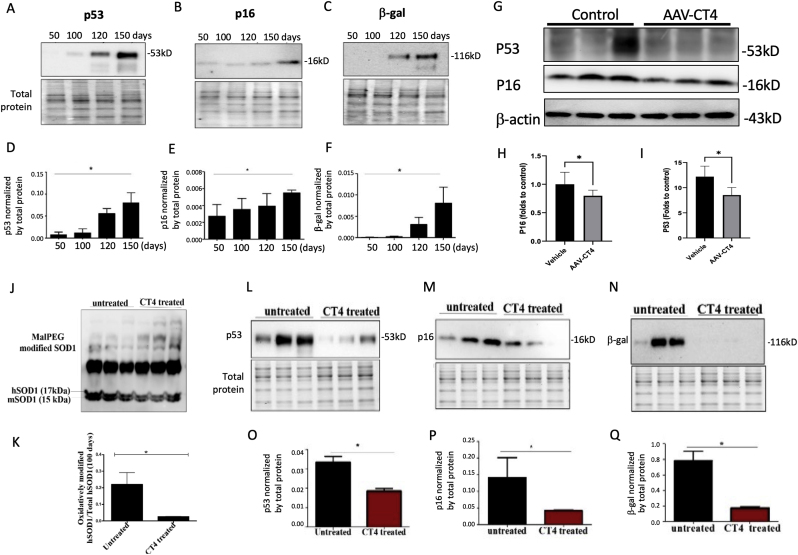
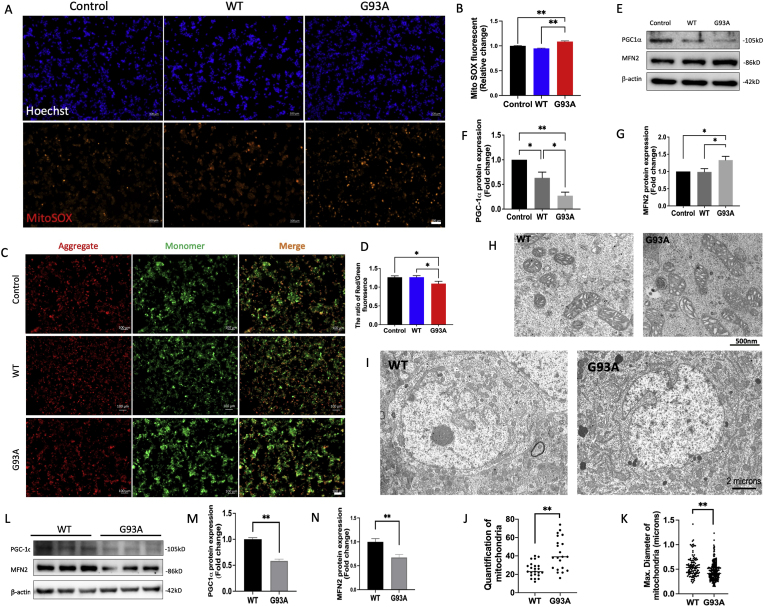
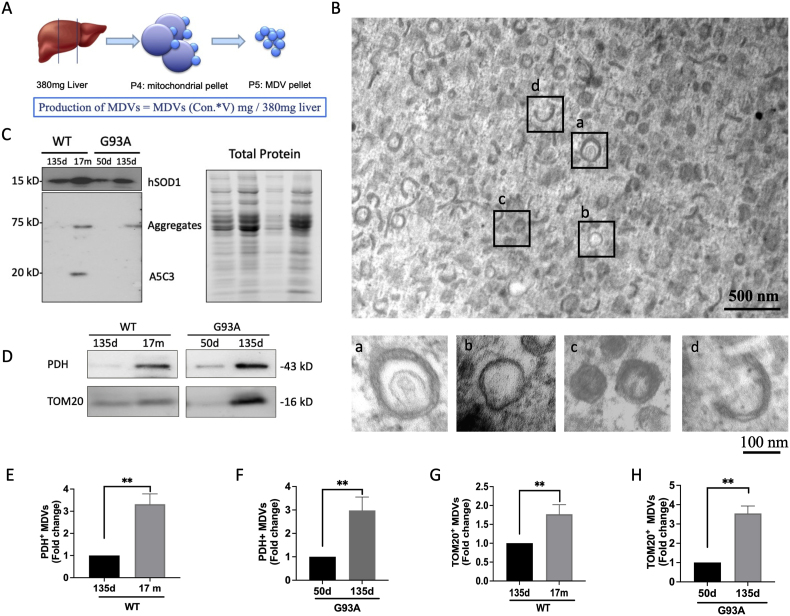
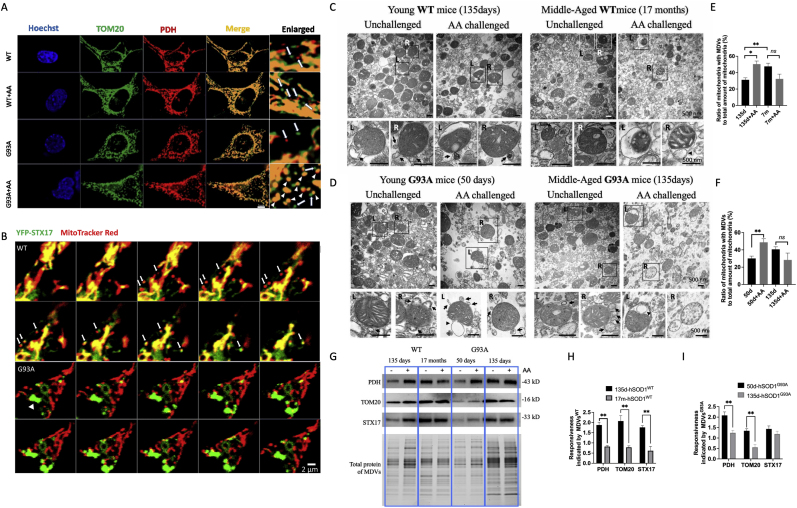
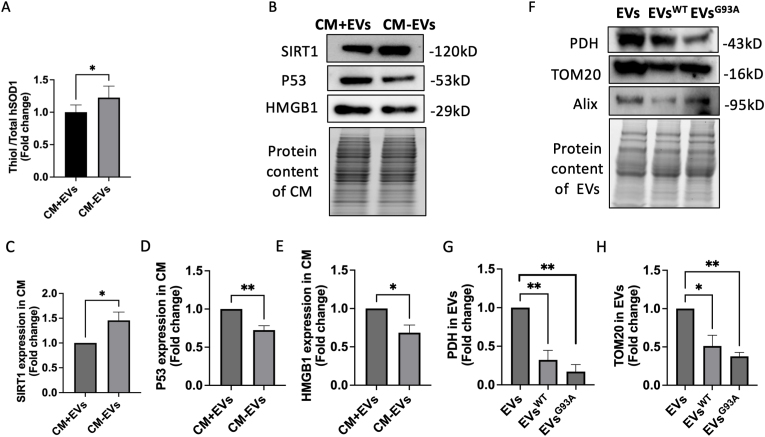
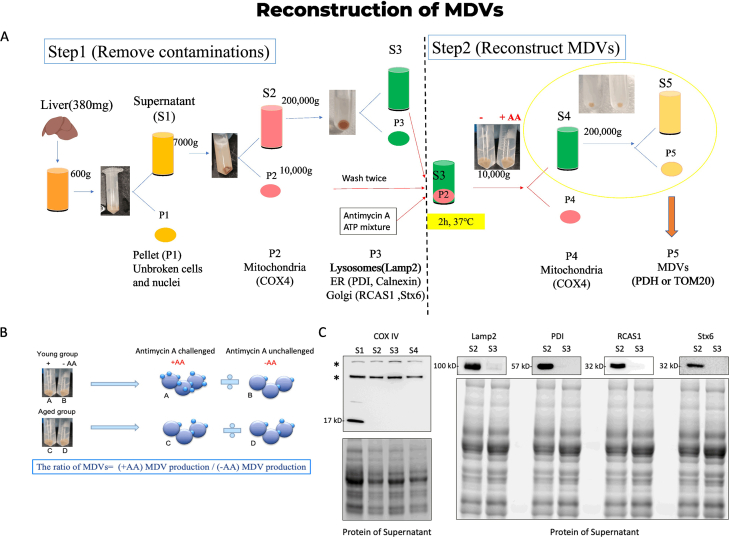
Oxidative stress (OS) is regarded as the dominant theory for aging. While compelling correlative data have been generated to support the OS theory, a direct cause-and-effect relationship between the accumulation of oxidation-mediated damage and aging has not been firmly established. Superoxide dismutase 1 (SOD1) is a primary antioxidant in all cells. It is, however, susceptible to oxidation due to OS and gains toxic properties to cells. This study investigates the role of oxidized SOD1 derived from amyotrophic lateral sclerosis (ALS) linked SOD1 mutations in cell senescence and aging. Herein, we have shown that the cell line NSC34 expressing the G93A mutation of human SOD1 (hSOD1G93A) entered premature senescence as evidenced by a decreased number of the 5-ethynyl-2'-deoxyuridine (EdU)-positive cells. There was an upregulation of cellular senescence markers compared to cells expressing the wild-type human SOD1 (hSOD1WT). Transgenic mice carrying the hSOD1G93A gene showed aging phenotypes at an early age (135 days) with high levels of P53 and P16 but low levels of SIRT1 and SIRT6 compared with age-matched hSOD1WT transgenic mice. Notably, the levels of oxidized SOD1 were significantly elevated in both the senescent NSC34 cells and 135-day hSOD1G93A mice. Selective removal of oxidized SOD1 by our CT4-directed autophagy significantly decelerated aging, indicating that oxidized SOD1 is a causal factor of aging. Intriguingly, mitochondria malfunctioned in both senescent NSC34 cells and middle-aged hSODG93A transgenic mice. They exhibited increased production of mitochondrial-derived vesicles (MDVs) in response to mild OS in mutant humanSOD1 (hSOD1) transgenic mice at a younger age; however, the mitochondrial response gradually declined with aging. In conclusion, our data show that oxidized SOD1 derived from ALS-linked SOD1 mutants is a causal factor for cellular senescence and aging. Compromised mitochondrial responsiveness to OS may serve as an indicator of premature aging.

Keywords: Aging; Cellular senescence; Mitochondrial dysfunction; Mitochondrial-derived vesicles; Oxidative stress; Superoxide dismutase 1.


Conflict of interest statement

Declaration of competing interest The authors declare that they have no known competing financial interests or personal relationships that could have appeared to influence the work reported in this paper.

Figures

Image 1
Graphical abstract
Fig. 1
Fig. 1
NSC34 cells expressing hSOD1G93A undergo early entrance into senescence. (A) Detection of EdU+ (red) in non-transfected (hSOD1-), hSOD1WT and hSOD1G93A transfected (hSOD1+, green) NSC34 cells. Scale bar, 20 μm. (B) Quantification of the proportion of EdU+ cells in NSC34 cells expressing hSOD1 within 3 weeks (n = 20–50 cells), *p < 0.05. (C-D) Representative and quantification of Western blot analysis of P53 protein level in NSC34 cells (n = 5, mean ± SEM, *p < 0.05, **p < 0.01). (E) Representative images of cellular senescence associated with β-galactosidase (SA-β-gal) staining in NSC34 cells. The black arrow indicated the SA-β-gal positive cells (green). Scale bar, 10 μm. (F) The proportion of SA-β-gal positive cells in total cells from each image field (n = 50–100 cells, mean ± SEM, **p < 0.01). (G) Immunofluorescence staining for hSOD1 (green), HMGB1 (red), and Hoechst (blue) in NSC34 cells. Scale bar, 10 μm. (H) The proportion of cells with cytoplasmic translocation of HMGB1 in the total hSOD1+ cells (n = 20 cells, mean ± SEM, *p < 0.05, **p < 0.01). (I–K) Representative and quantification of Western blot analysis of HMGB1 protein levels in the nucleus and cytosol of NSC34 cells (n = 5, mean ± SEM, *p < 0.05). (L) The proportion of thiol group level in total hSOD1 within NSC34 cells (n = 11, mean ± SEM, **p < 0.01).
Fig. 2
Fig. 2
Protein oxidation increases with age in transgenic mice expressing mutant hSOD1. (A-B) Representative Western blot images of the aging biomarkers (P53, P16, SIRT1, and SIRT6) in the brain (A) and liver (B) tissues. (C-D) Quantitative analysis of P53, P16, SIRT1, and SIRT6 protein levels (n = 3, mean ± SEM, *p < 0.05, **p < 0.01). (E) MalPEG modification and Western blotting analysis of hSOD1 in the brain tissues from hSOD1G93A mice at 50, 100, 120, and 150 days. (F) Quantitative analysis data of oxidized hSOD1(n = 3, mean ± SEM, *p < 0.05). (G) The proportion of the thiol group in total hSOD1 was quantified in brain tissues from 135-day hSOD1WT and hSOD1G93A transgenic mice (n = 6, mean ± SEM, *p < 0.05). (H–I) Representative analysis of carboxyl and MDA levels in brain tissues from 135-day hSOD1WT and hSOD1G93A mice (n = 3, mean ± SEM, **p < 0.01).
Fig. 3
Fig. 3
Removal of oxidized SOD1 decelerates aging in transgenic mice expressing hSOD1G37R (A-C) Representative Western blot images of the aging biomarkers (P16, P53, and SA-β-gal) in the spinal cord tissues from 50 to 150 days hSOD1G93A mice. (D-F) Quantification of the senescence markers was normalized by the total protein from 50 to 150 days hSOD1G93A mice (n = 3, mean ± SEM, *p < 0.05). (G-I) Representative Western blot images and quantitative analysis of the aging biomarkers (P53 and P16) in 135-day hSOD1G93A mice treated with AAV-CT4 (mean ± SEM, n = 5 in control, n = 6 in AAV-CT4 treatment, *p < 0.05). (J-K) Representative Western blot images of MalPEG-modified native hSOD1 in 100-day hSOD1G37R mice. The 17 kDa and 15 kDa bands represent human SOD1 and mouse SOD1, respectively (n = 3, mean ± SEM, *p < 0.05). (L-N) Representative Western blot images of the aging biomarkers (P16, P53, and SA-β-gal) in the spinal cord tissues from CT4 treated and untreated hSOD1G37R mice. (O-Q) Quantification of the aging biomarkers was normalized by the total protein from 100 days from CT4 treated and untreated hSOD1G93A mice (n = 3, mean ± SEM, *p < 0.05).
Fig. 4
Fig. 4
hSOD1G93A induces mitochondrial dysfunction in senescent cells. (A) mtROS was detected with MitoSOX (red) and nuclear fluorescence was visulized with Hoechst staining (blue) in non-transfected (control), WT, and G93A transfected NSC34 cells. Scale bar, 100 μm. (B) Quantification of relative fluorescence intensity of MitoSOX (n = 260 cells, mean ± SEM, **p < 0.01). (C) Detection of JC-1 monomers (green), and JC-1 aggregates (red) in NSC34 cells by fluorescence microscopy. Scale bar, 50 μm. (D) Quantitative analysis of the ratio of aggregates and monomers of JC-1 (n = 15, mean ± SEM, *p < 0.05). (E) Representative Western blot images of mitochondrial biogenesis proteins (PGC-1α and MFN2) in NSC34 cells. (F-G) Quantitative analysis of PGC-1α and MFN2 (n = 6, mean ± SEM, *p < 0.05, **p < 0.01). (H) Ultrastructure of mitochondria in NSC34G93A cells was observed using TEM. The elongated (white arrow) and vacuolated (black arrow) mitochondria in NSC34G93A cells were compared to NSC34WT cells. Scale bar, 500 nm. (I) Representative TEM images illustrate motor neurons of the anterior spinal cord in both hSOD1WT and hSOD1G93A mice at 135 days. Scale bar, 2 μm. (J) Quantification of the number of mitochondria in each motor neuron (n = 20, mean ± SEM, **p < 0.01). (K) Quantification of the size of mitochondria with the index of maximum diameter (n = 150, mean ± SEM, **p < 0.01). (L) Representative Western blot images of mitochondrial biogenesis proteins (PGC-1α and MFN2) in brain tissue from 135-day hSOD1 transgenic mice. (M-N) Quantitative analysis of PGC-1α and MFN2 (n = 6, mean ± SEM, **p < 0.01).
Fig. 5
Fig. 5
Oxidized SOD1 promotes MDV formation in early aging. (A) Reconstruction of MDVs from liver mitochondria. The yield of MDVs was determined by the protein content of MDVs (mg) per 380 mg of liver. (B) The ultrastructure of isolated MDVs from liver mitochondria by using TEM. Upper: lower magnification of MDV pellet. Scale bar, 500 nm. Lower: higher magnification of MDV with (a) double membranes, (b) a single membrane, (c) dense core, and (d) crescent shape. Scale bar, 100 nm. (C) Representative Western blot images of hSOD1 and misfolded SOD1 (A5C3) in young and middle-aged MDVs isolated from G93A and WT liver mitochondria. (D) Immunoblot analyses of biomarkers of MDVs (PDH and TOM20) from young and middle-aged groups. (E-H) Quantification of the protein levels of PDH and TOM20 in young and middle-aged MDVs (n = 3, mean ± SEM, **p < 0.01).
Fig. 6
Fig. 6
Mitochondrial responsiveness declines with age. (A) Immunofluorescence staining of NSC34 cells for either PDH (red) or TOM20 (green) represents MDVs. Arrows indicate MDVs with either PDH or TOM20 positive staining, while arrowheads indicate fragmented mitochondria with colocalized staining of PDH and TOM20. Scale bar, 5 μm. (B) Representative live cell confocal imaging of NSC34 cells showing MDVs (∼300 nm) with MitoTracker Red (red) were transported by YFP-STX17 (green) in 10-min time-lapse images. Arrows indicate MDVs with colocalization of YFP-STX17 (green) and MitoTracker Red (red). The arrowhead indicates aggregation of STX17 (green aggregation, >2 μm). Scale bar, 2 μm. (C-D) Representative TEM images showing isolated liver mitochondria from young and middle-aged hSOD1WT(C) and hSOD1G93A(D) transgenic mice. Black arrows indicate MDVs (70–150 nm), and arrowheads indicate autophagosomes (>500 nm). Scale bar, 500 nm. (E-F) Quantification of the ratio of mitochondria with MDVs to the total amount of liver mitochondria from hSOD1WT(E) and hSOD1G93A(F) transgenic mice. (G) Representative Western blot images of protein level of MDVs isolated from hSOD1WT and hSOD1G93A mice liver. (H–I) Quantification of the protein levels of MDVs (PDH, TOM20, and STX17) (n = 3, mean ± SEM. **p < 0.01).
Fig. 7
Fig. 7
MDV-derived extracellular vesicles contain oxidized SOD1 and aging biomarkers. (A) Quantification of the thiol group level in total hSOD1 in the conditioned medium (CM) from senescent NSC34G93A cells with or without EVs. (B-E) Representative Western blot images and quantification of the protein levels of the aging biomarkers (SIRT1, P53, and HMGB1) in the CM (n = 4, mean ± SEM, *p < 0.05, **p < 0.01) (F) Representative Western blot images of exosome biomarker (Alix) and MDV biomarkers (PDH and TOM20) in EVs from NSC34WT and NSCG93A. (G-H) Quantitative analysis of the protein levels of PDH, TOM20 and Alix in the isolated EVs (n = 6, mean ± SEM, *p < 0.05, **p < 0.01).
figs1
figs1

References

    1. Sanghai N., Tranmer G.K. Biochemical and molecular pathways in neurodegenerative diseases: an Integrated View. Cells. 2023;12:2318. - PMC - PubMed
    1. Tsang C.K., Liu Y., Thomas J., Zhang Y., Zheng X.F. Superoxide dismutase 1 acts as a nuclear transcription factor to regulate oxidative stress resistance. Nat. Commun. 2014;5:3446. - PMC - PubMed
    1. Barber S.C., Mead R.J., Shaw P.J. Oxidative stress in ALS: a mechanism of neurodegeneration and a therapeutic target. Biochim. Biophys. Acta. 2006;1762:1051–1067. - PubMed
    1. Blander G., de Oliveira R.M., Conboy C.M., Haigis M., Guarente L. Superoxide dismutase 1 knock-down induces senescence in human fibroblasts. J. Biol. Chem. 2003;278:38966–38969. - PubMed
    1. Noblanc A., Klaassen A., Robaire B. The exacerbation of aging and oxidative stress in the epididymis of Sod1 null mice. Antioxidants. 2020;9:151. - PMC - PubMed

Supplementary concepts