. 2024 Feb 7;112(3):458-472.e6.
doi: 10.1016/j.neuron.2023.11.001. Epub 2023 Dec 5.

An excitatory projection from the basal forebrain to the ventral tegmental area that underlies anorexia-like phenotypes

Affiliations

An excitatory projection from the basal forebrain to the ventral tegmental area that underlies anorexia-like phenotypes

Jing Cai et al. Neuron. .

Abstract

Maladaptation in balancing internal energy needs and external threat cues may result in eating disorders. However, brain mechanisms underlying such maladaptations remain elusive. Here, we identified that the basal forebrain (BF) sends glutamatergic projections to glutamatergic neurons in the ventral tegmental area (VTA) in mice. Glutamatergic neurons in both regions displayed correlated responses to various stressors. Notably, in vivo manipulation of BF terminals in the VTA revealed that the glutamatergic BF → VTA circuit reduces appetite, increases locomotion, and elicits avoidance. Consistently, activation of VTA glutamatergic neurons reduced body weight, blunted food motivation, and caused hyperactivity with behavioral signs of anxiety, all hallmarks of typical anorexia symptoms. Importantly, activation of BF glutamatergic terminals in the VTA reduced dopamine release in the nucleus accumbens. Collectively, our results point to overactivation of the glutamatergic BF → VTA circuit as a potential cause of anorexia-like phenotypes involving reduced dopamine release.

Keywords: VTA; anorexia; anxiety; basal forebrain; dopamine; feeding; glutamatergic neurons; hyperactivity; stress; voluntary hypophagia.


Conflict of interest statement

Declaration of interests The authors declare no competing interests.

Figures

Figure 1.
Figure 1.. Direct projections from BFVglut2 neurons to VTAVglut2 neurons.
(A) Schematic diagram showing virus injection strategies for labeling BF downstream glutamatergic neuronal fibers. (B) Expression pattern of the injected ChR2 virus in the BF. (C) Expression pattern of ChR2-EYFP within the anterior to posterior sections of the VTA. (D) Schematic diagram showing virus injections to label BFVglut2 neurons that send projections to the VTA. (E) Expression pattern of the Flp-mCherry virus in the VTA. (F) Expression pattern of the injected Con/Fon-EGFP virus in the BF. EGFP labeled VTA-projecting BFVglut2 neurons. (G and H) EGFP-positive neuronal fibers from VTA-projecting BFVglut2 neurons in the VTA (G) and the LHb (H). (I) Schematic diagram showing virus injection strategies to label downstream VTA neurons that form synaptic connections with BFVglut2 neurons. (J) Expression pattern of the injected WGA-EGFP virus in the BF. (K) Co-localization of EGFP-positive neurons and mCherry neurons (glutamatergic neurons). Scale bar = 200 μm. VDB: vertical diagonal band of broca. HDB: horizontal diagonal band of broca. Fr: fasciculus retroflexus. MM: mammillary nucleus. IPN: interpeduncular nucleus. Ml: medial mammillary nucleus, lateral.
Figure 2.
Figure 2.. BFVglut2 and VTAVglut2 neurons showed correlated responses to external threat cues.
(A) Schematic diagram showing virus injections and optic cannula implantation in both the BF and the VTA for simultaneous dual GCaMP6m-based fiber photometry recordings. (B and C) Expression patterns of the injected GCaMP6m virus and cannula tracks in the BF (B) and the VTA (C). Scale bar = 200 μm. (D-F) BF (top panels) and VTA (bottom panels) Ca2+ signal Z-score in response to different physical stressors including air puff (D), water spray (E), and object drop (F). Time = 0 represents the starting time of the stimuli. The shades represent +/− SEM. Animals N = 7.
Figure 3.
Figure 3.. In vivo activation of BFVglut2 → VTAVglut2 projections suppressed food intake.
(A) Schematic diagram showing strategies of virus injections and optic cannula implantations for photostimulation of BFVglut2 → VTAVglut2 projections. (B) Representative expression patterns of the injected ChR2 virus and cannula tracks in the VTA. Fos is a marker of neuronal activation in mice. Scale bar = 200 μm. (C) Quantitative comparisons of Fos-positive neuron numbers at different bregma levels (from anterior to posterior) between control EYFP and ChR2 groups. Two-way ANOVA followed by Sidak multiple comparisons test; from anterior to posterior bregma levels: F (1, 48) = 56.18; P < 0.0001. (D) The self-comparison in food intake between laser off and 20 Hz-20 ms stimulation in both EYFP and ChR2 groups. Two-way ANOVA followed by Sidak multiple comparisons test: F (1, 31) = 16.29, P = 0.0003. (E) The self-comparisons in food intake between laser-off, 20 Hz-20Mms, 20 Hz-20 ms with DNQX/AP5 in the ChR2 group. Animals N = 5. One-way repeated ANOVA followed by Turkey multiple comparisons test: Laser off vs. 20 Hz, 20 ms, P = 0.0206; 20 Hz, 20 ms vs. 20 Hz, 20 ms (DNQX+AP5), P = 0.0063. (F) Quantitative comparisons in distance and time in the center in the open field test (OFT) between the two groups. Two-way ANOVA followed by Sidak multiple comparisons test: Distance, F (2, 26) = 20.71, P < 0.0001; Time in center, F (2, 24) = 11.60, P = 0.0003. (G) Representative moving tracks (pink color) of animals from EYFP (top) and ChR2 (bottom) group in the real time place avoidance test. The left half of chamber (blue and light cyan color) was paired with photostimulation (20 Hz, 20 ms) while the right half (gray color) was not. (H and I) Quantitative comparisons in duration and velocity in two halves of chambers between control EYFP and ChR2 groups. Two-way ANOVA followed by Sidak multiple comparisons test: H, F (1, 13) = 61.16, P < 0.0001; I, F (1, 12) = 16.83, P = 0.0015. (J) Schematic diagram showing virus injections and optic cannula implantation to test the behavioral effects of inhibiting co-lateral projections from VTA projecting BFVglut2 neurons. (K) Fos expression patterns in the BF of animals that received 10-min laser stimulation with or without treatment of CNO. (L) Qualitative results of Fos expressions within the BF. Unpaired t-test: P = 0.0317. (M and N) Quantification results of fasting refeeding test (M) and real time place avoidance test (N). Two-way ANOVA followed by Sidak multiple comparisons test: M, F (1, 6) = 0.0008487, P = 0.9777; N, F (1, 8) = 23.61, P = 0.0013.
Figure 4.
Figure 4.. Acute activation of VTAVglut2 neurons decreased food motivation and induces anxiety.
(A) Schematic diagram showing the hM3Dq virus injection in VTAVglut2 neurons for chemogenetic activation. (B) Expression pattern of mCherry (top) or hM3Dq (bottom) and Fos immunostaining in the VTA. Scale bar = 200 μm. (C) Qualitative comparisons in the percentages of Fos-positive neurons in the viral (mCherry) labelled neurons shown in an anterior to posterior bregma order. Two-way repeated ANOVA followed by Sidak multiple comparisons test: F (1,32) = 30.24, P < 0.0001. (D) Comparisons in cumulative fasting-refeeding food intake within 6 hours post saline and CNO application between mCherry and hM3Dq groups. Two-way ANOVA followed by Sidak multiple comparisons test: F (15, 105) = 19.90, P < 0.0001 (E) Schematic diagram showing procedures and timing of nose poke training and testing in mice. FR: fixed ratio. (F) Comparisons in sucrose pellets acquired during the testing session between the mCherry and hM3Dq groups after saline and CNO application. Two-way ANOVA followed by Sidak multiple comparisons test: F (1, 10) = 56.42, P < 0.0001. (G) Qualitative results of HFD preference test in control and hM3Dq groups. Two-way ANOVA followed by Sidak multiple comparisons test: F (1, 11) = 13.18, P=0.004. (H) Real-time locomotor activities from metabolic cages. The arrow indicates when the mice were injected with saline or CNO. (I) Comparisons of average locomotion within 6 hours after saline or CNO treatment. Two-way repeated ANOVA followed by Sidak multiple comparisons test: F (1, 8) = 17.76, P = 0.0029. (J and K) Comparisons of time (J) spent and frequency entering (K) in light chambers during the light-dark box test. Two-way repeated ANOVA followed by Sidak multiple comparisons test: J, F (1, 10) = 11.41, P = 0.007; K, F (1, 10) = 21.39, P = 0.0009.
Figure 5.
Figure 5.. Effects of chronic activation of VTAVglut2 neurons led to major hallmarks of anorexia.
(A) Schematic diagram showing injections of the NaChBac virus to the VTA for chronic activation of VTAVglut2 neurons. (B) Representative coronal sections of the VTA showing Fos immunostaining from EYFP (top) and NaChBac (bottom) mice. Scale bar = 200 μm. (C) Quantitative comparisons in the number of Fos-positive neurons in EGFP-labeled Vglut2 neurons between control and NachBac mice. Two-way ANOVA followed by Sidak multiple comparisons test: F (1, 35) = 46.51, P < 0.0001. (D) Comparisons in weekly body weight for the 16 weeks after viral delivery. From 0 to 8 weeks post-surgery, mice were fed chow diet and from 9 to 16 weeks post-surgery, mice were fed with high fat diet (HFD). Two-way repeated ANOVA followed by Sidak multiple comparisons test: F (16, 190) = 17.22, P < 0.0001. (E) The comparison in daily food intake on chow diet between the two groups. Unpaired student’s t test, P = 0.0251. (F) Real-time locomotor activity patterns measured by the CLAMS metabolic cages. (G and H) Comparisons in the locomotor activity levels measured during periods of the day (left) and the night (right). Unpaired t-test: G, P = 0.0475; H, P = 0.2154.
Figure 6.
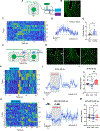
Figure 6.. DA signals decresed in the NAc in response to activation of the BFVglut2 → VTAVglut2 projections.
(A) Schematic diagram showing virus injections and optic cannula implantations for recording DA release in the NAc. (B) Representative coronal sections of the VTA showing gDA3m expression pattern and cannula tracks. Scale bar = 200 μm. (C) Heatmap of DA release Z-score signals corresponding to first feeding bouts of individual trials. Signals were re-scaled from 0 to 1 across each row. (D) Averaged Z-score signals of DA release in the NAc corresponding to first feeding bouts. The light blue shade represents signals with mean +/− SEM. Time = 0 was the onset of feeding. (E) Averaged Z-scores during baseline and feeding. Paired student’s t-test: P = 0.0268. Animals N = 3. (F) Schematic diagram showing virus injections and optic cannula implantations to record DA release in the NAc with photostimulation of BFVglut2 → VTAVglut2 projections. (G) Representative coronal sections of the BF, the VTA and the NAc showing injection patterns of ChR2 and gDA3m and cannula tracks. Scale bar = 200 μm. (H) Heatmap of DA release Z-score signals of individual trials in response to10-second photostimulation. Signals were re-scaled from 0 to 1 across each row. The indigo box indicates the period of photostimulation. (I) Averaged trace of DA release Z-score signals in the NAc in response to a period of 10 seconds of 20 Hz-20 ms photostimulation. (J) Averaged Z-scores during baseline, 20 Hz-20 ms stimulation and 5 seconds post stimulation. Paired student t-test: Stim vs. Base, P = 0.0349; Post vs. Stim, P = 0.0019. AnimaLS N = 5. (K) Heatmap of DA release Z-scores signals of individual trials when mice were engaging HFD feeding with photostimulation. Signals were re-scaled from 0 to 1 across each row. The indigo box shows the period with photostimulation. (L) Averaged signals of DA release in the NAc in response to a period of 10 seconds of 20 Hz-20 ms photostimulation right after the onset of HFD feeding. The blue shade represents signals in +/− SEM. Time = 0 was the onset of photostimulation. (M) Averaged Z-scores during baseline, 20 Hz-20 ms photostimulation, and 5 seconds post stimulation. Paired student t-test: Stim vs. Base, P = 0.0213; Post vs. Stim, P = 0.0223. Base: baseline. Stim: 20 Hz-20 ms photostimulation. Post: 5 seconds post photostimulation. Animals N = 5.

References

    1. Maniscalco JW, and Rinaman L (2017). Interoceptive modulation of neuroendocrine, emotional, and hypophagic responses to stress. Physiology & Behavior 176, 195–206. 10.1016/j.physbeh.2017.01.027. - DOI - PMC - PubMed
    1. Francois M, Canal Delgado I, Shargorodsky N, Leu CS, and Zeltser L (2022). Assessing the effects of stress on feeding behaviors in laboratory mice. Elife 11. 10.7554/eLife.70271. - DOI - PMC - PubMed
    1. Torres SJ, and Nowson CA (2007). Relationship between stress, eating behavior, and obesity. Nutrition 23, 887–894. 10.1016/j.nut.2007.08.008. - DOI - PubMed
    1. Nakamura C, Ishii A, Matsuo T, Ishida R, Yamaguchi T, Takada K, Uji M, and Yoshikawa T (2020). Neural effects of acute stress on appetite: A magnetoencephalography study. PLoS One 15, e0228039. 10.1371/journal.pone.0228039. - DOI - PMC - PubMed
    1. Thornton LM, Dellava JE, Root TL, Lichtenstein P, and Bulik CM (2011). Anorexia nervosa and generalized anxiety disorder: further explorations of the relation between anxiety and body mass index. J Anxiety Disord 25, 727–730. 10.1016/j.janxdis.2011.03.010. - DOI - PMC - PubMed

LinkOut - more resources