. 2023 Dec 13;31(12):2093-2106.e7.
doi: 10.1016/j.chom.2023.10.019. Epub 2023 Dec 5.

Duffy antigen is expressed during erythropoiesis in Duffy-negative individuals

Affiliations

Duffy antigen is expressed during erythropoiesis in Duffy-negative individuals

Celia Dechavanne et al. Cell Host Microbe. .

Abstract

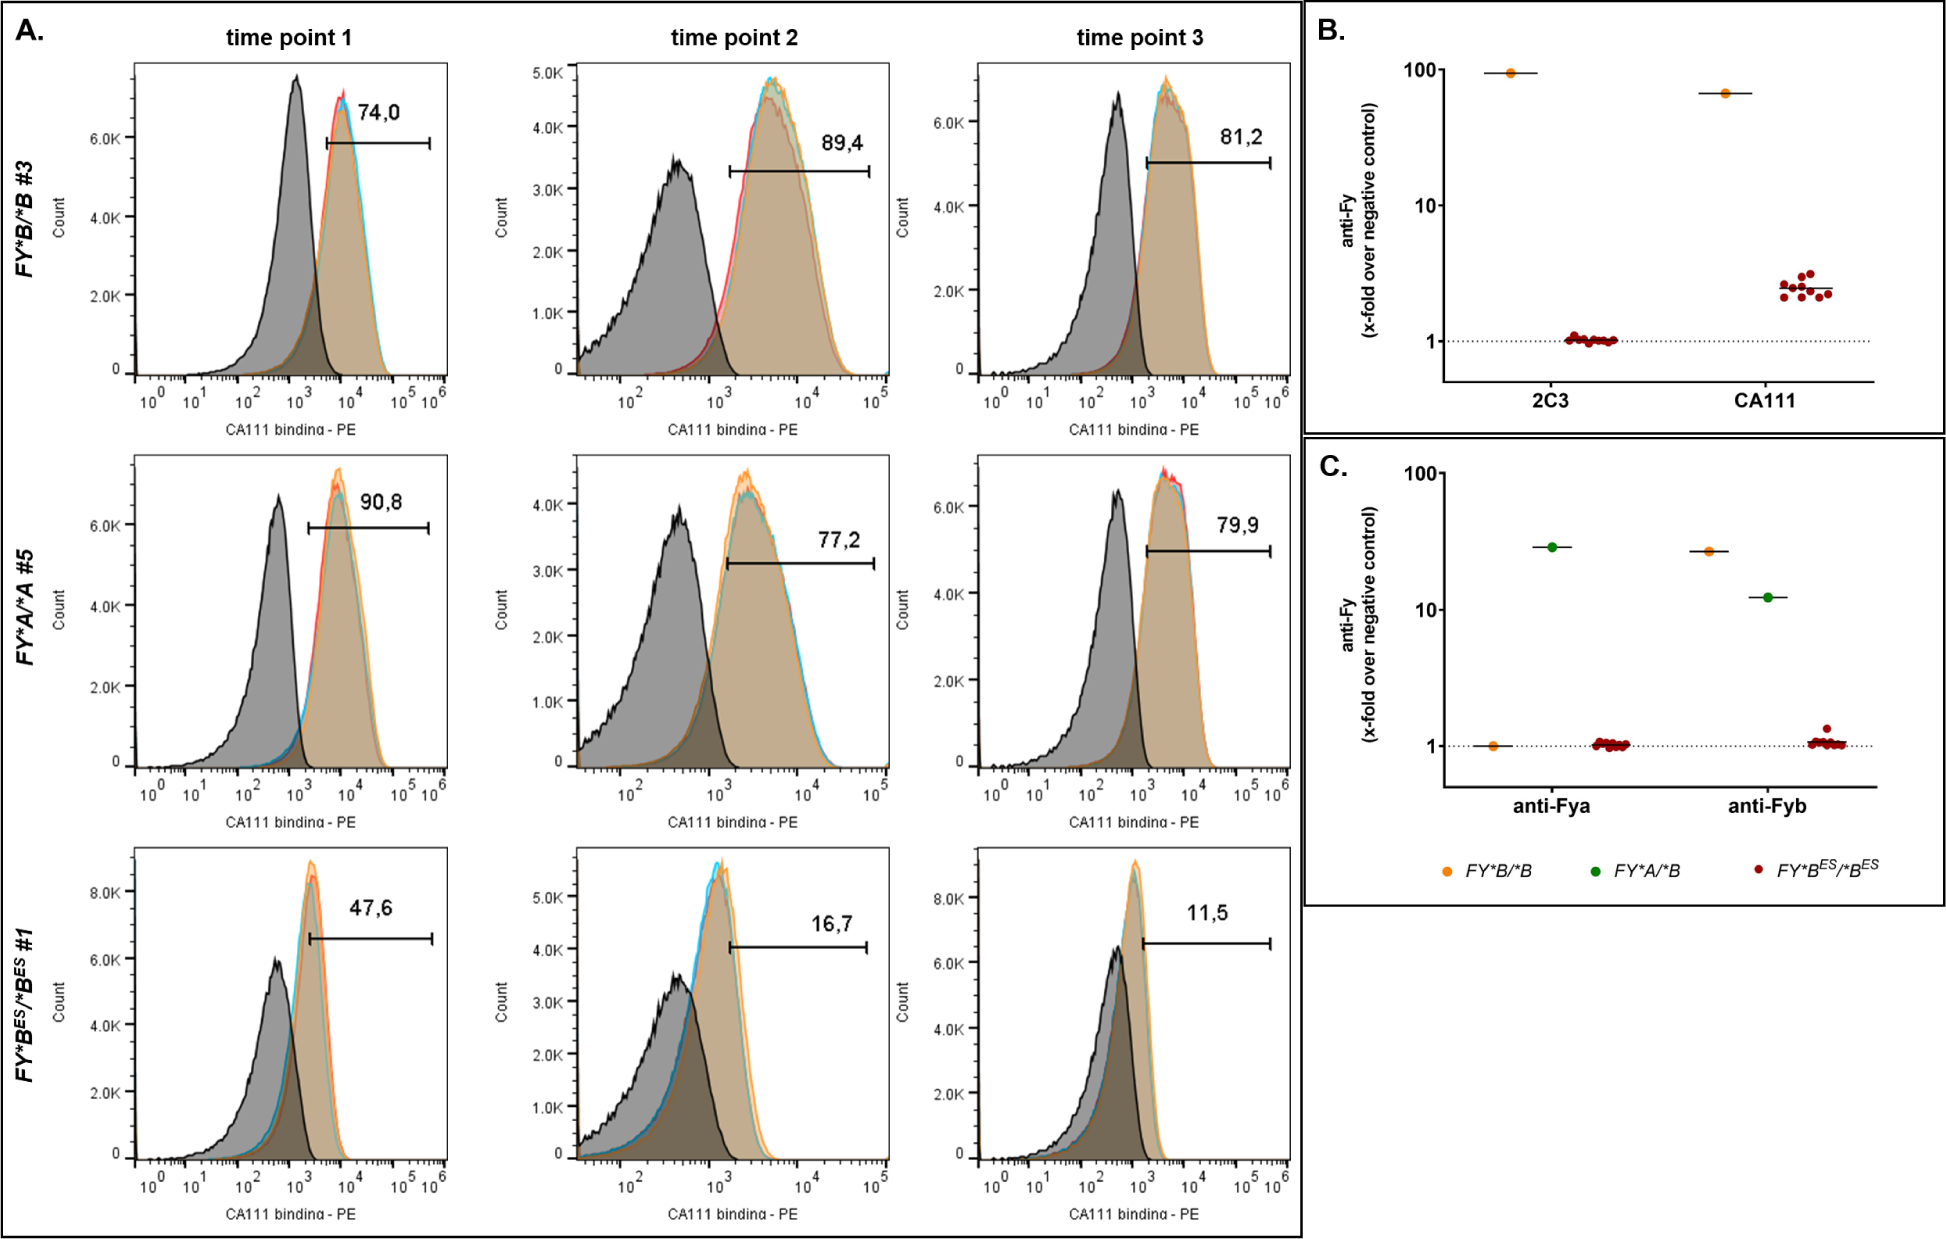
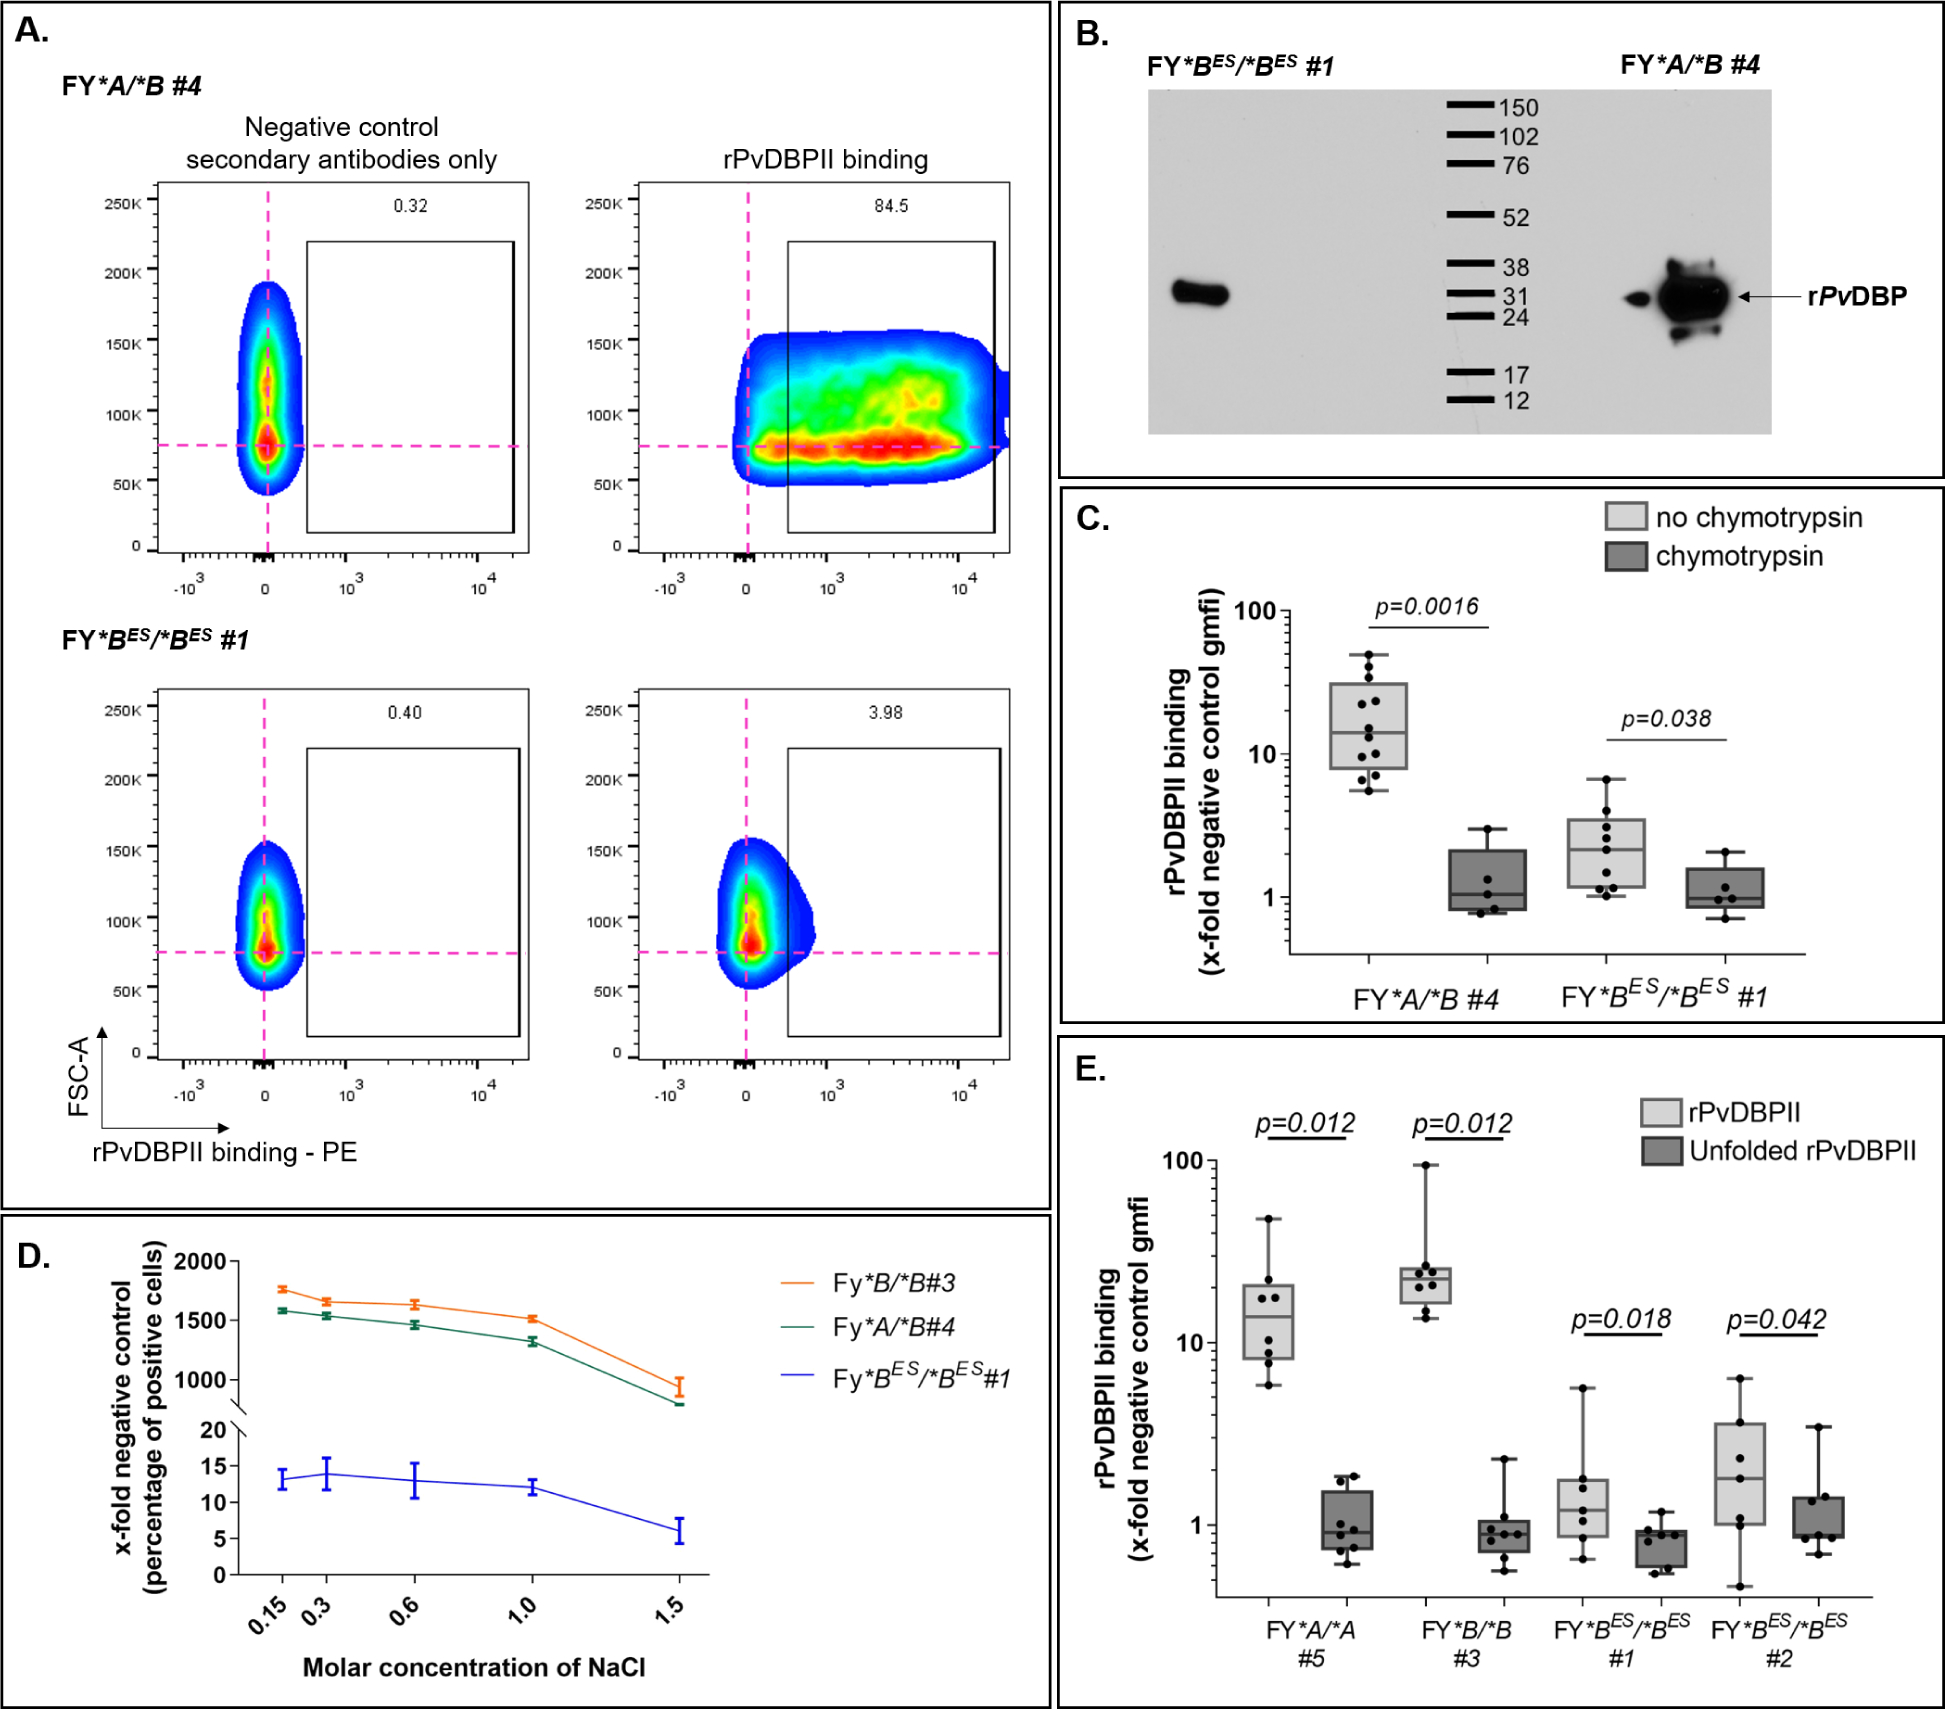
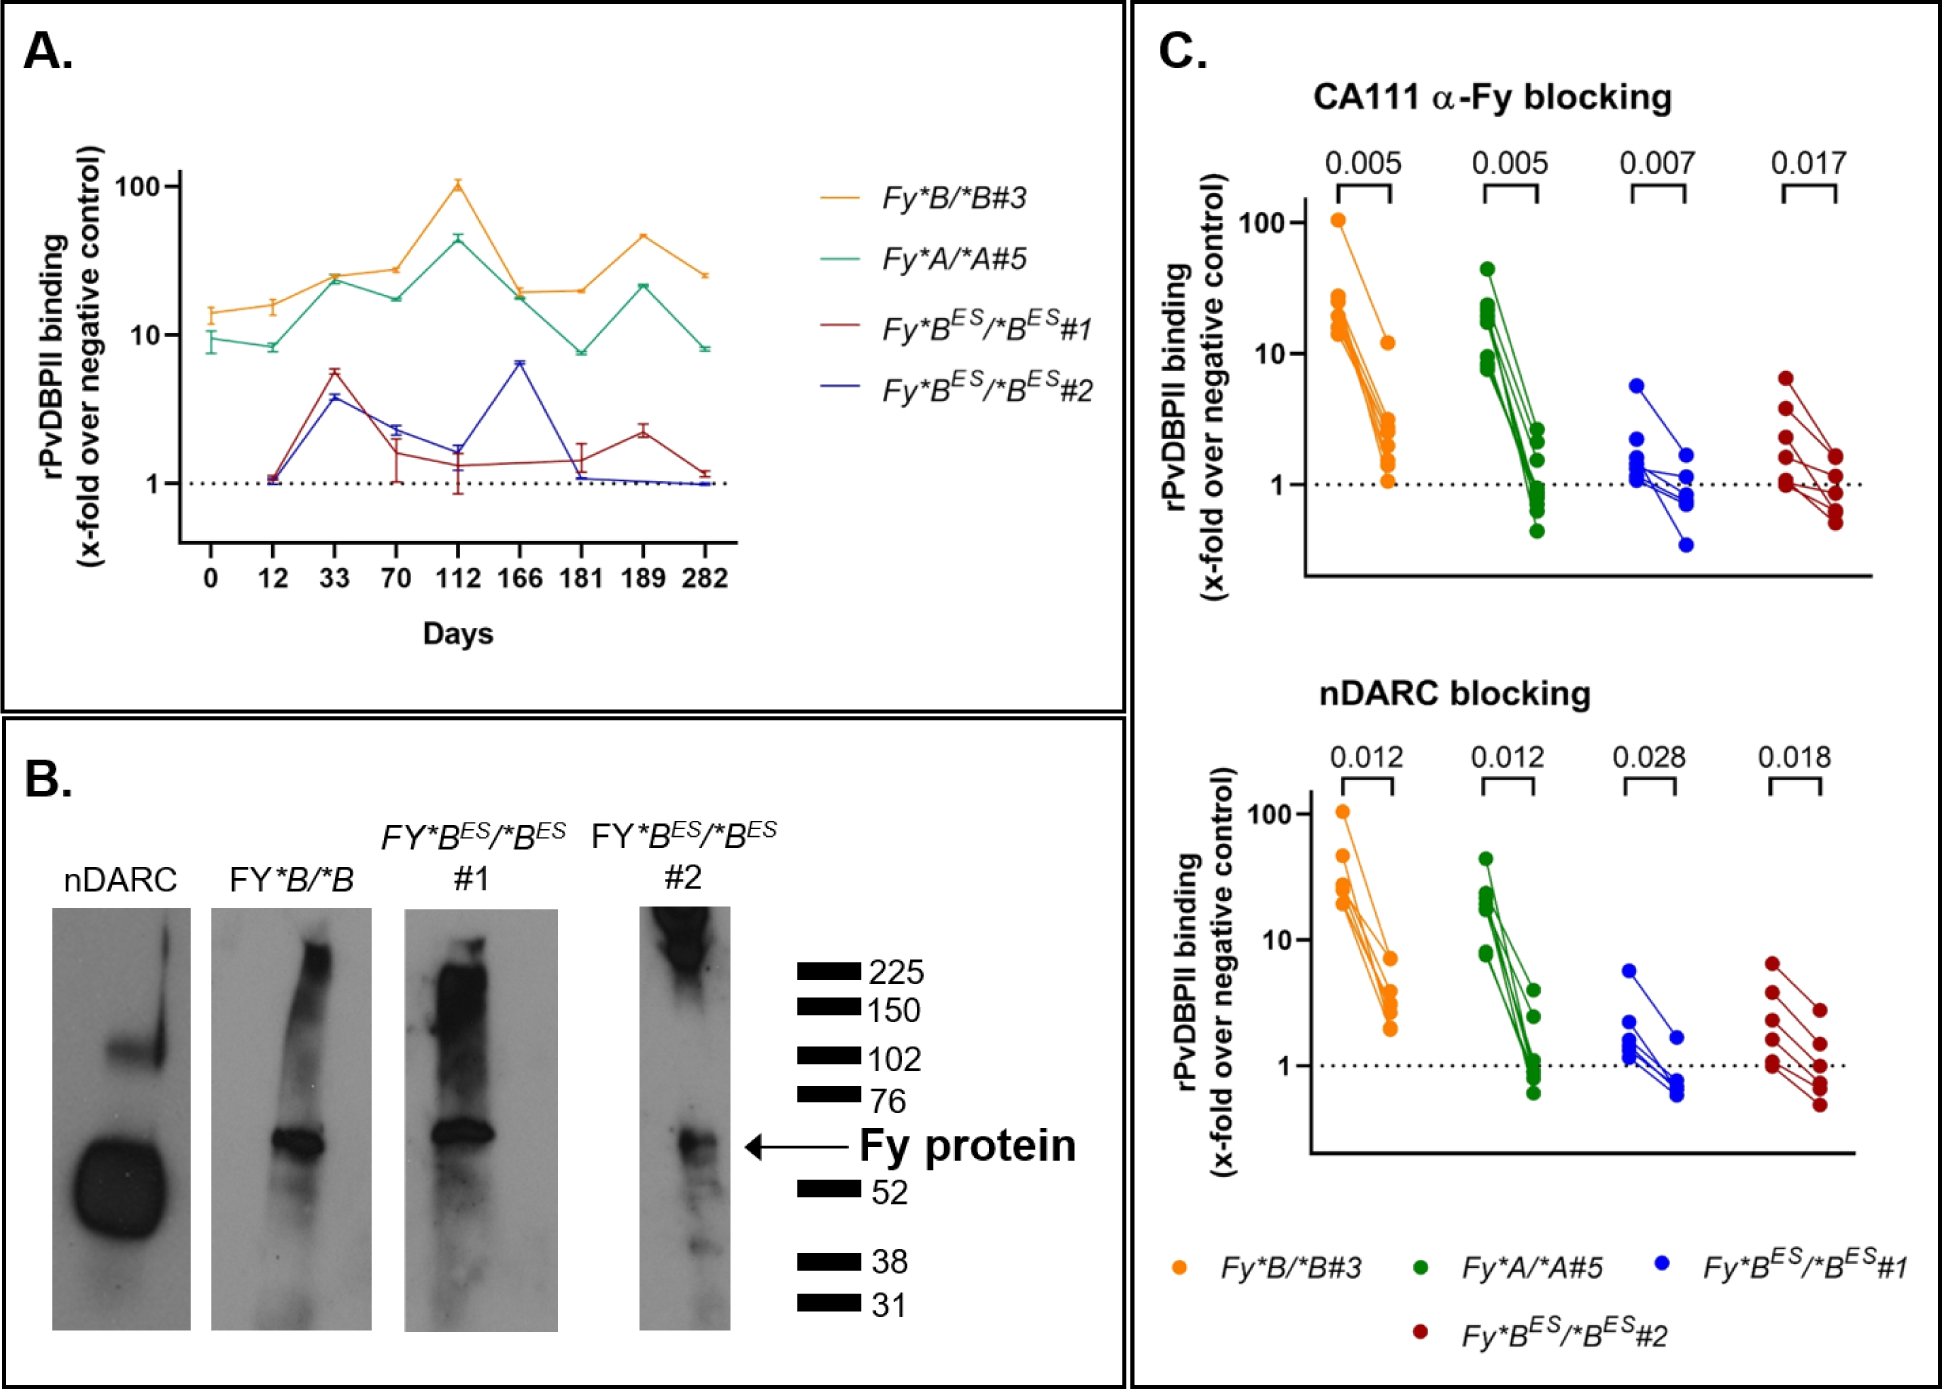
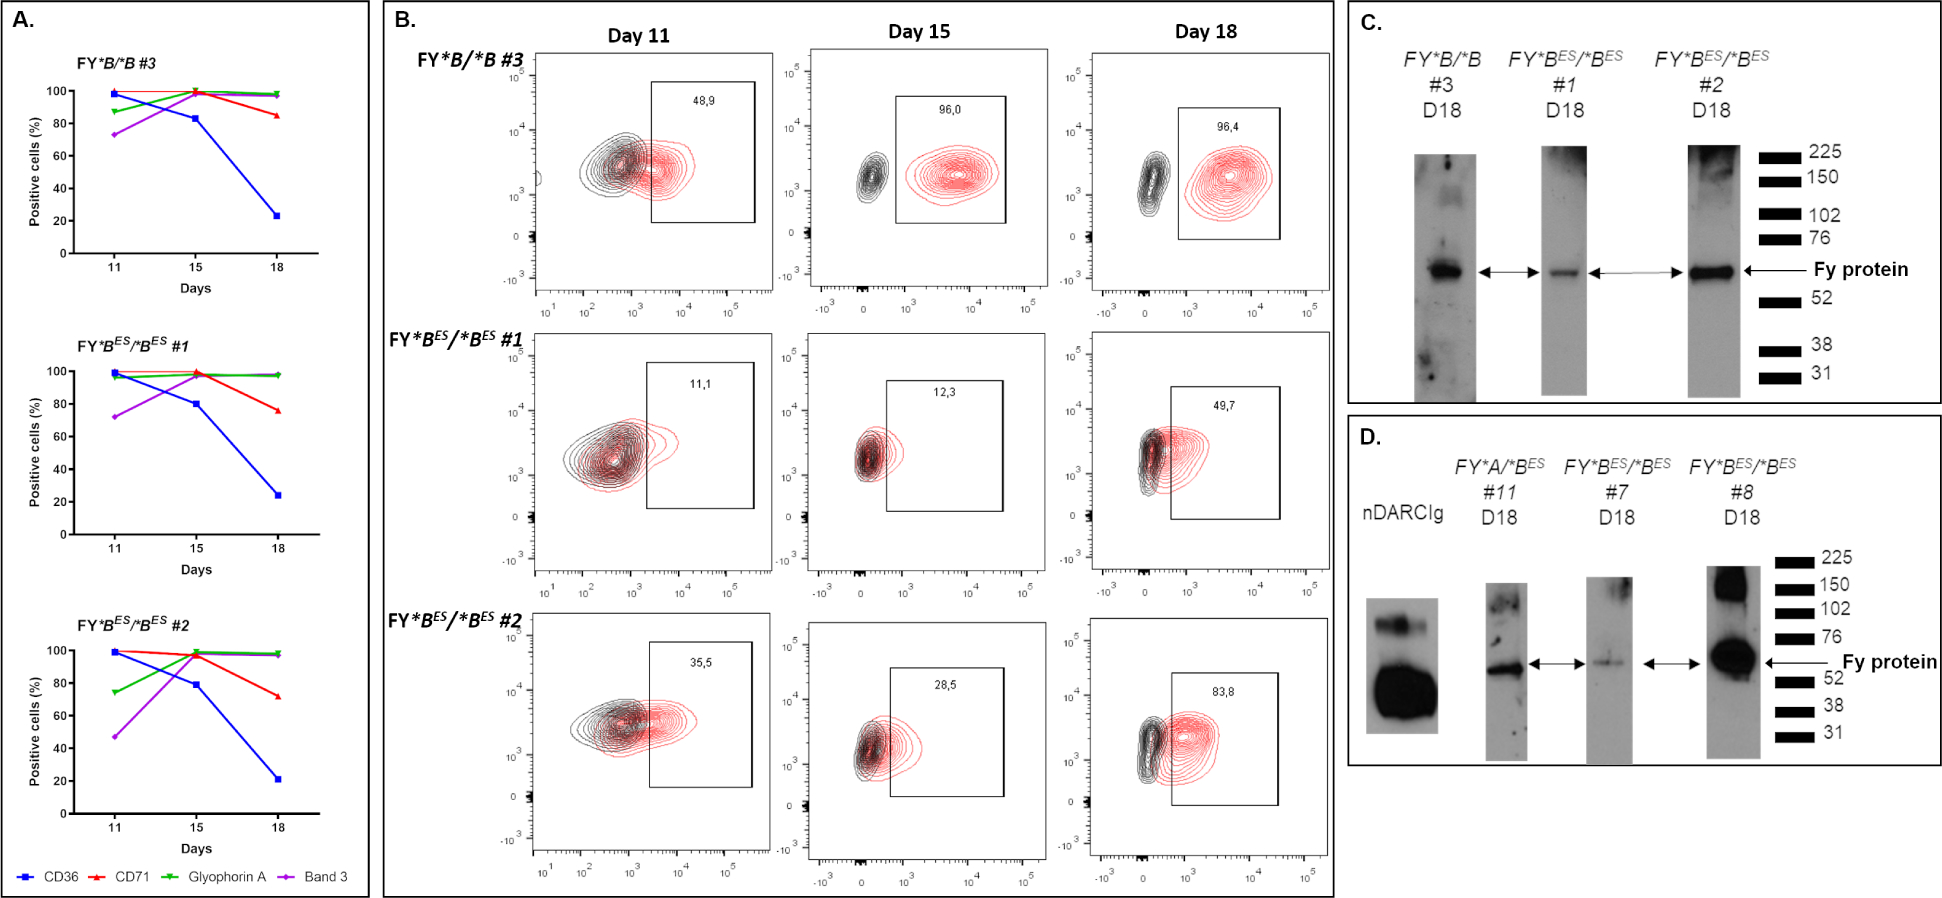
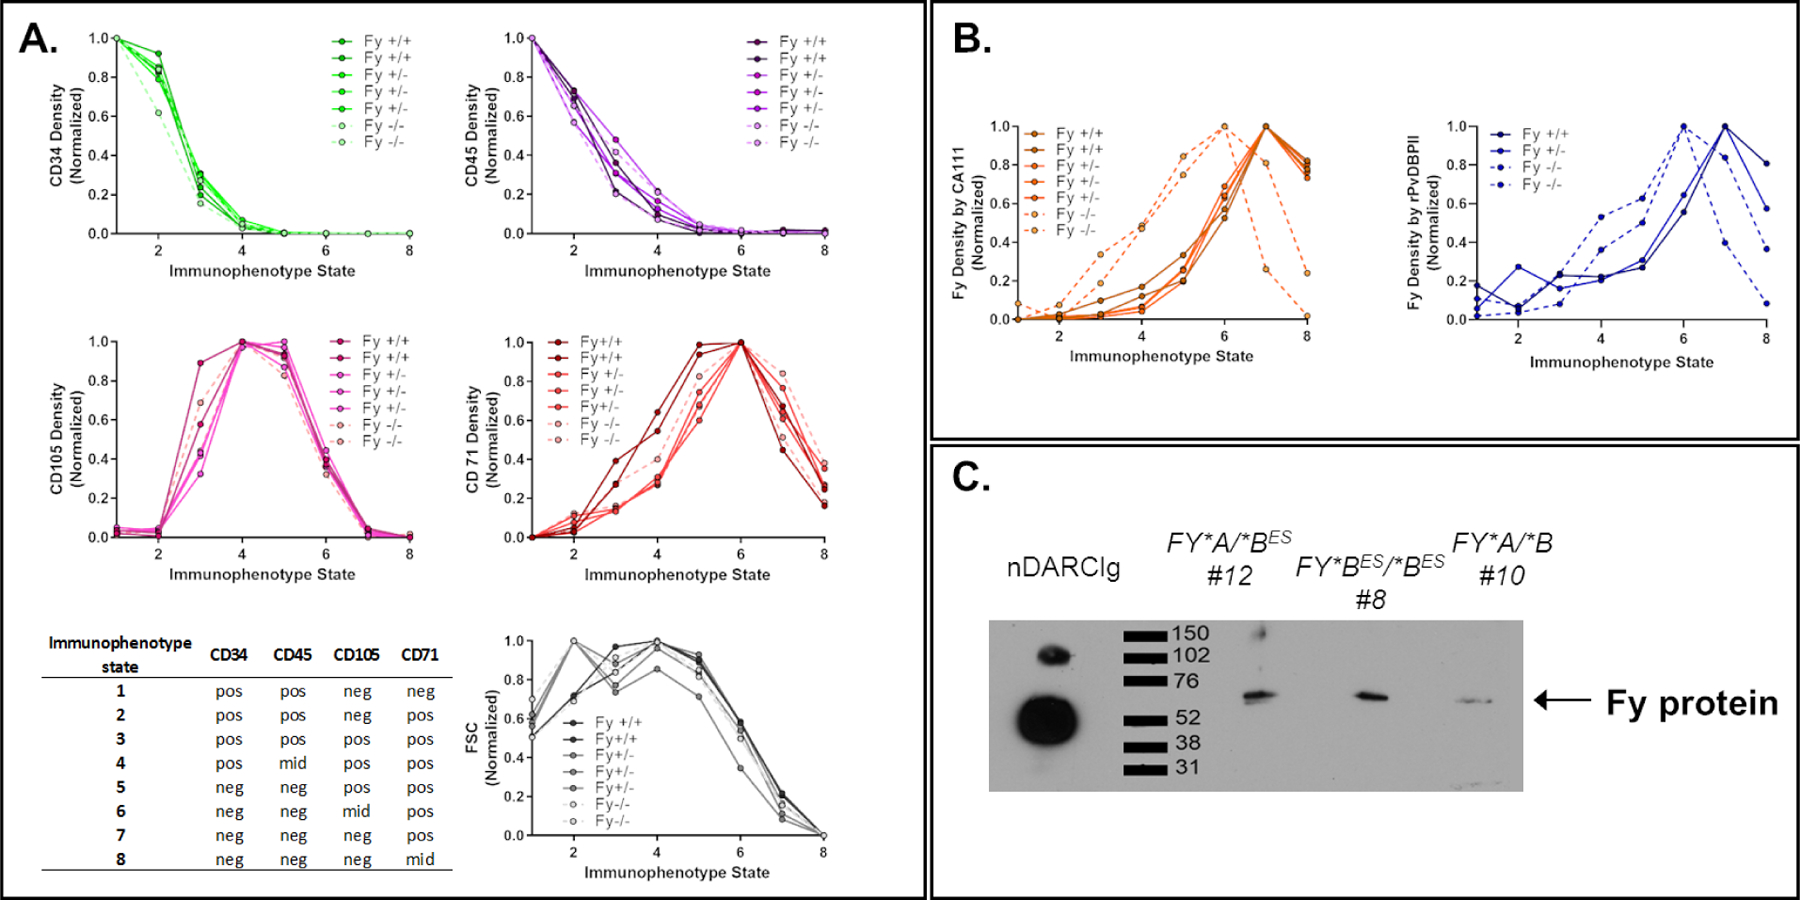
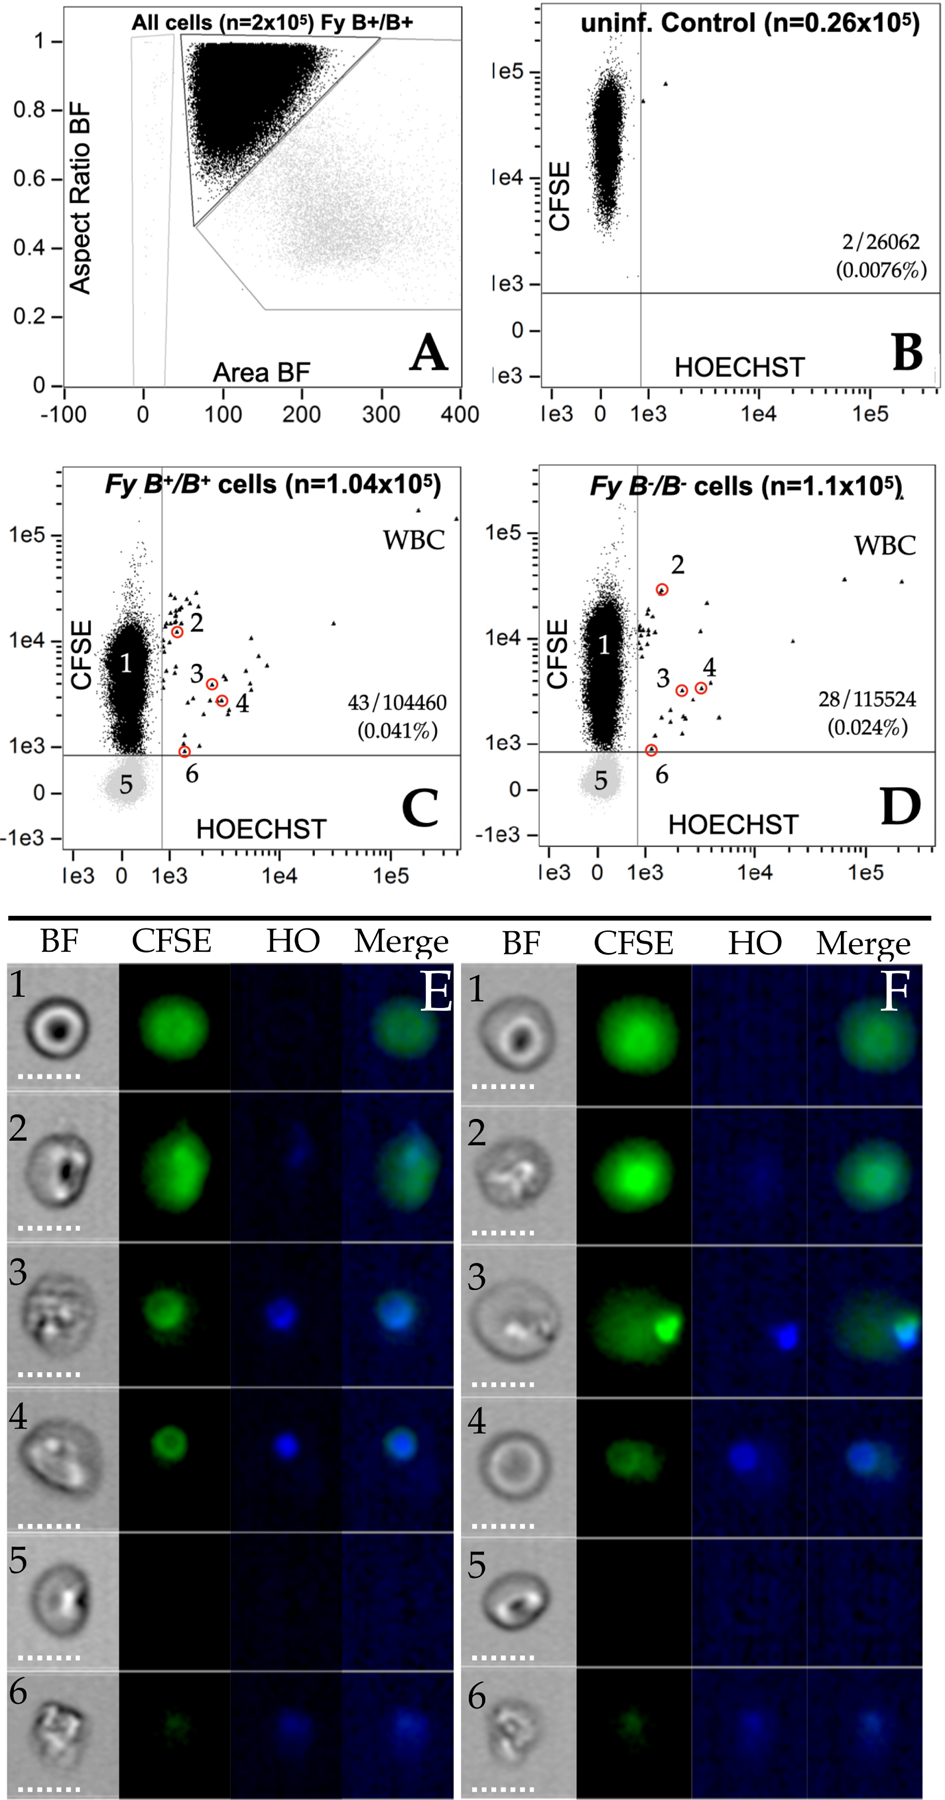
The erythrocyte silent Duffy blood group phenotype in Africans is thought to confer resistance to Plasmodium vivax blood-stage infection. However, recent studies report P. vivax infections across Africa in Fy-negative individuals. This suggests that the globin transcription factor 1 (GATA-1) SNP underlying Fy negativity does not entirely abolish Fy expression or that P. vivax has developed a Fy-independent red blood cell (RBC) invasion pathway. We show that RBCs and erythroid progenitors from in vitro differentiated CD34 cells and from bone marrow aspirates from Fy-negative samples express a functional Fy on their surface. This suggests that the GATA-1 SNP does not entirely abolish Fy expression. Given these results, we developed an in vitro culture system for P. vivax and show P. vivax can invade erythrocytes from Duffy-negative individuals. This study provides evidence that Fy is expressed in Fy-negative individuals and explains their susceptibility to P. vivax with major implications and challenges for P. vivax malaria eradication.

Keywords: Duffy protein; Duffy-negative individuals; Plasmodium vivax invasion; bone marrow; erythroid progenitors.


Conflict of interest statement

Declaration of interests The authors declare no competing interests.

Figures

Figure 1.
Figure 1.. Binding of Fy-specific antibodies on Fy-positive and Fy-negative pbRBC.
A - Direct binding of CA111 anti-Fy6 to pbRBC from FY*B/*B, FY*A/*A and FY*BES/*BES donors. Experiments were performed in triplicate (histograms in red, orange and blue in overlay) ; each donor was tested at three independent time points. Individual donor samples minus CA111 (plus anti-HA mouse antibody and goat anti-mouse PE-conjugated antibody) served as negative controls represented in each histogram in dark. The percentage of cells with CA111 binding (PE: phycoerythrin) over the background is indicated above the gate. The x-folds over negative control (geometric mean of fluorescence intensity (gmfi)) were higher than 48 for FY*B/*B #3 or FY*A/*A #5 and were equal to 6, 5 and 4 for FY*BES/*BES #1 at the three time points respectively. B - Binding of 2C3 and CA111 anti-Fy6 to pbRBC from 1 FY*B/*B donor (orange) and 10 FY*BES/*BES donors (red). Each individual served as its own negative control: no primary antibody, only secondary antibodies (anti-HA (CA111), anti-mouse (2C3)). The x-fold is calculated using the gmfi of the binding of antibodies targeting the Fy6 epitope divided by the gmfi of the binding of the secondary antibody only. C - Binding of anti-Fya and anti-Fyb to pbRBC from 1 FY*A/*B (green), 1 FY*B/*B donor (orange) and 10 FY*BES/*BES donors (red). Each individual served as its own negative control: no primary antibody, only secondary antibodies (anti-human-Fya or -Fyb). The x-fold is calculated using the gmfi of the binding of antibodies targeting the Fy epitope divided by the gmfi of the binding of the secondary antibody only.
Figure 2.
Figure 2.. rPvDBPII binding on FY*BES /*BES pbRBC.
A - rPvDBPII binding on FY*A /*B and FY*BES /*BES pbRBC. The pink cross provides a point of reference for cell populations in negative controls (no rPvDBPII and secondary antibody only). The percentage of rPvDBPII binding cells over background is indicated above the gate. B - rPvDBPII binding and dissociation to Fy-positive and Fy-negative pbRBC - pbRBC were exposed to rPvDBPII (20 μg/mL, 2 hr.; room temperature) to allow protein binding. The western blot of dissociated proteins from FY*BES/*BES (left) and FY*A/*B (right) pbRBC was probed with a polyclonal anti-PvDBP. The western blot included here is from an original intact gel and blot. This experiment was repeated 3 more times on fresh RBC from 2 FY*BES/*BES donors (data not shown). Those data were complemented with flow cytometry data. C - Chymotrypsin binding assessment - Without chymotrypsin treatment (light gray boxes); with chymotrypsin treatment (dark gray boxes); individual data points (filled black circles); FY*A/*B - without chymotrypsin (N=12); with chymotrypsin (N=5); for FY*BES/*BES - without chymotrypsin (N=9); with chymotrypsin (N=5); evaluated by non-parametric paired Wilcoxon rank-sum test. FY*A/*B (P-value = 0.0016); FY*BES/*BES (P-value = 0.038). D - rPvDBPII dissociation assessment of non-specific binding - No significant reduction in rPvDBPII binding was observed across increasing NaCl concentrations from 0.15M to 1.0M; addition of 1.5M NaCl caused significant reduction in rPvDBPII binding (Pearson Chi2 test, p=0.014: Pearson Chi2=6.0). Each curve represents a different donor: FY*B/*B #3 (black circle), FY*A/*B #4 (white square), FY*BES/*BES #1 (black triangle). E - Comparative binding between folded (gray boxes) and unfolded rPvDBPII (dark boxes; same amino acid sequence) to pbRBC - Non-parametric Wilcoxon matched pairs sign rank test evaluated the median differences between rPvDBPII folded vs unfolded; n=8 for each Fy-positive and n=7 for each Fy-negative donors. FY*A/*A: p=0.012; FY*B/*B: p=0.012; FY*BES/*BES #1: p=0.018; FY*BES/*BES #2: p=0.042. Unfolded rPvDBPII interaction with pbRBC from four study participants showed no significant difference (non-parametric median test Pearson Chi2: p=0.853).
Figure 3.
Figure 3.. Specific rPvDBPII binding on Fy-positive and Fy-negative pbRBC over time.
A - rPvDBPII binding on Fy-positive and Fy-negative pbRBC over time – Binding of rPvDBPII to pbRBC was followed for up to 282 days (10 months): one FY*B/*B (donor #3, orange), one FY*A/*A (donor #5, green), two FY*BES/*BES (donor #1, red; donor #2, blue); binding tested in triplicate (minimum, maximum and mean value) and represented as the x-fold increase over negative control. Those data complete the Fy-expression in the cross sectional study represented in Fig1B. Each donor served as its negative control for each time point. The same antibodies and flow cytometer (Attune NxT) were used in each experiment. B - Specific capture and detection of the Fy protein from the surface of pbRBC. This figure presents direct evidence of the specific capture, immunoprecipitation and detection of the Fy protein from the surface of the pbRBC of FY*B/*B and FY*BES/*BES donors. In the left panel, nDARCIg panel – the monomeric and dimeric nDARCIg species were distinguishable. Experimental panels – Fy6-specific CA111-based capture of the Fy protein from pbRBC of FY*B/*B (Donor #3; day 112), FY*BES/*BES (Donor #1; day 112) and FY*BES/*BES (Donor #2; day 189). Western blot detection of CA111-captured Fy protein was performed using polyclonal anti-ACKR1 (LS Bioscience). See SI Methods Section 7 for western blot raw data. This experiment was repeated twice on fresh RBC from 2 FY*BES/*BES donors (data not shown). Those data were complemented with flow cytometry data. C - Blocking of the rPvDBPII binding to Fy-positive and Fy-negative pbRBC – Upper Panel – Inhibition of rPvDBPII binding with addition of the anti-Fy6-specific CA111. Lower Panel – Inhibition of rPvDBPII binding with addition of the nDARCIg. Only the experiments showing a decrease of at least two times were represented on the graphics. Experiments included in the statistical analysis: n=9 for FY*B/*B#3, n=7 for FY*A/*A#5, n=7 for FY*BES/*BES#1, n=7 for FY*BES/*BES#2 - Non-parametric Wilcoxon matched pairs sign rank test evaluated the differences of rPvDBPII binding without or with blocking for each individual. The dashed line represents equivalent binding compared to the negative controls. Each dot is the mean of 2 to 3 technical replicates. Data of rPvDBPII binding in Fig3C are also represented in Fig3A with error bars. Two connected dots refer to one experiment.
Figure 4.
Figure 4.. Fy protein expression during in vitro CD34pos erythroid precursors differentiation.
The CD34pos erythroid precursor cells were expanded and differentiated for over 21 days. A - Monitoring of CD34 positive cells differentiation in vitro. CD34pos erythroid precursor cells were collected from the peripheral blood of 3 donors (1 Fy-positive and 2 Fy-negatives). In vitro differentiation was monitored by the presence/absence of the surface markers CD36, CD71, Glycophorin A and Band 3 on CD34pos erythroid precursor cells. As expected, during the differentiation process, the cells were losing the CD36 and CD71 signals whereas Glycophorin A and Band 3 signals were increasing. Overall, the cells from all the donors were observed to be at comparable stages over time. B - Fy expression on differentiated CD34pos from FY*B/*B and FY*BES/*BES donors. At Day11, Day15 and Day18, the expression of Fy protein was detected by flow cytometry using CA111 anti-Fy6. For each donor, the percentage of positive cells for the binding of CA111 is annotated in the black box (population in red within the CA111-PE positive gate) in comparison to its negative control (population in black, e.g. secondary antibody only). mfi: mean of fluorescence intensity. C, D - Expression of Fy protein in erythroid precursors isolated from peripheral blood of FY*B/*B and FY*BES/*BES donors (C) and from bone marrow of FY*A/*BES and FY*BES/*BES donors (D). Differentiated cells were harvested on Day18, membrane proteins were extracted and immunoprecipitated with CA111 anti-Fy6. The protein captured by Fy-specific CA111 were detected with a commercial polyclonal anti-ACKR1 antibody by western blot. All original western blots and re-organization of lanes to present salient results are described SI Methods Section 7. The experiments of the Fig4C were repeated at Day11 and Day18 on differentiated CD34pos from two FY*BES/*BES donors (data not shown). The experiments of the Fig4D were repeated at Day11 and Day15 on differentiated CD34pos from two FY*BES/*BES donors and Day15 on differentiated CD34pos from one other FY*BES/*BES donor (data not shown). Those data were complemented with flow cytometry data.
Figure 5.
Figure 5.. Ex vivo expression of Fy protein among erythroid precursor sub-populations from bone marrow aspirates.
A, B - In the bone marrow, all stages of erythroid precursors are present except mature erythrocyte (that are circulating in the peripheral blood). The gating strategy is detailed in the SI and summarized in the table up left (pos: positive, mid: middle, neg: no expression). The density (mean of fluorescence intensity divided by the size of the cells) of each CD markers as well as CA111 anti-Fy6 or rPvDBPII binding to Fy protein was represented in different graphics. The Fy-negative donors were represented in dashed lines in the graphics. The profile of CD marker expression was similar between all Fy genotypes (A) whereas Fy expression appeared to be earlier during erythropoiesis in Fy negative compare to Fy positive individuals (B). C - Expression of Fy protein in Fy*BES/*BES CD45 negative erythroid precursors from ex vivo bone marrow. CD45 negative cells (erythroid precursors in bone marrow) of three bone marrow samples were sorted by flow cytometry. The membrane proteins of the sorted cells were then immunoprecipitated with the CA111 anti-Fy6 and revealed by Western blot with a commercial polyclonal anti-ACKR1 antibody (arrow). Fy-positive and Fy-negative showed a signal for the Fy protein in erythroid precursors. The western blot included here is from an original intact gel and blot. See SI Methods Section 7 for western blot raw data. This experiment was complemented with flow cytometry data.
Figure 6.
Figure 6.. In vitro invasion of pbRBCs from Fy-positive and Fy-negative North Americans by Malagasy P. vivax isolate.
6A. single cells (black data points) versus multiple (gray data points) cells by aspect ratio and area in the brightfield image; 6B; Control image using uninfected cells previously stained with CFSE. Y-axis CFSE; X-axis Hoechst; 6C. AMP2016.14 (CFSE[-]) mixed with Fy-positive, FY*B/*B target cells (CFSE[+]); 6D. AMP2016.14 (CFSE[-]) mixed with Fy-negative, FY*BES/*BES target cells (CFSE[+]); 8E1- E6. Individual cells identified in Panel 6C from AMP2016.14 added to FY*B/*B (Fy-positive). 8F1- F6. Individual cells identified in Panel 6D from AMP2016.14 added to FY*BES/*BES (Fy-negative). Additional data and plots are provided in the SI (Figure S8, Table S2, Figure S9, Figure S10, Figure S11).

Comment in

References

    1. Donahue RP, Bias WB, Renwick JH, and McKusick VA (1968). Probable assignment of the Duffy blood group locus to chromosome 1 in man. Proceedings of the National Academy of Sciences 61, 949–955. 10.1073/pnas.61.3.949. - DOI - PMC - PubMed
    1. Bachelerie F, Ben-Baruch A, Burkhardt AM, Combadiere C, Farber JM, Graham GJ, Horuk R, Sparre-Ulrich AH, Locati M, Luster AD, et al. (2014). International Union of Pharmacology. LXXXIX. Update on the Extended Family of Chemokine Receptors and Introducing a New Nomenclature for Atypical Chemokine Receptors. Pharmacol Rev 66, 1–79. 10.1124/pr.113.007724. - DOI - PMC - PubMed
    1. Darbonne WC, Rice GC, Mohler MA, Apple T, Hébert CA, Valente AJ, and Baker JB (1991). Red blood cells are a sink for interleukin 8, a leukocyte chemotaxin. J Clin Invest 88, 1362–1369. 10.1172/JCI115442. - DOI - PMC - PubMed
    1. Dawson TC, Lentsch AB, Wang Z, Cowhig JE, Rot A, Maeda N, and Peiper SC (2000). Exaggerated response to endotoxin in mice lacking the Duffy antigen/receptor for chemokines (DARC). Blood 96, 1681–1684. - PubMed
    1. Neote K, Darbonne W, Ogez J, Horuk R, and Schall TJ (1993). Identification of a promiscuous inflammatory peptide receptor on the surface of red blood cells. J Biol Chem 268, 12247–12249. - PubMed

Publication types

Substances

LinkOut - more resources