

Ambient nitrogen dioxide in 47 187 neighbourhoods across 326 cities in eight Latin American countries: population exposures and associations with urban features
- PMID: 38056968
- PMCID: PMC10716820
- DOI: 10.1016/S2542-5196(23)00237-1
Ambient nitrogen dioxide in 47 187 neighbourhoods across 326 cities in eight Latin American countries: population exposures and associations with urban features
Abstract
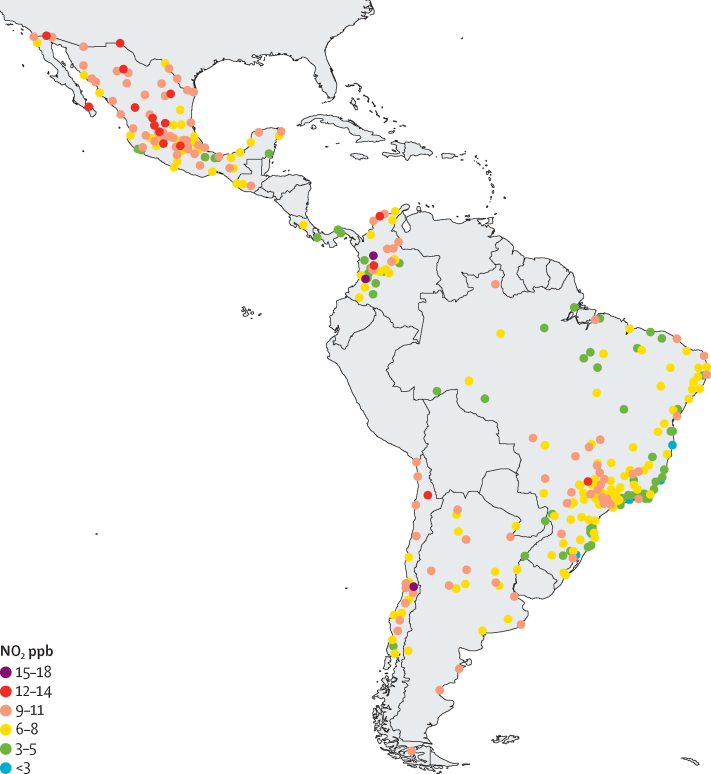
Background: Health research on ambient nitrogen dioxide (NO2) is sparse in Latin America, despite the high prevalence of NO2-associated respiratory diseases in the region. This study describes within-city distributions of ambient NO2 concentrations at high spatial resolution and urban characteristics associated with neighbourhood ambient NO2 in 326 Latin American cities.
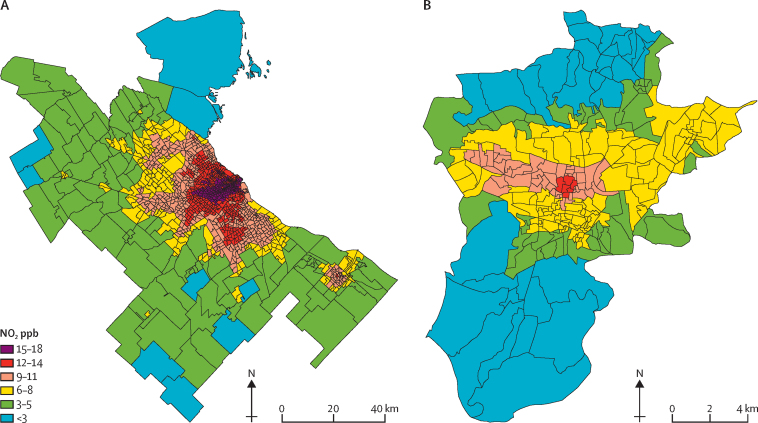
Methods: We aggregated estimates of annual surface NO2 at 1 km2 spatial resolution for 2019, population counts, and urban characteristics compiled by the SALURBAL project to the neighbourhood level (ie, census tracts). We described the percentage of the urban population living with ambient NO2 concentrations exceeding WHO air quality guidelines. We used multilevel models to describe associations of neighbourhood ambient NO2 concentrations with population and urban characteristics at the neighbourhood and city levels.
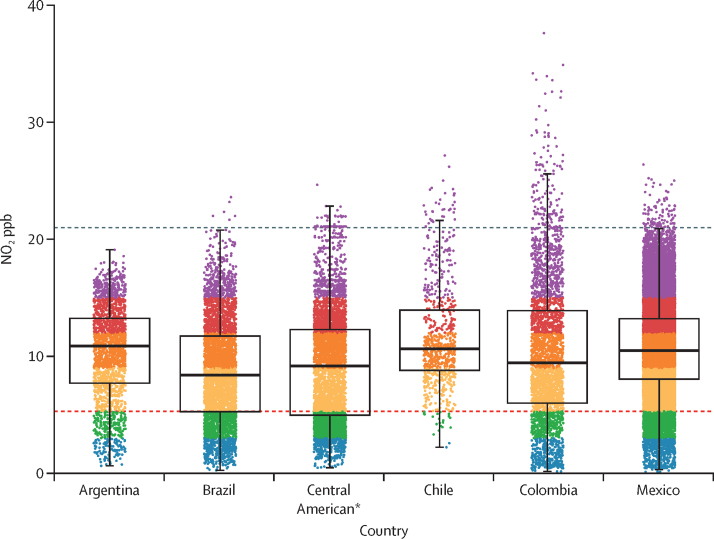
Findings: We examined 47 187 neighbourhoods in 326 cities from eight Latin American countries. Of the roughly 236 million urban residents observed, 85% lived in neighbourhoods with ambient annual NO2 above WHO guidelines. In adjusted models, higher neighbourhood-level educational attainment, closer proximity to the city centre, and lower neighbourhood-level greenness were associated with higher ambient NO2. At the city level, higher vehicle congestion, population size, and population density were associated with higher ambient NO2.
Interpretation: Almost nine out of every ten residents of Latin American cities live with ambient NO2 concentrations above WHO guidelines. Increasing neighbourhood greenness and reducing reliance on fossil fuel-powered vehicles warrant further attention as potential actionable urban environmental interventions to reduce population exposure to ambient NO2.
Funding: Wellcome Trust, National Institutes of Health, Cotswold Foundation.
Copyright © 2023 The Author(s). Published by Elsevier Ltd. This is an Open Access article under the CC BY 4.0 license. Published by Elsevier Ltd.. All rights reserved.
Conflict of interest statement
Declaration of interests We declare no competing interests.
Figures
Update of
-
Ambient nitrogen dioxide in 47,187 neighborhoods across 326 cities in eight Latin American countries: population exposures and associations with urban features.medRxiv [Preprint]. 2023 May 2:2023.05.02.23289390. doi: 10.1101/2023.05.02.23289390. medRxiv. 2023. Update in: Lancet Planet Health. 2023 Dec;7(12):e976-e984. doi: 10.1016/S2542-5196(23)00237-1. PMID: 37205591 Free PMC article. Updated. Preprint.
References
-
- US Environmental Protection Agency . US Environmental Protection Agency; Washington, DC: 2016. Integrated science assessment for oxides of nitrogen—health criteria.
-
- Luminati O, Ledebur de Antas de Campos B, Flückiger B, et al. Land use regression modelling of NO2 in São Paulo, Brazil. Environ Pollut. 2021;289 - PubMed
Publication types
MeSH terms
Substances
Grants and funding
LinkOut - more resources
Full Text Sources
Medical
