. 2024 Feb 26;36(3):764-789.
doi: 10.1093/plcell/koad301.

Cooperative actin filament nucleation by the Arp2/3 complex and formins maintains the homeostatic cortical array in Arabidopsis epidermal cells

Affiliations

Cooperative actin filament nucleation by the Arp2/3 complex and formins maintains the homeostatic cortical array in Arabidopsis epidermal cells

Liyuan Xu et al. Plant Cell. .

Abstract

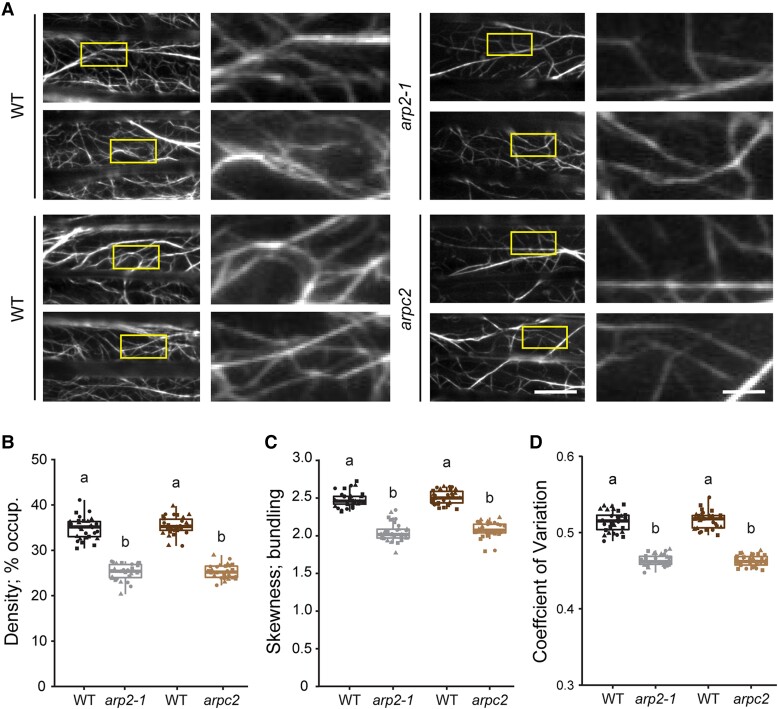
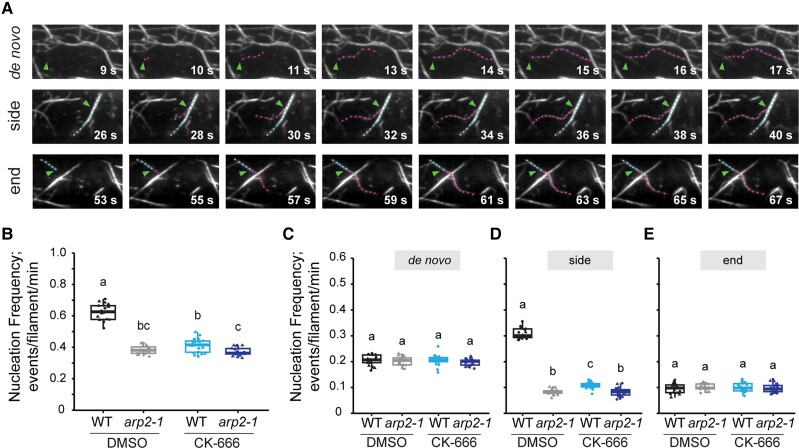
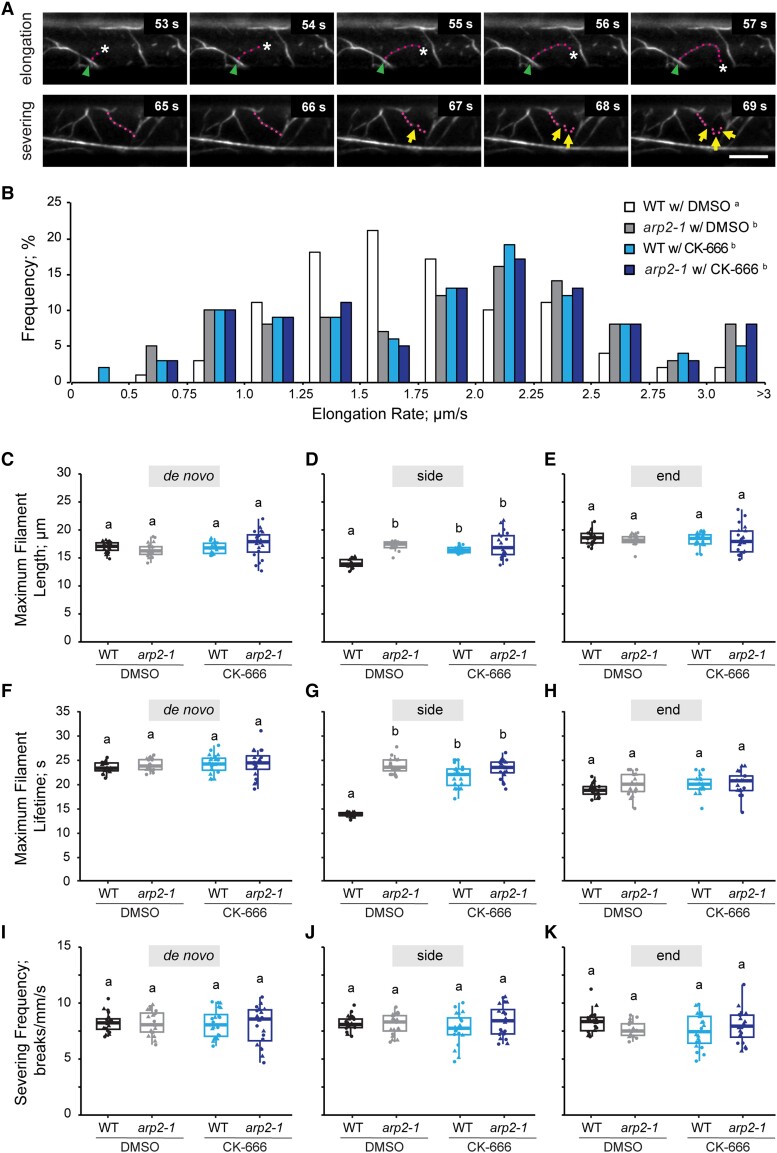
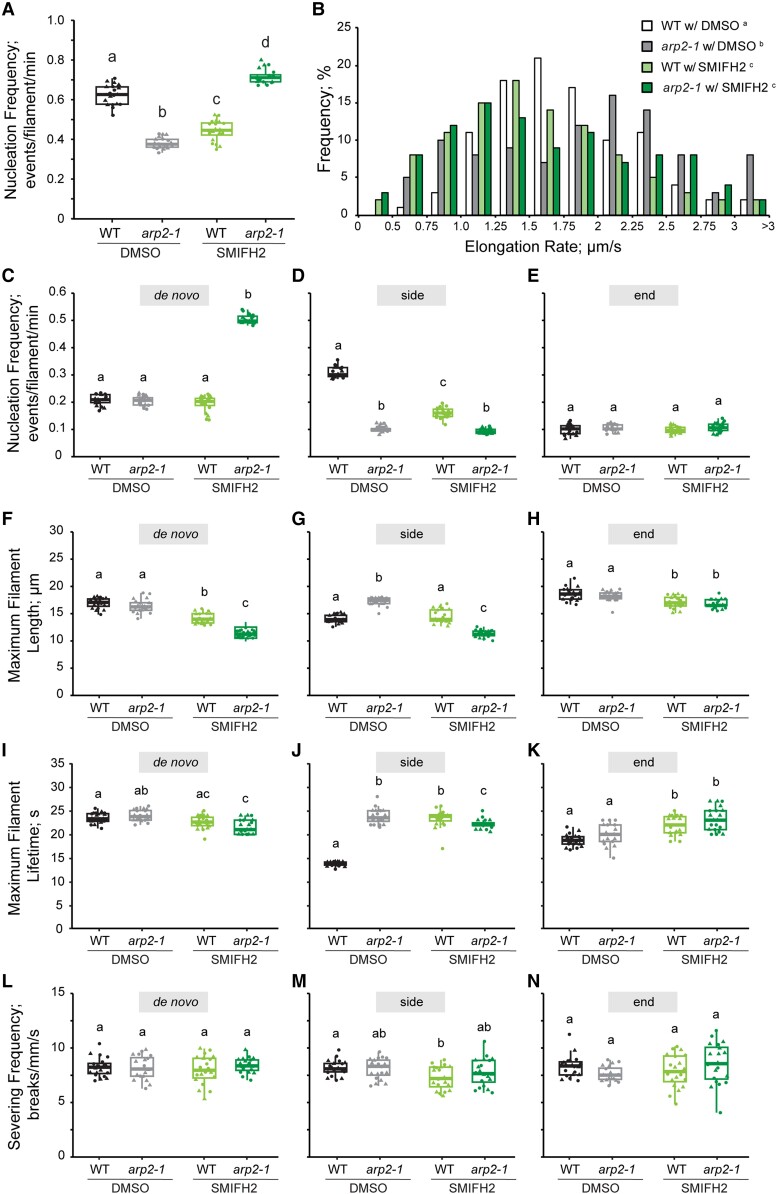
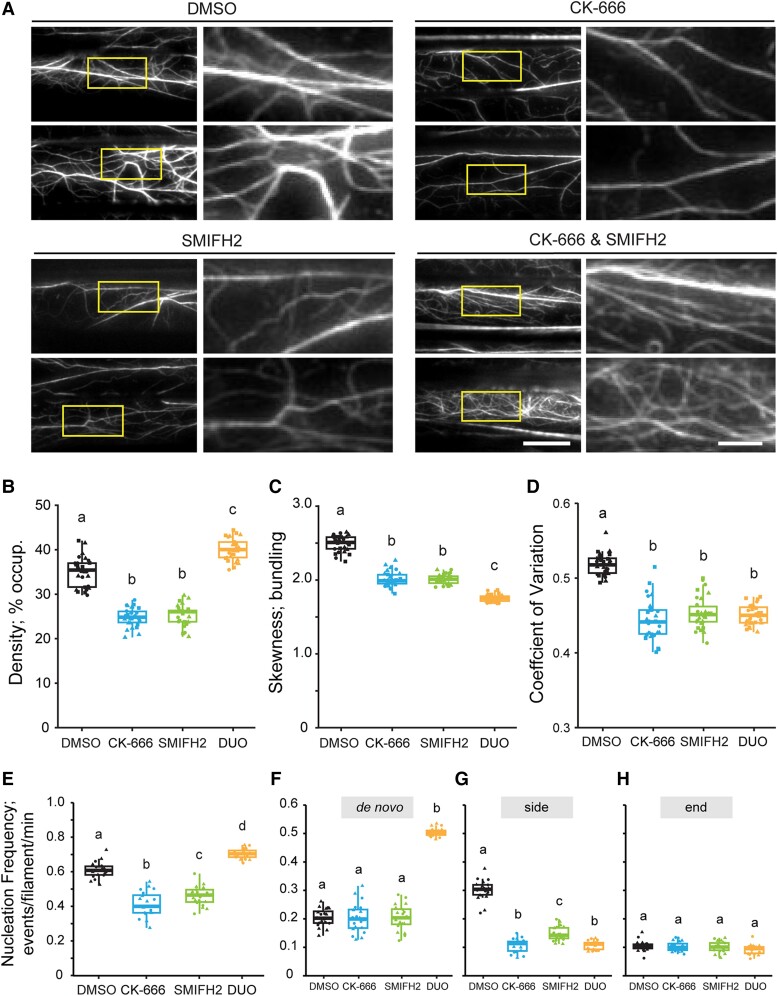
Precise control over how and where actin filaments are created leads to the construction of unique cytoskeletal arrays within a common cytoplasm. Actin filament nucleators are key players in this activity and include the conserved actin-related protein 2/3 (Arp2/3) complex as well as a large family of formins. In some eukaryotic cells, these nucleators compete for a common pool of actin monomers and loss of one favors the activity of the other. To test whether this mechanism is conserved, we combined the ability to image single filament dynamics in the homeostatic cortical actin array of living Arabidopsis (Arabidopsis thaliana) epidermal cells with genetic and/or small molecule inhibitor approaches to stably or acutely disrupt nucleator activity. We found that Arp2/3 mutants or acute CK-666 treatment markedly reduced the frequency of side-branched nucleation events as well as overall actin filament abundance. We also confirmed that plant formins contribute to side-branched filament nucleation in vivo. Surprisingly, simultaneous inhibition of both classes of nucleator increased overall actin filament abundance and enhanced the frequency of de novo nucleation events by an unknown mechanism. Collectively, our findings suggest that multiple actin nucleation mechanisms cooperate to generate and maintain the homeostatic cortical array of plant epidermal cells.


Conflict of interest statement

Conflict of interest statement. None declared.

Figures

Figure 1.
Figure 1.
Genetic disruption of the Arp2/3 complex leads to reduced actin filament density and bundling. A) Representative images of epidermal cells from the apical region of 5-d-old etiolated hypocotyls expressing GFP-fABD2 imaged by VAEM are shown in the left columns. Scale bar: 20 μm. ROIs (boxes) were magnified and shown in the right columns. Scale bar: 5 μm. B to D) Quantitative analysis of the percentage of occupancy or density of actin filament arrays B) and the extent of filament bundling as measured by skewness C) and coefficient of variance D) analyses. Both the density and the bundling of actin arrays in arp2-1 and arpc2 cells were significantly decreased compared to those in the respective wild-type cells. In box-and-whisker plots, boxes show the interquartile range and the median, and whiskers show the maximum–minimum interval of 3 biological repeats with independent populations of plants. Individual biological repeats are represented with different shapes (n = 30 seedlings, 10 seedlings per biological repeat). Letters a and b denote groups that show statistically significant differences with other genotypes by 1-way ANOVA with Tukey's post hoc test (P < 0.05). WT, wild type.
Figure 2.
Figure 2.
Actin filament nucleation frequency is decreased by chemical or genetic inhibition of the Arp2/3 complex. A) Representative time-lapse series showing 3 subclasses of actin filament origin identified in hypocotyl epidermal cells: actin filaments initiated de novo in the cytoplasm (top), from the side of a preexisting filament (middle), or from the end of a preexisting filament (bottom row). Blue dots: preexisting filament. Magenta dots: new growing filament. Arrowheads: nucleation site. Scale bar: 5 μm. B to E) Quantitative analysis of actin filament nucleation frequency, both overall B) and by subclass of origin C to E). Hypocotyls were treated with DMSO solution (0.05% DMSO) or 10 µM CK-666 for 5 min prior to imaging with VAEM. The overall nucleation frequency B) for each genotype or treatment was defined as the total number of filament origins per filament per minute in a 400-μm2 ROI. Total nucleation frequency in DMSO-treated wild-type cells was significantly higher than DMSO-treated arp2-1, CK-666-treated wild-type, or CK-666-treated arp2-1 cells. When filament origin events were categorized into de novo C), side D), and end populations E), only the side-branching nucleation events showed a significant reduction in arp2-1 and CK-666-treated cells compared to DMSO-treated wild-type cells. It should be noted that experiments reported here were conducted at the same time as those testing SMIFH2; therefore, control data sets for DMSO-treated wild-type and DMSO-treated arp2-1 cells are the same in Figs. 2 and 6. In box-and-whisker plots, boxes show the interquartile range and the median, and whiskers show the maximum–minimum interval of 2 biological repeats with independent populations of plants. Individual biological repeats are represented with different shapes (n = 20 seedlings, 10 seedlings per biological repeat). Letters a to c denote groups that show statistically significant differences with other genotypes or treatments by 2-way ANOVA with Tukey's post hoc test (P < 0.05). WT, wild type.
Figure 3.
Figure 3.
Actin filament dynamic properties are altered when the Arp2/3 complex is inhibited. A) A representative actin filament was tracked during the elongation phase (top) and another filament was fragmented into pieces during the severing phase (bottom). Magenta dots: growing actin filament. Arrowheads: nucleation site. Asterisk: elongating filament end. Yellow arrows: severing events. Scale bar: 10 μm. B) Quantitative analysis of the population distribution and average elongation rate of actin filaments in hypocotyl epidermal cells. Hypocotyls were treated with 0.05% DMSO solution or 10 µM CK-666 for 5 min prior to imaging with VAEM. The elongation rate distribution of DMSO-treated wild type had a single peak at 1.25 to 1.75 μm/s, whereas the Arp2/3-inhibited groups had 3 peaks at 0.75 to 1.25, 2.0 to 2.5, and >3 μm/s. It should be noted that experiments reported here were conducted at the same time as those testing SMIFH2; therefore, control data sets for DMSO-treated wild-type and DMSO-treated arp2-1 cells are the same in Figs. 3 and 6. n ≥ 100 single filaments from 2 individual biological repeats (for 1 biological repeat, 5 single filaments were counted in 1 hypocotyl from at least 10 hypocotyls per genotype or treatment). Letters a and b denote genotypes or treatments that show statistically significant differences with other groups by chi-squared test, P < 0.05. C to E) The average maximum length of side-branching filaments in DMSO-treated wild-type cells was significantly shorter than that in DMSO-treated arp2-1, CK-666-treated wild-type, or CK-666-treated arp2-1 cells; however, filaments that originated de novo or from preexisting ends did not show any significant difference. F to H) The average maximum lifetime of side-branching filaments in DMSO-treated wild-type cells was significantly shorter than that in DMSO-treated arp2-1, CK-666-treated wild-type, or CK-666-treated arp2-1 cells; however, filaments that originated de novo or from preexisting ends did not show any significant difference. I to K) The severing frequency did not show any significant difference between different genotypes or treatments. It should be noted that experiments reported here were conducted at the same time as those testing SMIFH2; therefore, control data sets for DMSO-treated wild-type and DMSO-treated arp2-1 cells are the same in Figs. 3 and 6. For box-and-whisker plots, boxes show the interquartile range and the median, and whiskers show the maximum–minimum interval of 2 biological repeats with independent populations of plants. Individual biological repeats are represented with different shapes (n = 20 seedlings, 10 seedlings per biological repeat). Letters a and b denote groups that show statistically significant differences with other genotypes or treatments by 2-way ANOVA with Tukey's post hoc test (P < 0.05).WT, wild type.
Figure 4.
Figure 4.
A small molecule inhibitor of the Arp2/3 complex, CK-666, reduces actin filament density and bundling. A) Representative images of epidermal cells from the apical region of 5-d-old etiolated hypocotyls are shown in the left columns. Scale bar: 20 μm. ROIs (boxes) were magnified and displayed in the right columns. Scale bar: 5 μm. Hypocotyls were treated with 0.05% DMSO solution or 10 µM CK-666 for 5 min prior to imaging with VAEM. Actin filament arrays in DMSO-treated arp2-1, CK-666-treated ARP2, and CK-666-treated arp2-1 cells appeared to be less dense and less bundled compared to DMSO-treated wild-type cells. B to D) Quantitative analysis of the percentage of occupancy or density of actin filament arrays B), and the extent of filament bundling as measured by skewness C) and CV D) analyses. Both the density and bundling of actin arrays in DMSO-treated arp2-1, CK-666-treated wild-type, and CK-666-treated arp2-1 cells were significantly decreased compared to DMSO-treated wild-type cells. It should be noted that experiments reported here were conducted at the same time as those testing SMIFH2; therefore, control data sets for DMSO-treated wild-type and DMSO-treated arp2-1 cells are the same in Figs. 4 and 5. In box-and-whisker plots, boxes show the interquartile range and the median, and whiskers show the maximum–minimum interval of 3 biological repeats with independent populations of plants. Individual biological repeats are represented with different shapes (n = 30 seedlings, 10 seedlings per biological repeat). Letters a and b denote groups that show statistically significant differences with other genotypes or treatments by 2-way ANOVA with Tukey's post hoc test (P < 0.05). WT, wild type.
Figure 5.
Figure 5.
Actin filament density increases after treatment of arp2-1 with the formin inhibitor SMIFH2. A) Representative images of epidermal cells from the apical region of 5-d-old etiolated hypocotyls are shown in the left column. Scale bar: 20 μm. ROIs (boxes) were magnified and displayed in the right column. Scale bar: 5 μm. Hypocotyls were treated with 0.05% DMSO solution or 25 µM SMIFH2 for 5 min prior to imaging with VAEM. Actin filament arrays in DMSO-treated arp2-1 and SMIFH2-treated wild-type cells appeared to be less dense and less bundled compared to DMSO-treated wild-type cells, but SMIFH2-treated arp2-1 cells have a significantly increased actin abundance. B to D) Quantitative analysis of the percentage of occupancy or density of actin filament arrays B), and the extent of filament bundling as measured by skewness C) and CV D) analyses. The density of actin arrays in DMSO-treated arp2-1 and SMIFH2-treated wild-type cells was significantly decreased compared to DMSO-treated wild type; however, SMIFH2-treated arp2-1 cells had significantly increased actin density compared to all other genotypes and treatments B). Actin arrays in arp2-1 or SMIFH2-treated cells were significantly less bundled compared to DMSO-treated wild-type cells C, D). It should be noted that experiments reported here were conducted at the same time as those testing CK-666; therefore, control data sets for DMSO-treated wild-type and DMSO-treated arp2-1 cells are the same in Figs. 4 and 5. In box-and-whisker plots, boxes show the interquartile range and the median, and whiskers show the maximum–minimum interval of 3 biological repeats with independent populations of plants. Individual biological repeats are represented with different shapes (n = 30 seedlings, 10 seedlings per biological repeat). Letters a to d denote groups that show statistically significant differences with other genotypes or treatments by 2-way ANOVA with Tukey's post hoc test (P < 0.05). WT, wild type.
Figure 6.
Figure 6.
Overall and de novo filament nucleation increases when Arp2/3 and formin activity are simultaneously inhibited. A, C to E) Quantitative analysis of actin filament nucleation frequency, both overall A) and by the subclass of origin C to E). The total nucleation frequency in DMSO-treated arp2-1 and SMIFH2-treated wild-type cells was significantly reduced compared to DMSO-treated wild-type cells. However, the total nucleation frequency of SMIFH2-treated arp2-1 cells was significantly higher than all other genotypes and treatments A) and this correlated with increased de novo nucleation events C). It should be noted that experiments reported here were conducted at the same time as those testing CK-666; therefore, control data sets for DMSO-treated wild-type and DMSO-treated arp2-1 cells are the same in Figs. 2 and 6. In box-and-whisker plots, boxes show the interquartile range and the median, and whiskers show the maximum–minimum interval of 2 biological repeats with independent populations of plants. Individual biological repeats are represented with different shapes (n = 20 seedlings, 10 seedlings per biological repeat). Letters a to c denote groups that show statistically significant differences with other genotypes or treatments (within the same filament nucleation subclass) by 2-way ANOVA with Tukey's post hoc test (P < 0.05). B) Analysis of the population distribution of actin filament elongation rates. The elongation rate distribution of DMSO-treated wild type had a single peak at 1.25 to 1.75 μm/s, the DMSO-treated arp2-1 had 3 peaks at 0.75 to 1.0, 2.0 to 2.5, and >3 µm/s, the SMIFH2-treated wild type had a peak at 1.0 to 1.75 μm/s, but SMIFH2-treated arp2-1 had peaks at 1.0 to 1.25 and 1.75 to 2.0 μm/s. It should be noted that experiments reported here were conducted at the same time as those testing CK-666; therefore, control data sets for DMSO-treated wild-type and DMSO-treated arp2-1 cells are the same in Figs. 3 and 6. n ≥ 100 single filaments from 2 individual biological repeats (for 1 biological repeat, 5 single filaments were counted in 1 hypocotyl from at least 10 hypocotyls per genotype or treatment). Letters a to d denote genotypes or treatments that show statistically significant differences with other groups by chi-squared test, P < 0.05. F to H) The average maximum length of filaments that originated de novo or from side-branching events in SMIFH2-treated arp2-1 was significantly shorter than that in other cells, but filaments that originated from preexisting ends did not show a difference between any genotype and treatment. I to K) The average maximum lifetime of side-branching filaments in DMSO-treated arp2-1, SMIFH2-treated arp2-1, and SMIFH2-treated wild-type cells were all significantly longer than the ones from DMSO-treated wild-type cells; however, filaments that originated de novo did not show any significant difference, and filaments that elongated from preexisting ends in DMSO-treated wild-type cells were slightly shorter than SMIFH2-treated cells. L to N) The severing frequency did not show any significant difference between different genotypes or treatments. It should be noted that experiments reported here were conducted at the same time as those testing CK-666; therefore, control data sets for DMSO-treated wild-type and DMSO-treated arp2-1 cells are the same in Figs. 3 and 6. In box-and-whisker plots, boxes show the interquartile range and the median, and whiskers show the maximum–minimum interval of 2 biological repeats with independent populations of plants. Individual biological repeats are represented with different shapes (n = 20 seedlings, 10 seedlings per biological repeat). Letters a to c denote groups that show statistically significant differences with other genotypes or treatments (within the same filament nucleation subclass) by 2-way ANOVA with Tukey's post hoc test (P < 0.05). WT, wild type.
Figure 7.
Figure 7.
Filament abundance, total nucleation events, and de novo filament formation increase when the Arp2/3 complex and formin activity are simultaneously reduced with chemical inhibitors. A) Representative images of epidermal cells from the apical region of 5-d-old etiolated hypocotyls are shown in the left columns. Scale bar: 20 μm. ROIs (boxes) were magnified and displayed in the right columns. Scale bar: 5 μm. Hypocotyls were treated with 0.05% DMSO solution, 10 µM CK-666, 25 µM SMIFH2, or both inhibitors for 5 min prior to imaging with VAEM. Actin filament arrays in CK-666-treated cells and SMIFH2-treated cells appeared to be less dense and less bundled compared to mock-treated cells. However, dual treatment markedly increased actin filament abundance. B to D) Quantitative analysis of actin filament density B) and extent of bundling by skewness C) and CV D) analyses. The density of actin arrays in CK-666-treated and SMIFH2-treated cells was decreased compared to mock-treated cells; however, dual-treated cells had significantly increased actin density compared to all other treatments. Actin arrays in CK-666- or dual-treated cells were significantly less bundled than in mock-treated cells. In box-and-whisker plots, boxes show the interquartile range and the median, and whiskers show the maximum–minimum interval of 3 biological repeats with independent populations of plants. Individual biological repeats are represented with different shapes (n = 30 seedlings, 10 seedlings per biological repeat). Letters a to c denote groups that show statistically significant differences with other genotypes or treatments by 2-way ANOVA with Tukey's post hoc test (P < 0.05). E to H) Quantitative analysis of actin filament nucleation frequency, both overall E) and by subclass of origin F to H). The total nucleation frequency in mock-treated cells was higher than CK-666-treated and SMIFH2-treated cells. However, the total nucleation frequency of dual-treated cells was significantly higher than all other treatments and this correlated with increased de novo nucleation events. In box-and-whisker plots, boxes show the interquartile range and the median, and whiskers show the maximum–minimum interval of 2 biological repeats with independent populations of plants. Individual biological repeats are represented with different shapes (n = 20 seedlings, 10 seedlings per biological repeat). Letters a to c denote groups that show statistically significant differences with other genotypes or treatments by 2-way ANOVA with Tukey's post hoc test (P < 0.05). DUO, dual-treated; WT, wild type.
Figure 8.
Figure 8.
SMIFH2 treatment results in further reduction of both actin density and actin filament nucleation frequency in the fh1-2 mutant. A) Representative images of epidermal cells from the apical region of 5-d-old etiolated hypocotyls are shown in the left columns. Scale bar: 20 μm. ROIs (boxes) were magnified and displayed in the right columns. Scale bar: 5 μm. Hypocotyls were treated with 0.05% DMSO solution, 10 µM CK-666, 25 µM SMIFH2, or both inhibitors for 5 min prior to imaging. Actin filament arrays in either DMSO-treated or single-inhibitor-treated fh1-2 cells all appeared to be less dense compared to DMSO-treated wild-type cells, but both dual-inhibitor-treated wild-type and fh1-2 cells appeared to have more dense actin arrays compared to DMSO-treated wild-type cells. B to D) Quantitative analysis of the percentage of occupancy or density of actin filament arrays B) and the extent of filament bundling as measured by skewness C) and coefficient of variance D) analyses. The density of actin arrays in DMSO-treated fh1-2 cells was significantly decreased but the extent of filament bundling was increased compared to DMSO-treated wild-type cells. Treatment with either CK-666 or SMIFH2 caused an additional decrease in actin density in fh1-2 cells and filaments were less bundled compared to DMSO-treated wild type. However, simultaneous treatment with both inhibitors significantly increased actin array density in both wild-type and fh1-2 cells. In box-and-whisker plots, boxes show the interquartile range and the median, and whiskers show the maximum–minimum interval of 2 biological repeats with independent populations of plants. Individual biological repeats are represented with different shapes (n = 20 seedlings, 10 seedlings per biological repeat). Letters a to d denote groups that show statistically significant differences with other genotypes or treatments by 2-way ANOVA with Tukey's post hoc test (P < 0.05). E to H) Quantitative analysis of actin filament nucleation frequency, both overall E) and by subclass of origin F to H). The total nucleation frequency in DMSO-treated fh1-2 cells was significantly reduced compared to DMSO-treated wild-type cells, and either CK-666 or SMIFH2 treatment caused an additional decrease in overall filament nucleation in fh1-2 cells E). However, the total nucleation frequency of dual-inhibitor-treated fh1-2 or wild-type cells was significantly higher than all other genotypes and treatments E) and this correlated with increased de novo nucleation events F). In box-and-whisker plots, boxes show the interquartile range and the median, and whiskers show the maximum–minimum interval of 2 biological repeats with independent populations of plants. Individual biological repeats are represented with different shapes (n = 20 seedlings, 10 seedlings per biological repeat). Letters a to d denote groups that show statistically significant differences with other genotypes or treatments by 2-way ANOVA with Tukey's post hoc test (P < 0.05). DUO, dual-treated; WT, wild type.
Figure 9.
Figure 9.
Increased filament abundance, total nucleation events, and de novo filament formation following simultaneous CK-666 and SMIFH2 treatment are further enhanced in the prf1-2 mutant. A) Representative images of epidermal cells from the apical region of 5-d-old etiolated hypocotyls are shown in the left columns. Scale bar: 20 μm. ROIs (boxes) were magnified and displayed in the right columns. Scale bar: 5 μm. Hypocotyls were treated with 0.05% DMSO solution, 10 µM CK-666, 25 µM SMIFH2, or both inhibitors for 5 min prior to imaging with VAEM. Actin filament arrays in either DMSO-treated or single-inhibitor-treated prf1-2 cells all appeared to be less dense and less bundled compared to DMSO-treated wild-type cells, but both dual-inhibitor-treated wild-type and prf1-2 cells appeared to have more dense actin arrays compared to DMSO-treated wild-type cells. B to D) Quantitative analysis of actin filament density B) and extent of bundling by skewness C) and CV D) analyses. The density of actin arrays in either DMSO-treated or single-inhibitor-treated prf1-2 cells was significantly decreased compared to DMSO-treated wild-type cells; however, the treatment with both inhibitors significantly increased the actin density in both wild-type and prf1-2 cells. Actin arrays were less bundled when either Arp2/3, formins, or PRF1 was inhibited compared to DMSO-wild-type cells. In box-and-whisker plots, boxes show the interquartile range and the median, and whiskers show the maximum–minimum interval of 3 biological repeats with independent populations of plants. Individual biological repeats are represented with different shapes (n = 30 seedlings, 10 seedlings per biological repeat). Letters a to f denote groups that show statistically significant differences with other genotypes or treatments by 2-way ANOVA with Tukey's post hoc test (P < 0.05). E to H) Quantitative analysis of actin filament nucleation frequency, both overall E) and by subclass of origin F to H). The total nucleation frequency in DMSO-treated, CK-666-treated, and SMIFH2-treated prf1-2 cells was significantly reduced compared to DMSO-treated wild-type cells. However, the total nucleation frequency of dual-inhibitor-treated prf1-2E) was significantly higher than all other genotypes and treatments and this corresponded to a significant increase in de novo nucleation events F). In box-and-whisker plots, boxes show the interquartile range and the median, and whiskers show the maximum–minimum interval of 2 biological repeats with independent populations of plants. Individual biological repeats are represented with different shapes (n = 20 seedlings, 10 seedlings per biological repeat). Letters a to e denote groups that show statistically significant differences with other genotypes or treatments by 2-way ANOVA with Tukey's post hoc test (P < 0.05). DUO, dual-treated; WT, wild type.

References

    1. Akin O, Mullins RD. Capping protein increases the rate of actin-based motility by promoting filament nucleation by the Arp2/3 complex. Cell. 2008:133(5):841–851. 10.1016/j.cell.2008.04.011 - DOI - PMC - PubMed
    1. Ali MF, Fatema U, Peng X, Hacker SW, Maruyama D, Sun M-X, Kawashima T. ARP2/3-independent WAVE/SCAR pathway and class XI myosin control sperm nuclear migration in flowering plants. Proc Natl Acad Sci U S A. 2020:117(51):32757–32763. 10.1073/pnas.2015550117 - DOI - PMC - PubMed
    1. Amann KJ, Pollard TD. Direct real-time observation of actin filament branching mediated by Arp2/3 complex using total internal reflection fluorescence microscopy. Proc Natl Acad Sci U S A. 2001:98(26):15009–15013. 10.1073/pnas.211556398 - DOI - PMC - PubMed
    1. Antkowiak A, Guillotin A, Boiero Sanders M, Colombo J, Vincentelli R, Michelot A. Sizes of actin networks sharing a common environment are determined by the relative rates of assembly. PLoS Biol. 2019:17(6):e3000317. 10.1371/journal.pbio.3000317 - DOI - PMC - PubMed
    1. Arieti RS, Staiger CJ. Auxin-induced actin cytoskeleton rearrangements require AUX1. New Phytol. 2020:226(2):441–459. 10.1111/nph.16382 - DOI - PMC - PubMed

MeSH terms