. 2023 Dec 6;14(1):8081.
doi: 10.1038/s41467-023-43881-0.

Mosaic chromosomal alterations in peripheral blood leukocytes of children in sub-Saharan Africa

Affiliations

Mosaic chromosomal alterations in peripheral blood leukocytes of children in sub-Saharan Africa

Weiyin Zhou et al. Nat Commun. .

Abstract

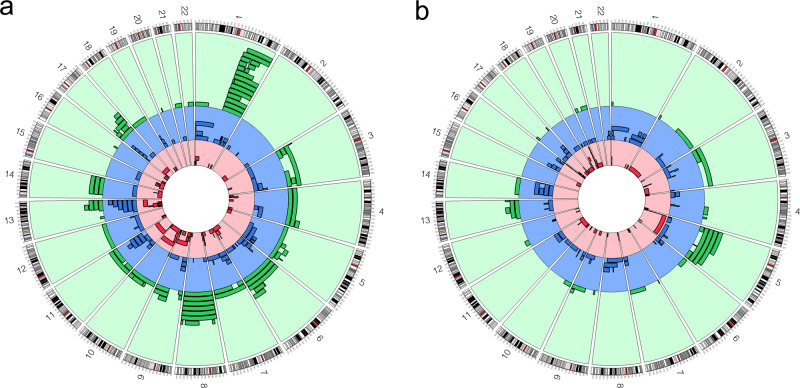
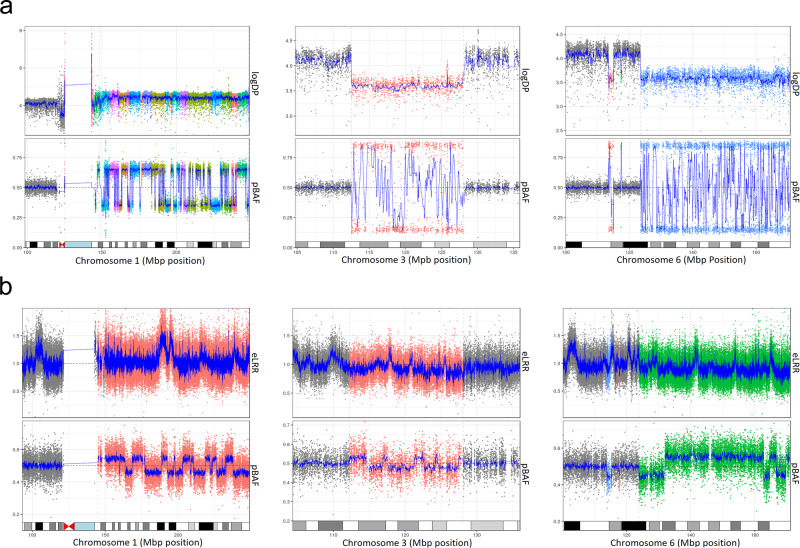
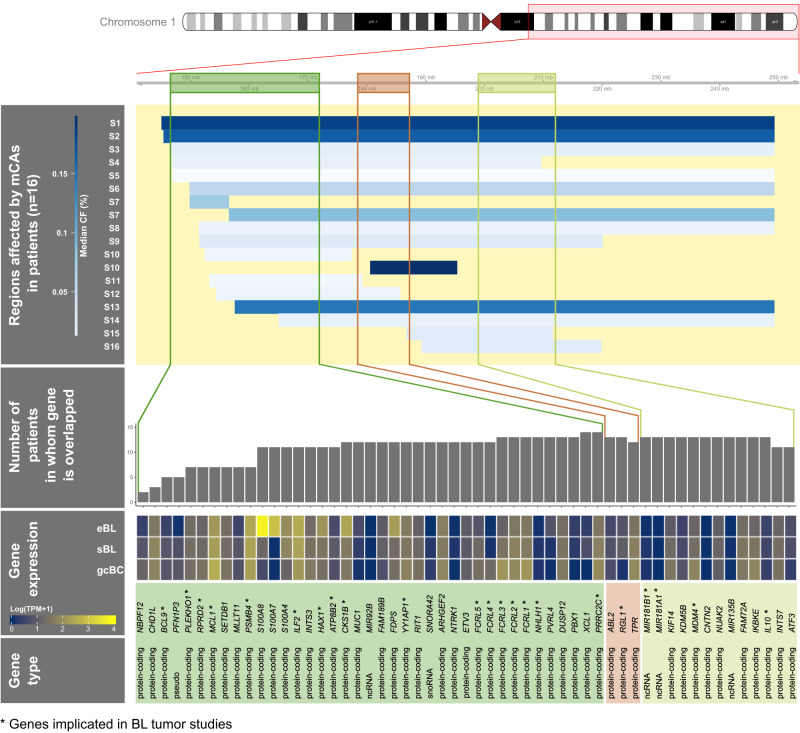
In high-income countries, mosaic chromosomal alterations in peripheral blood leukocytes are associated with an elevated risk of adverse health outcomes, including hematologic malignancies. We investigate mosaic chromosomal alterations in sub-Saharan Africa among 931 children with Burkitt lymphoma, an aggressive lymphoma commonly characterized by immunoglobulin-MYC chromosomal rearrangements, 3822 Burkitt lymphoma-free children, and 674 cancer-free men from Ghana. We find autosomal and X chromosome mosaic chromosomal alterations in 3.4% and 1.7% of Burkitt lymphoma-free children, and 8.4% and 3.7% of children with Burkitt lymphoma (P-values = 5.7×10⁻¹¹ and 3.74×10⁻², respectively). Autosomal mosaic chromosomal alterations are detected in 14.0% of Ghanaian men and increase with age. Mosaic chromosomal alterations in Burkitt lymphoma cases include gains on chromosomes 1q and 8, the latter spanning MYC, while mosaic chromosomal alterations in Burkitt lymphoma-free children include copy-neutral loss of heterozygosity on chromosomes 10, 14, and 16. Our results highlight mosaic chromosomal alterations in sub-Saharan African populations as a promising area of research.


Conflict of interest statement

The authors declare no competing interests.

Figures

Fig. 1
Fig. 1. Study participant regions and sample characteristics.
a Map showing study countries and enrollment sites. The map was drawn using ESRI ArcGIS Pro software. No portions of this figure were imported as image components from a database; b Flow diagram of subjects and samples analyzed; c population substructure in the study population based on analysis of principal components (PC) using 787,731 genotyped uncorrelated (r2 < 0.3) SNPs outside the HLA region (triangles represent BL cases, solid circles represent controls; ‘Source data are provided as a Source Data file’).
Fig. 2
Fig. 2. Circos plots of detected mosaic chromosomal alterations (mCAs) and their genomic location (GRCh37).
The outer rings are for the autosomes moving clockwise from chromosome 1 to 22. The mCAs were detected in blood cells of subjects from Kenya, Tanzania, and Uganda in the EMBLEM study. The green region is mosaic duplication events; blue region is mosaic CNLOH events; red region is mosaic copy-loss events. a mCAs detected in 701 BL cases. b mCAs detected in 3645 BL-free controls; ‘Source data are provided as a Source Data file’.
Fig. 3
Fig. 3. mCAs detected in paired tumor and peripheral blood leukocytes from one of the two informative BL cases.
The figure shows three mCAs > = 2MB in size (chromosome 1q duplication, chromosome 3q deletion, and 6q deletion) detected at cell fraction (CF) ≥ 0.09 in peripheral blood leukocytes and at CF > 0.8 in tumor WGS data from the same BL patient. The mCAs were the same event types detected in similar but not identical genomic regions. a The 3 detected mCAs in WGS tumor data. b The 3 detected mCAs in SNP array data from peripheral blood leukocytes. Upper panels in the figures: Log depth of read coverage of WGS data or exponentiated Log R ratio (eLRR) of SNP data, respectively; Bottom panels in the figures: phase B allele frequency (pBAF) in WGS data or SNP array data, respectively. Gray color indicates regions with a normal state, all other colors (orange, blue, green) indicate regions with mCAs. ‘Source data are provided as a Source Data file’.
Fig. 4
Fig. 4. Genomic location of mCAs gains detected on chromosome 1q in 16 BL cases.
Horizontal bar plots show regions affected by mCAs for each BL patient. Bar colors indicate median cell fraction (CF) values using a heatmap color code indicator in the bar legend. Colored boxes indicate the location of genomic regions with oncogenes from the Oncogene database and significantly mutated genes (SMGs) in BL curated from literature;, the oncogenes or SMGs in BL (marked with an asterisk) are listed below. For each gene, vertical bar plots show the number of BL cases with mCAs overlapping the oncogene or SMG. A heatmap is included to show expression of the gene or SMG in endemic Burkitt lymphoma (eBL), sporadic Burkitt lymphoma (sBL) and germinal center B cell populations (gcBC) for relative comparisons (see online methods for details; ‘Source data are provided as a Source Data file’).

References

    1. Jacobs KB, et al. Detectable clonal mosaicism and its relationship to aging and cancer. Nat. Genet. 2012;44:651–658. doi: 10.1038/ng.2270. - DOI - PMC - PubMed
    1. King DA, et al. Mosaic structural variation in children with developmental disorders. Hum. Mol. Genet. 2015;24:2733–2745. doi: 10.1093/hmg/ddv033. - DOI - PMC - PubMed
    1. Loh P-R, et al. Insights into clonal haematopoiesis from 8,342 mosaic chromosomal alterations. Nature. 2018;559:350–355. doi: 10.1038/s41586-018-0321-x. - DOI - PMC - PubMed
    1. Burkitt DP. Etiology of Burkitt’s lymphoma-an alternative hypothesis to a vectored virus. J. Natl Cancer Inst. 1969;42:19–28. - PubMed
    1. Epstein MA, Achong BG, Barr YM. Virus particles in cultured lymphoblasts from Burkitt’s lymphoma. Lancet. 1964;1:702–703. doi: 10.1016/S0140-6736(64)91524-7. - DOI - PubMed

Publication types

Substances