. 2023 Dec 6;14(1):8069.
doi: 10.1038/s41467-023-43848-1.

Systemically administered wound-homing peptide accelerates wound healing by modulating syndecan-4 function

Affiliations

Systemically administered wound-homing peptide accelerates wound healing by modulating syndecan-4 function

Horacio Maldonado et al. Nat Commun. .

Erratum in

Abstract

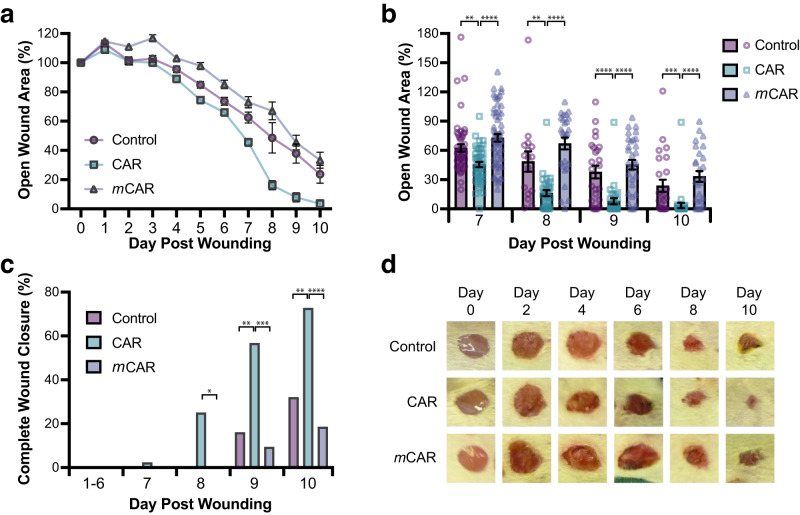
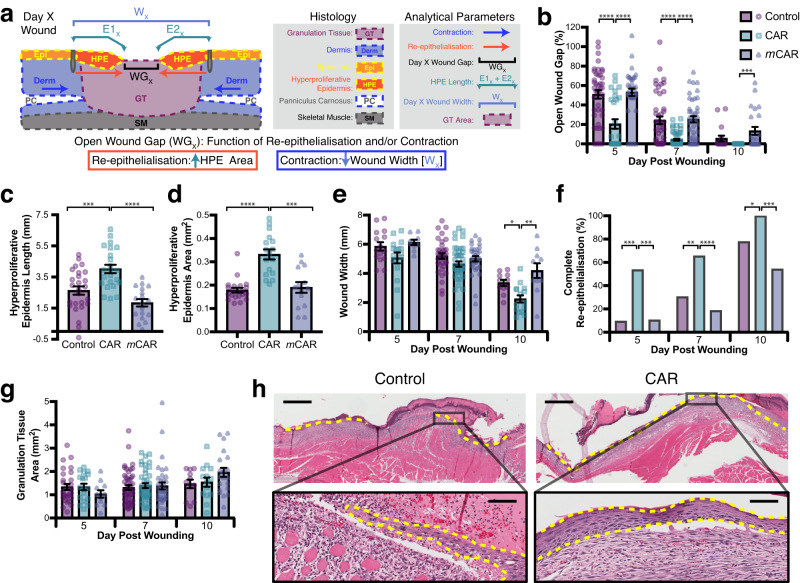
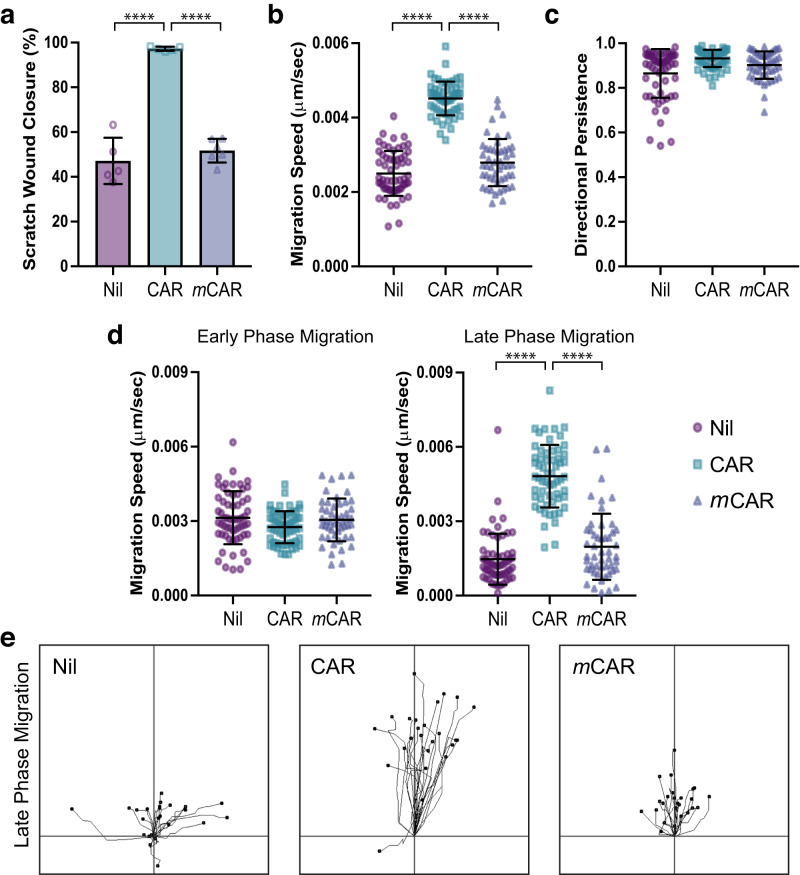
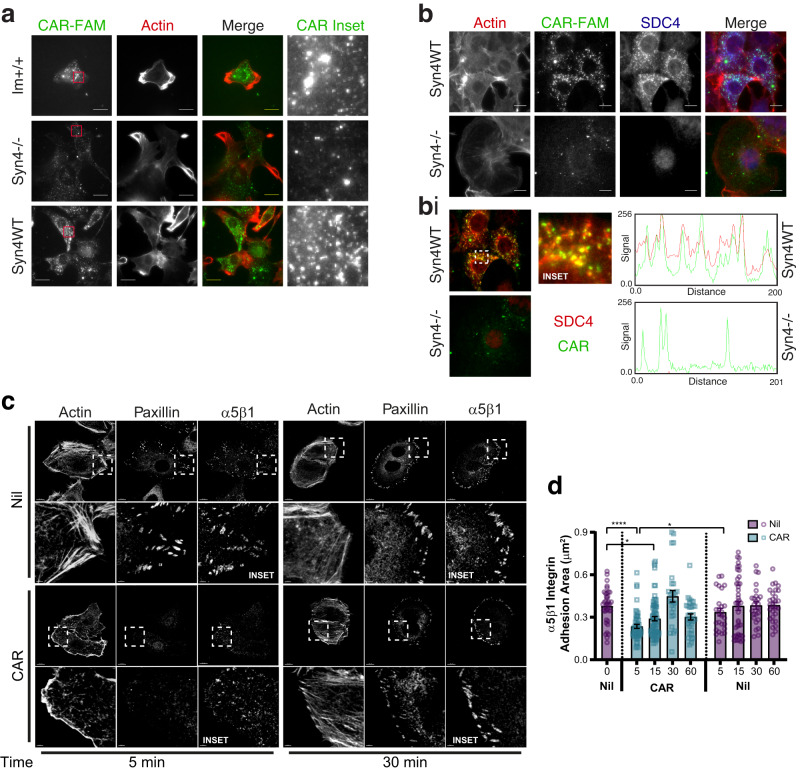
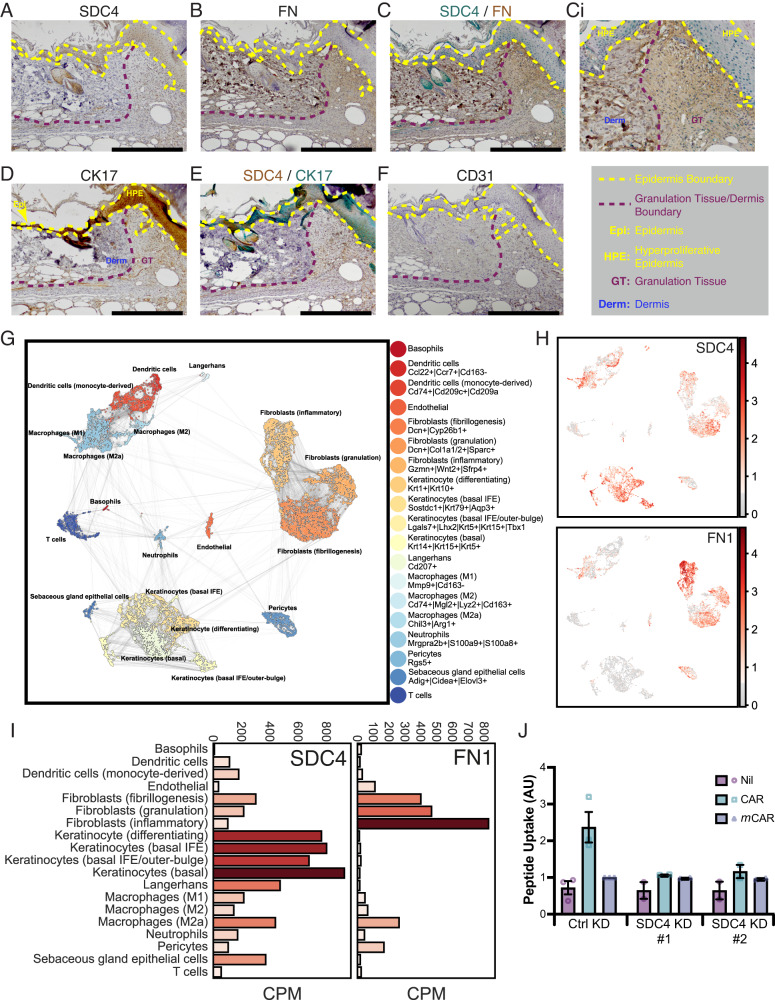
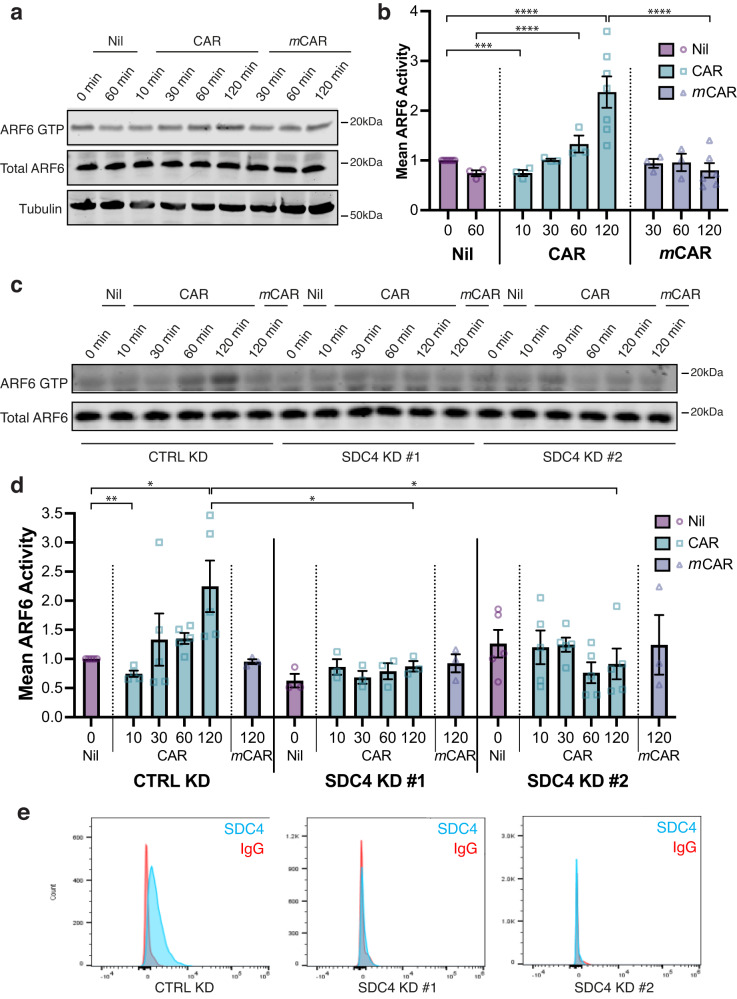
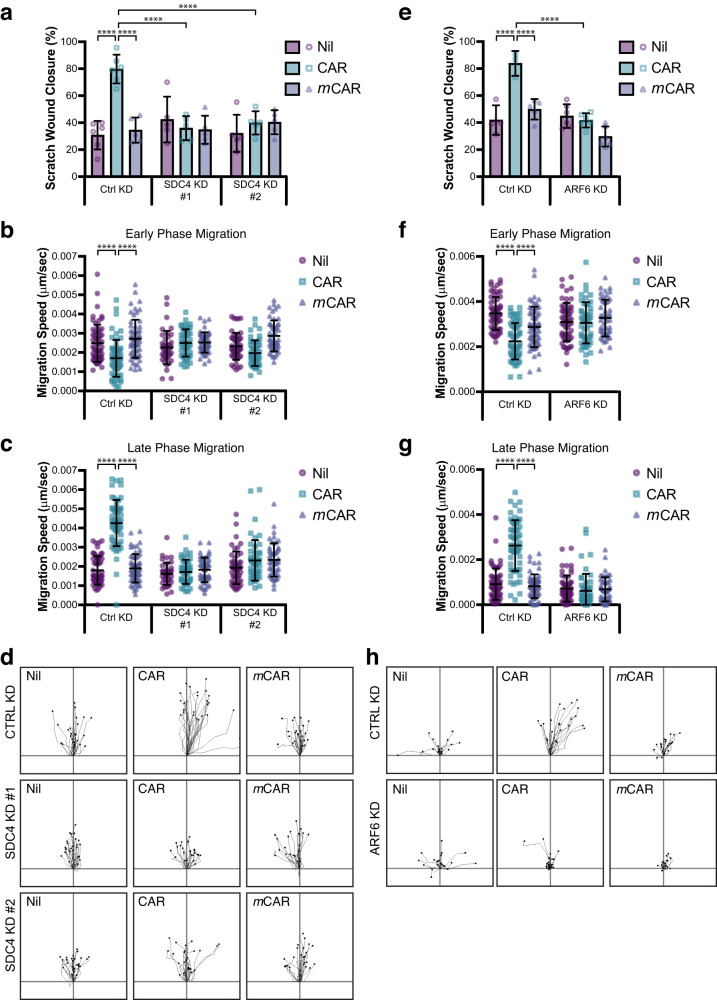
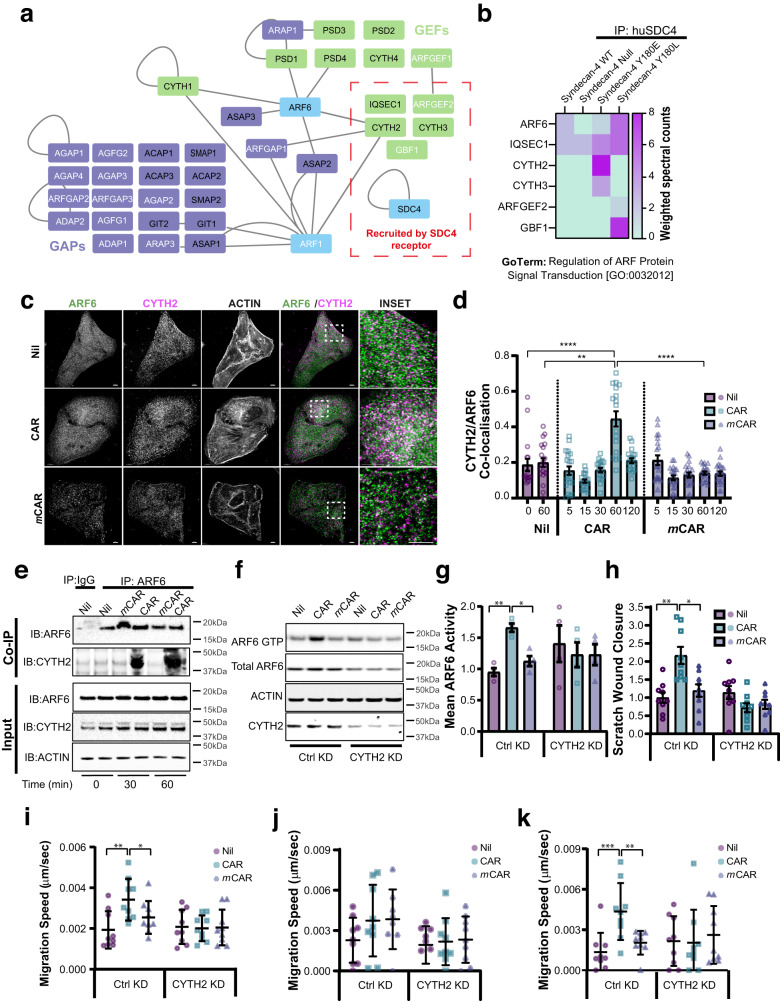
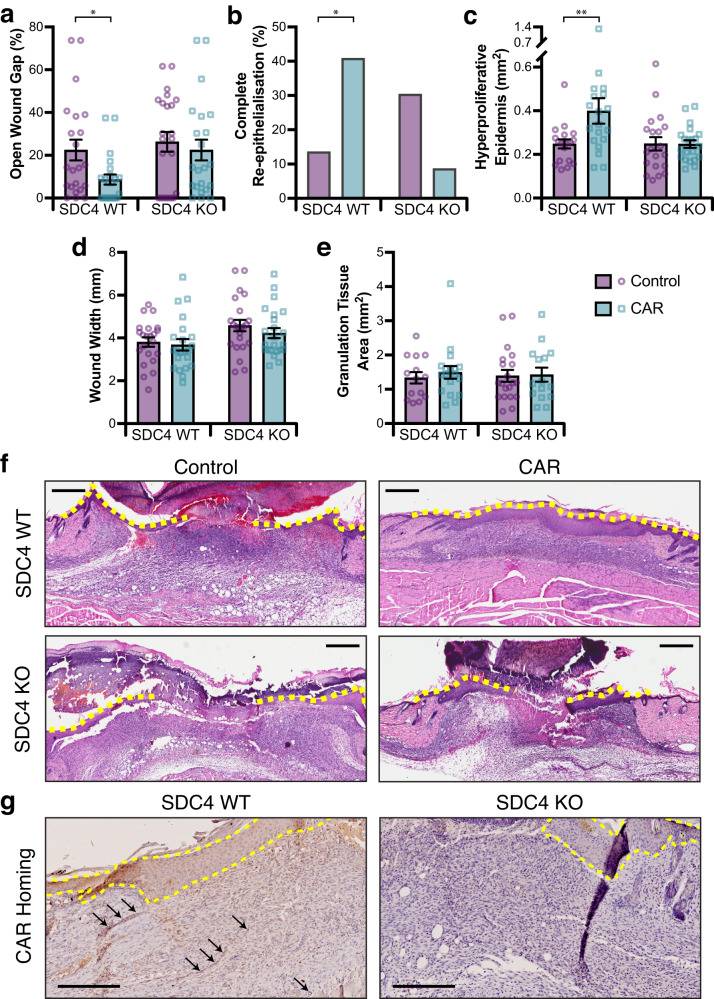
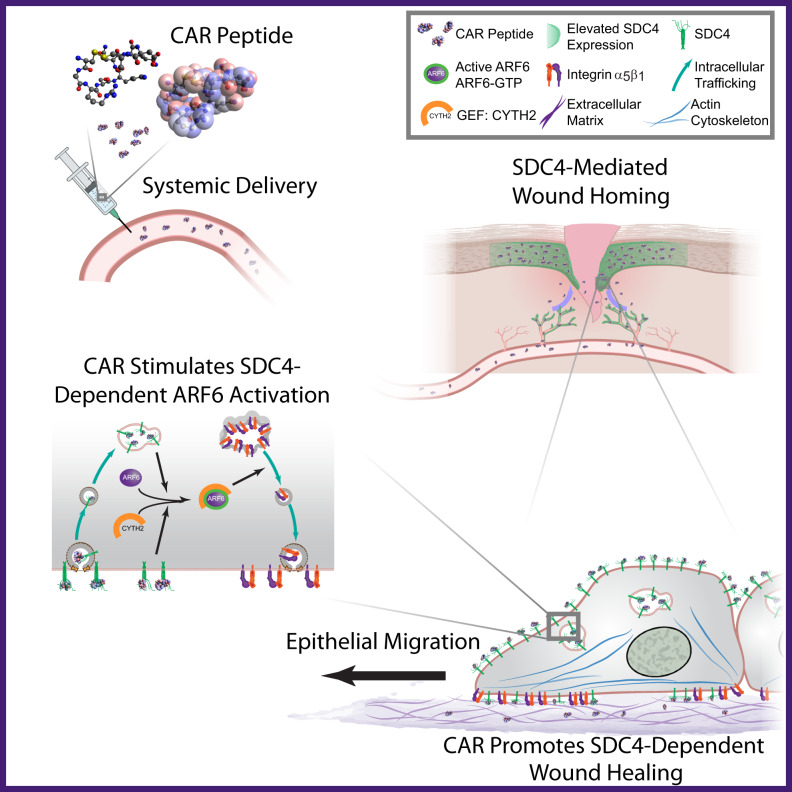
CAR (CARSKNKDC) is a wound-homing peptide that recognises angiogenic neovessels. Here we discover that systemically administered CAR peptide has inherent ability to promote wound healing: wounds close and re-epithelialise faster in CAR-treated male mice. CAR promotes keratinocyte migration in vitro. The heparan sulfate proteoglycan syndecan-4 regulates cell migration and is crucial for wound healing. We report that syndecan-4 expression is restricted to epidermis and blood vessels in mice skin wounds. Syndecan-4 regulates binding and internalisation of CAR peptide and CAR-mediated cytoskeletal remodelling. CAR induces syndecan-4-dependent activation of the small GTPase ARF6, via the guanine nucleotide exchange factor cytohesin-2, and promotes syndecan-4-, ARF6- and Cytohesin-2-mediated keratinocyte migration. Finally, we show that genetic ablation of syndecan-4 in male mice eliminates CAR-induced wound re-epithelialisation following systemic administration. We propose that CAR peptide activates syndecan-4 functions to selectively promote re-epithelialisation. Thus, CAR peptide provides a therapeutic approach to enhance wound healing in mice; systemic, yet target organ- and cell-specific.


Conflict of interest statement

E.R. has ownership interest (including patents) in Vascular Biosciences Inc., biotech company developing the CAR peptide for clinical applications. No conflicts of interest were disclosed by the other authors.

Figures

Fig. 1
Fig. 1. CAR peptide accelerates wound closure.
Mice with full thickness skin excision wounds were treated i.v. twice a day with CAR, mCAR or control (BSA/PBS) injections from day one post-wounding until the sacrifice as described in methods. Wounds were examined and photographed daily. Wound closure was recorded and expressed (a, b) as the percentage of the open wound size relative to its original size on the day of wounding (Day 7: CAR vs. Control P = 0.0041, CAR vs. mCAR P = 2.0 × 10−06; Day 8: CAR vs. Control P = 0.009, CAR vs. mCAR P = 9.5 × 10−08; Day 9: CAR vs. Control P = 0.00027, CAR vs. mCAR P = 1.3 × 10−06; Day 10: CAR vs. Control P = 0.001, CAR vs. mCAR P = 1.6 × 10−06) or (c) as the percentage of the number of completely closed wounds (Day 8: CAR vs. Control P = 0.078 (not significant), CAR vs. mCAR P = 0.017; Day 9: CAR vs. Control P = 0.0049, CAR vs. mCAR P = 0.0003; Day 10: CAR vs. Control P = 0.0064, CAR vs. mCAR P = 0.0001). d Representative macroscopic digital pictures of the wounds treated with CAR, mCAR and control peptide injections are shown at different time-points of the wound closure process. There were 24 animals, each with four wounds, in every treatment group. Source data are provided as a Source Data file. Values are mean ± S.E.M. Each data point represents an individual wound. n = 96 (Days 0–5), 60 (Days 6–7) and 32 (Days 8–10) wounds in each treatment group. *P ≤ 0.05; **P ≤ 0.01; ***P ≤ 0.001; ****P ≤ 0.0001. Krustal-Wallis rank sum test with Dunn´s test with tie correction (a, b) and Pearson´s Chi-square test (without continuity correction) with post-hoc test Fisher exact test (two-sided) (c).
Fig. 2
Fig. 2. CAR peptide stimulates wound re-epithelialisation.
Mice with full thickness skin excision wounds were treated with systemically administered CAR, mCAR and control (BSA/PBS) peptide as described in methods. Wounds were harvested on days 5, 7 and 10. a Schematic representation of histological analysis. Open wound gap: WGX - Gap between epithelial tongues on day X post-wounding. Re-epithelialisation: E1X + E2X - Hyperproliferative epidermis (HPE) length. Contraction: Wound width reduction WX. b Gap between the epidermal tongues (WGX: area of open wound without re-epithelialisation) represented as percentage (%) of the original wound size (Day 5: CAR vs. Control P = 6.3 × 10−05, CAR vs. mCAR P = 6.3 × 10−07; Day 7: CAR vs. Control P = 1.3 × 10−05, CAR vs. mCAR P = 1.3 × 10−07; Day 10: CAR vs. mCAR P = 0.00025). c Length of hyperproliferative epidermal tongues at day 5 (Day 5: CAR vs. Control P = 0.005, CAR vs. mCAR P = 1.1 × 10−05). d Area of hyperproliferative epidermal tongues at day 5 (CAR vs. Control P = 3.8 × 10−06, CAR vs. mCAR P = 0.00029). e Overall wound width (Wx), indicating wound contraction (Day 10: CAR vs. Control P = 0.028, CAR vs. mCAR P = 0.0023). f Percentage of completely re-epithelialised wounds (Day 5: CAR vs. Control P = 0.0002, CAR vs. mCAR P = 0.0005; Day 7: CAR vs. Control P = 0.0013, CAR vs. mCAR P = 1.0−07; Day 10: CAR vs. Control P = 0.041; CAR vs. mCAR P = 0.0002). g Cross-sectional area of granulation tissue quantified by examining two histological HE-stained sections from each wound. h Representative histological HE-stained pictures of the wounds treated with CAR peptide and control collected on day 7 illustrate wound re-epithelialisation. The epidermal tongues are marked with yellow dashed lines. Scale bars: 300 µm low magnification image, 30 µm high magnification inset. ah Eight animals, each with four wounds, in every treatment group (N = 28, 44, 24 for days 5, 7 and 10). Source data are provided as a Source Data file. Each data point represents an individual wound. Values are mean ± S.E.M. Kruskal-Wallis rank sum test with Dunn´s test with tie correction (b, c, d, e and g) and Pearson´s Chi-square test (without continuity correction) with post-hoc test Fisher exact test (two-sided) (f).
Fig. 3
Fig. 3. CAR peptide stimulates keratinocyte migration.
Migration of HaCaT keratinocytes on fibronectin in scratch wound assays, in the presence or absence of 10 µg/ml CAR or mCAR peptide. Cells were analysed over 20 h by time-lapse microscopy. a Scratch wound closure, b mean migration speed throughout timelapse, c directional persistence throughout timelapse, d speed at early and late phases of migration (Early: Timepoint 0–5 h; Late: Timepoint 15–20 h), and e representative migration tracks during late phase migration. Data are representative from one of three independent experiments. Values are means ± S.D. All statistical analyses are two-way ANOVA with Tukey’s multiple comparisons test. a n = 5–6 fields of view per condition (Nil n = 5, CAR n = 5, mCAR n = 6); Nil vs CAR P = 6.133 × 10−8; CAR vs mCAR P = 1.147 × 10−7. bd n = 50–60 cells per condition (Nil n = 60, CAR n = 59, mCAR n = 50). b Nil vs CAR P = 1.5 × 10−14; CAR vs mCAR P = 1.5 × 10−14d Early phase: Nil vs CAR P = 0.0499; CAR vs mCAR P = 0.1932. Late phase: Nil vs CAR P = 1.5 × 10−14; CAR vs mCAR P = 1.7 × 10−14. a Each data point represents a single field of view; bd Each data point represents an individual cell. Source data are provided as a Source Data file. See also Supplementary Movies S1 & S2.
Fig. 4
Fig. 4. CAR peptide is internalised by SDC4 and modulates α5β1 integrin adhesion complex dynamics.
a Subcellular distribution of fluorescently-labelled CAR in immortalised wild-type MEFs (Im+), syndecan-4-/- MEFs (Syn4-/-) and syndecan-4 re-expressing MEFs (Syn4WT) following 8 h treatment. CAR-FAM (Green) and actin (phalloidin-AlexaFluor-594; Red). Maximum projections of 2.1 μm z-sections are displayed. Scale bar = 20 μm. N = 2 independent replicate experiments. b Immunofluorescence demonstrating that internalised CAR co-localises with SDC4. CAR-FAM internalisation in Syn4WT and Syn4-/- MEFs. Cells were treated with CAR peptide for 8 h prior to fixation and stained for SDC4 and actin. CAR (Green), SDC4 (Blue) and actin (phalloidin-AlexaFluor-594; Red). Sum projections of 2.1 μm z-sections are displayed. Scale bar = 10 μm. N = 2 independent replicate experiments. bi Co-localisation of SDC4 and CAR in intracellular vesicles. Images correspond to Fig. 5b; sum projections of 0.6 μm z-section, positioned 0.6–1.2 μm above cell-matrix interface (central region of cells) pseudo-coloured to highlight co-localisation CAR-FAM (Green), SDC4 (Red). Dashed box highlights inset region. RGB profiles: fluorescence intensity of CAR and SDC4 along 25.8 μm segmented line intersecting CAR-FAM positive vesicles. c, d Quantitative analysis of α5β1 integrin and paxillin-positive adhesion complexes in fibronectin-bound keratinocytes following CAR peptide stimulation (N = 3 independent replicate experiments). c Subcellular distribution of α5β1 integrin, paxillin and actin in HaCaT cells on fibronectin following 5- or 30-min treatment with 10 µg/ml CAR or vehicle control. Dashed boxes indicate inset regions (depicted in lower image). Scale bars: 10 μm (main images); 2 μm (inset images). d Area of α5β1-positive integrin adhesions (μm2/cell) ± S.E.M. following 0-, 5-, 15-, 30- and 60-min treatment with 10 µg/ml CAR or vehicle control. Data points represent mean α5β1 integrin-positive adhesion area per cell. N = 3 with 26–75 images analysed per condition (Control: 0 min n = 38, 5 min n = 26, 15 min n = 43, 30 min n = 25, 60 min n = 28; CAR: 5 min n = 53, 15 min n = 75, 30 min n = 27, 60 min n = 31). Kruskal-Wallis test, followed by Dunn’s multiple comparisons test: Nil 0’ vs CAR 5’ P = 7.555 × 10−6; Nil 0’ vs CAR 15’ P = 0.0113; CAR 5’ vs Nil 5’ P = 0.0447. Source data are provided as a Source Data file.
Fig. 5
Fig. 5. SDC4 is highly expressed in wound keratinocytes and required for CAR peptide uptake.
IHC analysis of full thickness skin excision wounds. Samples were harvested from untreated mice 7 days post wounding and representative micrographs are presented of skin wound sections stained for (a) SDC4, (b) fibronectin (FN), (c) and (ci) SDC4 (Green) and fibronectin (Brown), (d) cytokeratin-17 (CK17), (e) SDC4 (Brown) and cytokeratin-17 (CK17) (green), (f) blood vessels (CD31). ci High magnification image of a region within the same field of view as (c). Epidermis is highlighted with yellow dashed lines. Boundary between granulation tissue and dermis is marked by red dashed lines. HPE: Hyperproliferative epidermis; Epi: Epidermis; GT: Granulation tissue; Derm: Dermis. SDC4 signal intensity is not directly comparable between (a) and (e). af n = 12 individual wounds; three animals with four wounds. Scale bar: 500 µm. gi Single-cell RNA-Seq analysis of SDC4 and fibronectin expression in skin wounds. Single-cell transcriptomics analysis of gene expression in different cells in skin wounds. scRNA-Seq data from 16,351 cells was analysed using the SCANPY Python library and clusters identified using Louvain clustering at resolution 0.75. g Clusters were visualised with the UMAP model and cell types determined by literature review of highly upregulated genes in each Louvain cluster. h Syndecan-4 (SDC4) and Fibronectin (FN1) expression mapped onto all cells. i Barplots presenting average counts per million (CPM) across each identified cell type are given for both genes. j Uptake of fluorescent-labelled peptides by HaCaT cells transfected with control siRNA (CTRL KD), human SDC4-targeting siRNA oligo #1 (SDC4 KD #1) or human SDC4-targeting siRNA oligo #2 (SDC4 KD #2), treated with CAR-FAM, mCAR-FAM or vehicle control (Nil) for 4 h. Data are from 2 to 3 independent replicate experiments (CTRL KD: N = 3; SDC4 KD #1 & #2: N = 2) and normalised relative to the mCAR-FAM signal in CTRL KD cells. Each data point represents mean uptake in each independent experiment ± S.D. Source data are provided as a Source Data file.
Fig. 6
Fig. 6. SDC4 regulates CAR peptide-mediated ARF6 activity.
a, b ARF6 activity (ARF6 GTP) assessed by effector pull-down in HaCaT keratinocytes in the presence or absence of 10 µg/ml CAR or mCAR peptide. a Representative blots of ARF6 activity during time-course. ARF6 GTP: ARF6 detection in GST-GGA3 pull-down eluate. Total ARF6: ARF6 expression in total cell lysate. Tubulin: total cell lysate loading control. b Mean ARF6 activity, relative to total ARF6 ± S.E.M. normalised to 0 min Nil treatment. N = 3–7 independent biological replicate experiments (Nil: 0 min N = 7, 60 min N = 3; CAR: 10–60 min N = 3, 120 min N = 7; mCAR: 30–60 min N = 3, 120 min N = 6). Datapoints represent ARF6 activity per experiment. Two-way ANOVA with Tukey’s multiple comparisons test: Nil 0’ vs CAR 120’ P = 6.457 × 10−5; CAR 120’ vs mCAR 120’ P = 6.732 × 10−6; Nil 60’ vs CAR 60’ P = 4.865 × 10−5; CAR 60’ vs mCAR 60’ P = 0.0063. Holm-Sidak t test: Nil 0’ vs CAR 10’ P = 0.0004. ce ARF6 activity in HaCaT cells transfected with control siRNA (CTRL KD), human SDC4-targeting siRNA oligo #1 (SDC4 KD #1) or human SDC4-targeting siRNA oligo #2 (SDC4 KD #2), in the presence or absence of 10 µg/ml CAR or mCAR peptide. c Representative blots of ARF6 activity during time-course. ARF6 GTP: ARF6 detection in GST-GGA3 pull-down eluate; total ARF6: ARF6 expression in total cell lysate. d Mean ARF6 activity, relative to total ARF6 ± S.E.M. normalised to Nil treatment. N = 3–5 independent replicate experiments (Ctrl KD: Nil 0 min N = 5; CAR 10 min N = 4, 30–120 min N = 5; mCAR 120 min N = 3. SDC4 KD #1: Nil 0 min N = 3; CAR 10–120 min N = 3; mCAR 120 min N = 3. SDC4 KD #5: Nil 0 min N = 5; CAR 10–120 min N = 5; mCAR 120 min N = 3). Datapoints represent ARF6 activity per experiment. Two-way ANOVA with Tukey’s multiple comparisons test: CTRL KD Nil 0’ vs CAR 120’ P = 0.0299; CTRL KD CAR 120’ vs SDC4 KD #1 CAR 120’ P = 0.0499; CTRL KD CAR 120’ vs SDC4 KD #2 CAR 120’ P = 0.0132. Holm-Sidak t test: CTRL KD Nil 0’ vs CTRL KD CAR 10’ P = 0.0012. Source data are provided in Source Data file. e Flow cytometric analysis of cell surface SDC4 in HaCaTs following SDC4 knockdown.
Fig. 7
Fig. 7. CAR promotes SDC4- and ARF6-dependent keratinocyte migration.
Migration of HaCaT keratinocytes on fibronectin in scratch wound assays, in the presence or absence of 10 µg/ml CAR or mCAR peptide. Cells were analysed over 17 h (ad) or 20 h (eh) by time-lapse microscopy. ad HaCaT cells transfected with control siRNA (CTRL KD), human SDC4-targeting siRNA oligo #1 (SDC4 KD #1) or human SDC4-targeting siRNA oligo #2 (SDC4 KD #2). a Scratch wound closure, (b) speed at early phase of migration (Timepoint 0–5 h), (c) speed at late phase of migration (Late: Timepoint 12–17 h), and (d) representative migration tracks during late phase migration. See also Supplementary Movie S3 and S4 and Supplementary Fig. S7a, b. Data are representative from one of four independent experiments. Values are means ± S.E.M. All statistical analyses are two-way ANOVA with Tukey’s multiple comparisons test. a n = 5–6 fields of view per condition (Ctrl KD: Nil & CAR n = 6; mCAR n = 5. SDC4 KD #1 & #2: Nil, CAR & mCAR n = 5); CTRL KD Nil vs CAR P = 1.383 × 10−7; CTRL KD CAR vs mCAR P = 2.239 × 10−6; CTRL KD CAR vs SDC4 KD #1 CAR P = 4.341 × 10−6; CTRL KD CAR vs SDC4 KD #2 CAR P = 2.630 × 10−5. b, c n = 40–60 cells per condition. b Early phase: CTRL KD Nil vs CAR P = 9.808 × 10−6; CTRL KD CAR vs mCAR P = 1.639 × 10−9. (c) Late phase: CTRL KD Nil vs CAR P = 2.520 × 10−11; CTRL KD CAR vs mCAR P = 2.520 × 10−11. eh HaCaT cells transfected with control siRNA (CTRL KD) or human ARF6-targeting siRNA. e Scratch wound closure, (f) speed at early phase of migration (Timepoint 0–5 h), (g) speed at late phase of migration (Late: Timepoint 15–20 h), and (e) representative migration tracks during late phase migration. See also Supplementary Movie S5 and S6 and Supplementary Fig. S7c, d. Data are representative from one of four independent experiments. Values are means ± S.D. All statistical analyses are two-way ANOVA with Tukey’s multiple comparisons test. e n = 4–6 fields of view per condition (Ctrl KD: Nil n = 4, CAR n = 3; mCAR n = 5. ARF6 KD: Nil, CAR & mCAR n = 6); CTRL KD Nil vs CAR P = 6.312 × 10−6; CTRL KD CAR vs mCAR P = 7.806 × 10−5; CTRL KD CAR vs ARF6 KD CAR P = 1.636 × 10−6. f, g n = 49–60 cells per condition (Ctrl KD: Nil & CAR n = 60, mCAR n = 59. ARF6 KD: Nil n = 58, CAR & mCAR n = 49). f Early phase: CTRL KD Nil vs CAR P = 6.82 × 10−13; CTRL KD CAR vs mCAR P = 0.0006; CTRL KD CAR vs ARF6 KD CAR P = 8.897 × 10−6 (g) Late phase: CTRL KD Nil vs CAR P = 4.68 × 10−13; CTRL KD CAR vs mCAR P = 4.68 × 10−13; CTRL KD CAR vs ARF6 KD CAR P = 4.68 × 10−13 (a, e) Each data point represents a single field of view; (b, c, e, f) Each data point represents an individual cell. Source data are provided as a Source Data file.
Fig. 8
Fig. 8. CYTH2 regulates CAR peptide-mediated ARF6 activity.
a, b Proteomic analysis of ARF regulatory molecules co-immunoprecipitating with human SDC4 (huSDC4) from Syn4WT, Syn4-/-, Syn4Y180E and Syn4Y180L MEFs. a Protein-protein interaction network of molecules in the GO Term “Regulation of ARF Protein Signal Transduction” [GO:0032012]. GEFs: green nodes; GAPs: purple nodes; Blue nodes: proteins not in GO:0032012 (ARF6, ARF1 GTPases and SDC4 bait protein); Edges (grey lines): known protein-protein interactions; Black labels: proteins with reported ARF6 activity modulation properties; white labels: proteins not reported to modulate ARF6 activity. Red dashed box: proteins co-immunoprecipitating with huSDC4. b Heatmap displaying proteins within GO:0032012 co-immunoprecipitating with huSDC4. Colour-coding indicates enrichment levels (weighted spectral counts). c, d Quantitative analysis of CYTH2/ARF6 co-localisation following CAR peptide stimulation. c Subcellular distribution of CYTH2 (magenta) and ARF6 (green) following 60-min treatment 10 µg/ml CAR, mCAR or vehicle control. Dashed boxes: inset regions. Scale bars: 5 μm (main images); 2 μm (insets). d Pearson’s coefficient of CYTH2 and ARF6 co-localisation ± S.E.M. following 0–120-min treatment with 10 µg/ml CAR or vehicle control. Datapoints represent mean Pearson’s coefficient of CYTH2 and ARF6 co-localisation per image. N = 3 independent replicate experiments with 17–22 images analysed per condition. Kruskal-Wallis test with Dunn’s multiple comparisons test: Nil 0’ vs CAR 60’ P = 7.385 × 10−5; Nil 60’ vs CAR 60’ P = 0.0019; CAR 60’ vs mCAR 60’ P = 3.828 × 10−6. e CAR peptide promotes association of CYTH2 with ARF6. Immunoprecipitation of ARF6 following 0, 30 or 60 min CAR or mCAR treatment. immunoprecipitation with rabbit anti-ARF6 (IP: ARF6); or non-immune rabbit IgG (IP: IgG). Immune complex-associated CYTH2 and ARF6 detected by western blot. f, g ARF6 activity in CTRL KD or CYTH2 KD keratinocytes following 120 min in presence or absence of CAR or mCAR. N = 4 Independent biological replicate experiments. f Representative blots of ARF6 GTP (GST-GGA3 pull-down eluate); Total ARF6: ARF6 expression in total cell lysate. Actin detection in TCL acts as a loading control. CYTH2 detection in TCL demonstrates level of siRNA-mediated knockdown. g Mean ARF6 activity relative to total ARF6 ± S.E.M. normalised to Nil treatment in Ctrl KD cells. N = 4 independent replicate experiments. Datapoints represent ARF6 activity in each experiment. Brown–Forsythe and Welch ANOVA test for multiple comparisons assuming non-equal variance: CTRL KD Nil vs CAR P = 0.0027; CTRL KD CAR vs mCAR P = 0.0213. hk Migration of control (CTRL KD) or human CYTH2 knockdown (CYTH2 KD) HaCaTs in presence or absence 10 µg/ml CAR or mCAR peptide. h Scratch wound closure relative to untreated Ctrl KD cells, (i) mean migration speed throughout timelapse, j speed at early migration phase (0–5 h), k speed at late migration phase (12–17 h). Migration data are means ± S.E.M from three independent experiments in triplicate. Statistical analyses are two-way ANOVA with Tukey’s multiple comparisons test: h Scratch wound closure: CTRL KD Nil vs CAR P = 3.331 × 10−5; CTRL KD CAR vs mCAR P = 0.0005; i Total migration speed: CTRL KD Nil vs CAR P = 0.017; CTRL KD CAR vs mCAR ns; k Late phase: CTRL KD Nil vs CAR P = 0.0039; CTRL KD CAR vs mCAR P = 0.0317. Source data are provided as a Source Data file.
Fig. 9
Fig. 9. SDC4 is required for CAR peptide induced wound re-epithelialisation and CAR homing.
Male SDC4 WT and KO mice with full thickness skin excision wounds were treated either with systemically i.v. administered CAR peptide or BSA/PBS (control) as described in methods, wounds were harvested on day 7. a Gap between the epidermal tongues (WGX: area of open wound without re-epithelialisation) represented as percentage (%) of original wound size. SDC4 WT: CAR vs. Control P = 0.05. b Percentage of completely re-epithelialised wounds. SDC4 WT: CAR vs. Control P = 0.042. c Area of hyperproliferative epidermal tongues. SDC4 WT: CAR vs. Control P = 0.0069. d Overall wound width, indicative of contraction. e Cross-sectional area of granulation tissue quantified by examining two histological HE-stained sections from each wound. f Representative histological HE-stained pictures of the wounds treated with CAR peptide and BSA/PBS (Control) collected on day 7 are shown for wound re-epithelialisation. The epidermal tongues are marked with yellow dashed lines. Six animals, each with four wounds, in every treatment group. Scale bars: 800 µm. Values are mean ± S.E.M. Each data point represents an individual wound. N = 24 wounds in each treatment group (ae). Wilcoxon Mann–Whitney test with tie correction and Bonferroni post-hoc test (two-sided) (a, c, d and e) and Pearson´s Chi-square test (without continuity correction) with post-hoc test Fisher exact test (two-sided) (b). Source data are provided as a Source Data file. g CAR peptide homing. Representative micrographs of CAR-peptide distribution in skin wound sections are presented for SDC4 WT and SDC4 KO groups, following administration of fluorescein-labelled CAR-peptide for 4 h prior to wound harvesting. Peptide localisation determined by anti-fluorescein immunodetection. Representative micrographs of CAR-peptide distribution in skin wound sections are presented for SDC4 WT and SDC4 KO groups. Arrows indicate CAR homing to blood vessels. n = 12 individual wounds; three animals with four wounds. Scale bar: 250 µm.
Fig. 10
Fig. 10. Systemically administered wound-homing peptide accelerates wound healing by modulating SDC4 function.
Schematic diagram highlighting proposed mechanism of action of CAR peptide. Systemically administered CAR peptide associates with the HSPG SDC4, which is restricted to epidermis and blood vessels in mouse skin wounds. CAR induces SDC4-dependent activation of the small GTPase ARF6, via the guanine nucleotide exchange factor CYTH2, to promote SDC4-, ARF6- and CYTH2-mediated keratinocyte migration and endogenous re-epithelialisation and wound repair mechanisms.

References

    1. Martino MM, Briquez PS, Maruyama K, Hubbell JA. Extracellular matrix-inspired growth factor delivery systems for bone regeneration. Adv. Drug. Deliv. Rev. 2015;94:41–52. doi: 10.1016/j.addr.2015.04.007. - DOI - PubMed
    1. Järvinen TAH, Ruoslahti E. Generation of a multi-functional, target organ-specific, anti-fibrotic molecule by molecular engineering of the extracellular matrix protein, decorin. Br. J. Pharmacol. 2019;176:16. doi: 10.1111/bph.14374. - DOI - PMC - PubMed
    1. Järvinen TAH, Ruoslahti E. Molecular changes in the vasculature of injured tissues. Am. J. Pathol. 2007;171:702–711. doi: 10.2353/ajpath.2007.061251. - DOI - PMC - PubMed
    1. Järvinen TAH, Ruoslahti E. Target-seeking antifibrotic compound enhances wound healing and suppresses scar formation in mice. Proc. Natl. Acad. Sci. USA. 2010;107:21671–21676. doi: 10.1073/pnas.1016233107. - DOI - PMC - PubMed
    1. Järvinen TAH, Pemmari T. Systemically administered, target-specific, multi-functional therapeutic recombinant proteins in regenerative medicine. Nanomaterials. 2020;10:226. doi: 10.3390/nano10020226. - DOI - PMC - PubMed

Publication types

Associated data