. 2023 Dec 6;14(1):7791.
doi: 10.1038/s41467-023-42178-6.

Inhibiting stromal Class I HDACs curbs pancreatic cancer progression

Affiliations

Inhibiting stromal Class I HDACs curbs pancreatic cancer progression

Gaoyang Liang et al. Nat Commun. .

Abstract

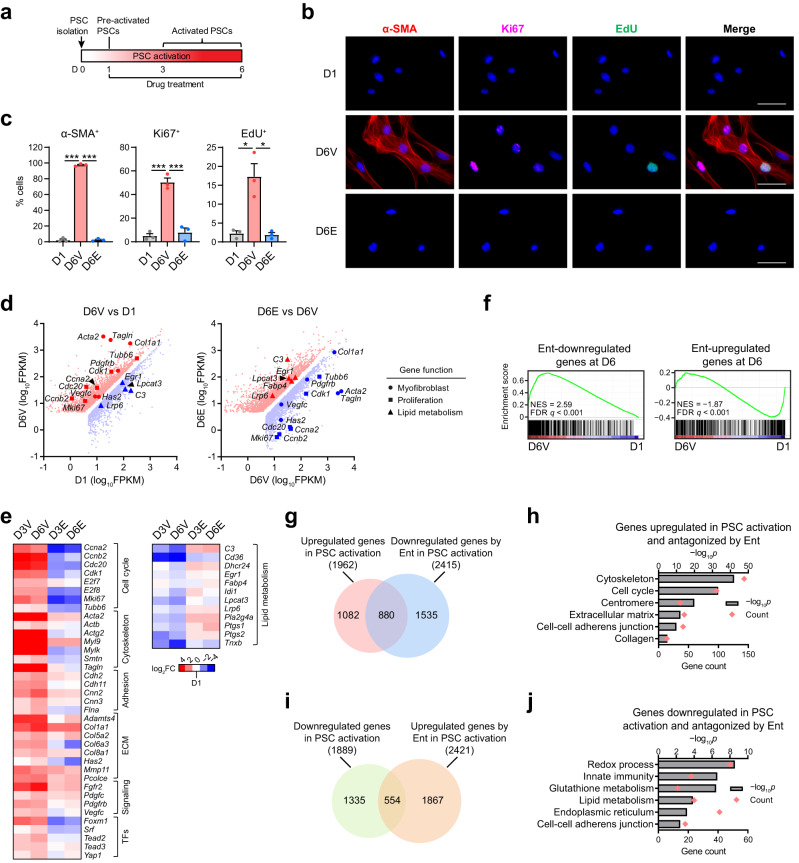
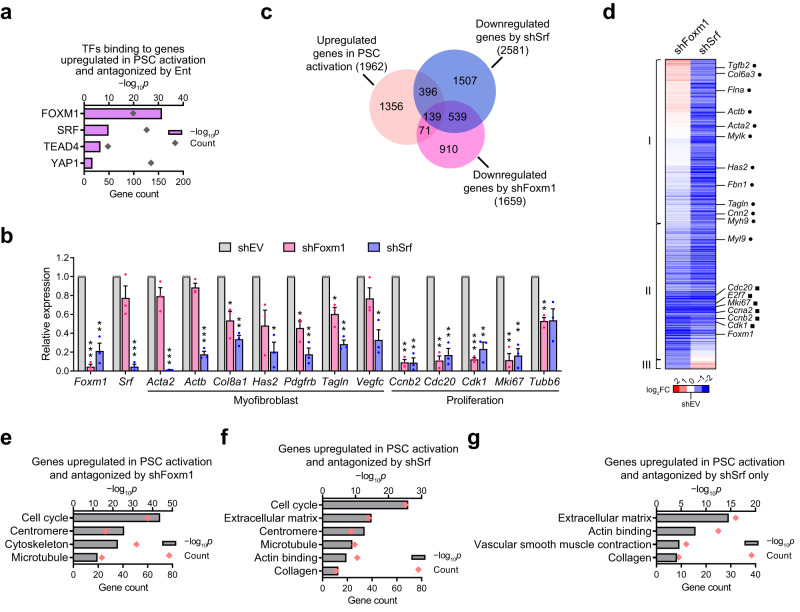
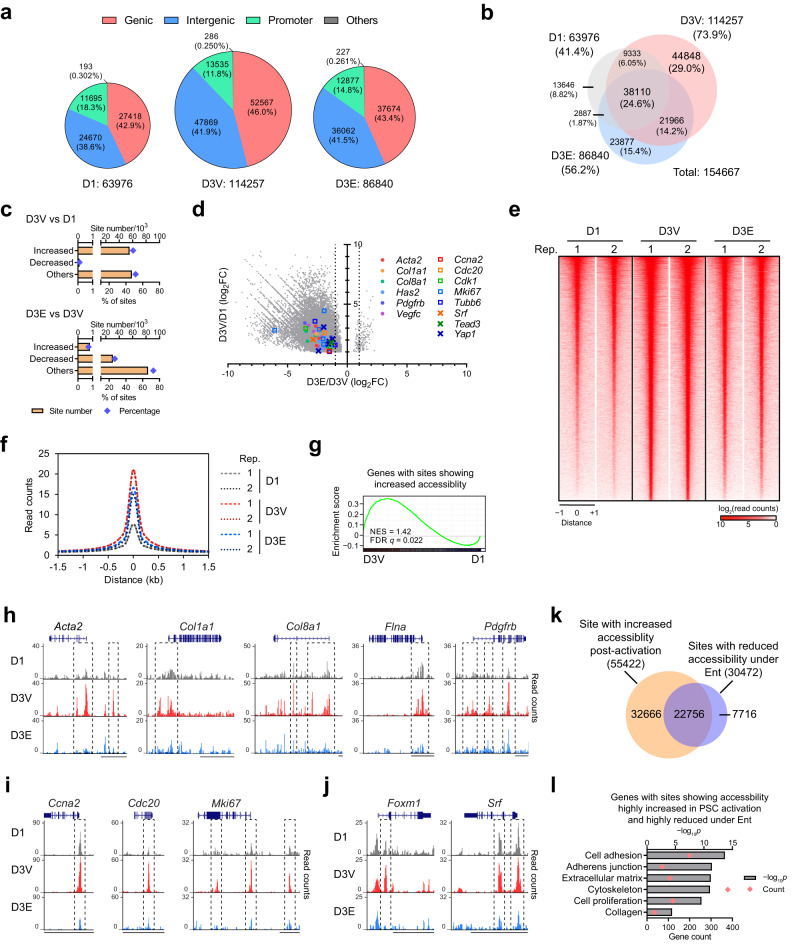
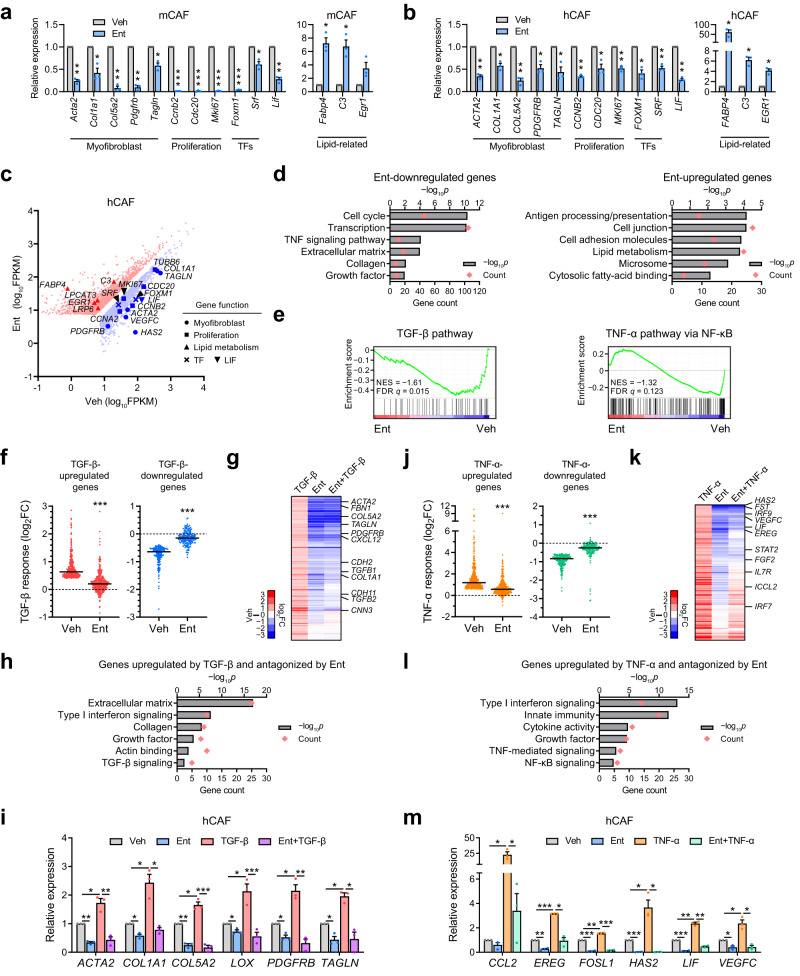
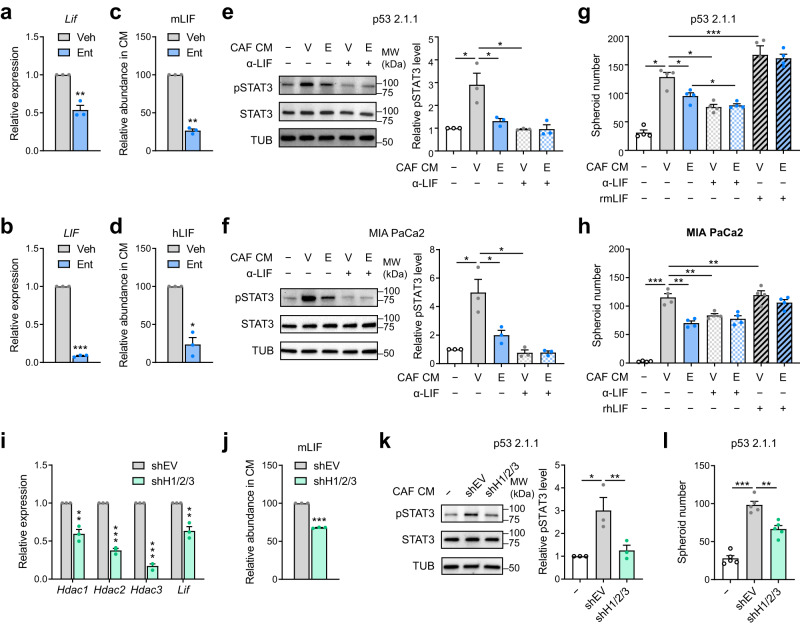
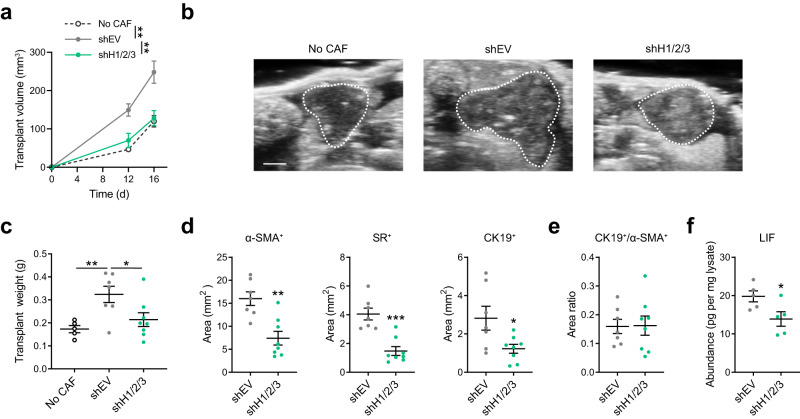
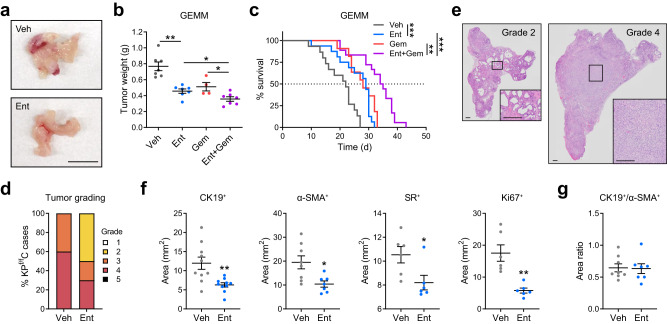
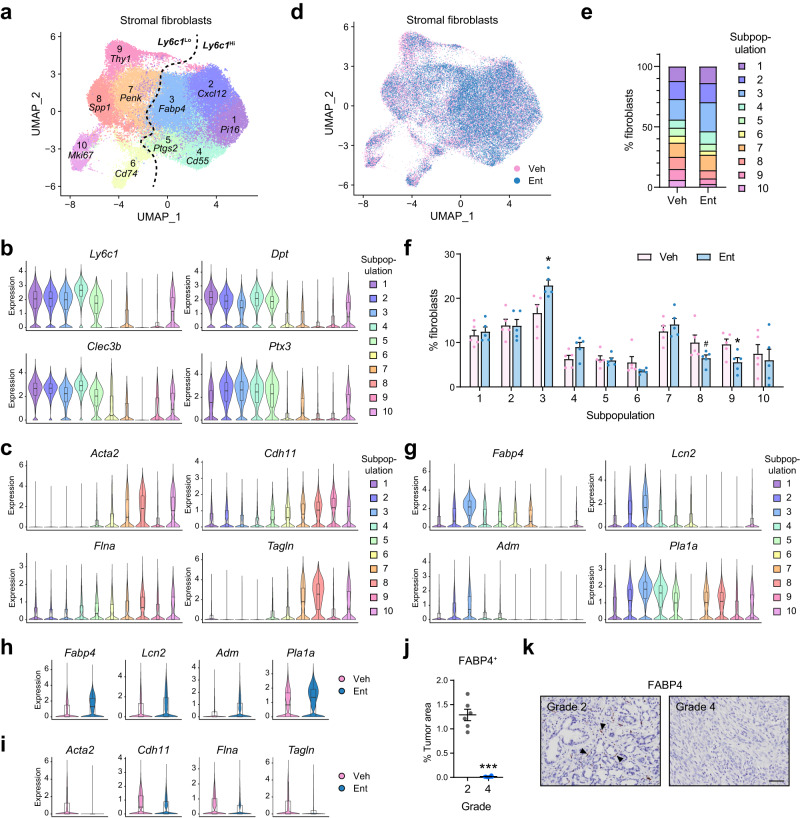
Oncogenic lesions in pancreatic ductal adenocarcinoma (PDAC) hijack the epigenetic machinery in stromal components to establish a desmoplastic and therapeutic resistant tumor microenvironment (TME). Here we identify Class I histone deacetylases (HDACs) as key epigenetic factors facilitating the induction of pro-desmoplastic and pro-tumorigenic transcriptional programs in pancreatic stromal fibroblasts. Mechanistically, HDAC-mediated changes in chromatin architecture enable the activation of pro-desmoplastic programs directed by serum response factor (SRF) and forkhead box M1 (FOXM1). HDACs also coordinate fibroblast pro-inflammatory programs inducing leukemia inhibitory factor (LIF) expression, supporting paracrine pro-tumorigenic crosstalk. HDAC depletion in cancer-associated fibroblasts (CAFs) and treatment with the HDAC inhibitor entinostat (Ent) in PDAC mouse models reduce stromal activation and curb tumor progression. Notably, HDAC inhibition (HDACi) enriches a lipogenic fibroblast subpopulation, a potential precursor for myofibroblasts in the PDAC stroma. Overall, our study reveals the stromal targeting potential of HDACi, highlighting the utility of this epigenetic modulating approach in PDAC therapeutics.


Conflict of interest statement

R.M.E. and M.D. are co-founders of a company developing entinostat. The remaining authors declare no competing interests.

Figures

Fig. 1
Fig. 1. HDACi suppresses PSC activation via transcriptional regulation.
a Scheme of in vitro PSC activation with drug treatment. b, c Representative images (b) and quantifications (c) of immunofluorescence staining for α-SMA, Ki67 and EdU in PSCs at day (D) 1 and 6 under vehicle (Veh, D6V) or Ent treatment (D6E; 5 μM). Scale bar, 50 μm. n = 3 independent samples. Data are presented as mean values ± SEM. *p < 0.05, = 0.044 (EdU+, D6V vs D1), 0.011 (EdU+, D6E vs D6V); ***p < 0.001 (others). Two-sided t-test. d Scatter plots from RNA-seq data showing genes significantly upregulated (red) and downregulated (blue) in D6V compared to D1, and those in D6E compared to D6V, with representative genes functionally related to myofibroblast identity (circle), proliferation (square) and lipid metabolism (triangle) highlighted. n = 3 independent samples. False discovery rate (FDR) q < 0.05. FPKM, fragments per kilobase per million reads. e Heatmap showing the expression fold-change (FC) in PSC samples for selected functional genes in PSC activation with or without Ent. f GSEA plots showing the top 500 Ent-downregulated and -upregulated genes at D6 are respectively in genes induced and repressed in PSC activation. NES, normalized enrichment score. g, h Venn diagram comparing genes upregulated in PSC activation and those downregulated by Ent at D6 (g) and selected ontology terms enriched in the overlap genes with p-values and gene counts from GO analysis (h). i, j Venn diagram comparing genes downregulated in PSC activation and those upregulated by Ent at D6 (i) and selected ontology terms enriched in the overlap genes from GO analysis (j). GO analysis (h, j), one-sided Fisher’s exact test. Source data are provided in a Source Data file.
Fig. 2
Fig. 2. The SRF-FOXM1 TF axis mediates HDAC-coordinated transcriptional programs in PSC activation.
a Enrichment of TF binding sites at genes induced in PSC activation and suppressed by Ent. One-sided Fisher’s exact test. b RT-qPCR results showing the expression of Foxm1, Srf and selected functional markers upon shRNA-mediated inhibition (sh-), compared to empty vector (shEV). n = 3 independent samples. Data are presented as mean values ± SEM. *p < 0.05; **p < 0.01; ***p < 0.001. shFoxm1 vs shEV, p < 0.001 (Foxm1, Cdk1), = 0.040 (Col8a1), 0.018 (Pdgfrb), 0.030 (Tagln), 0.001 (Ccnb2), 0.003 (Cdc20), 0.006 (Mki67), 0.007 (Tubb6); shSrf vs shEV, p = 0.011 (Foxm1), <0.001 (Srf, Acta2), = 0.002 (Actb), 0.004 (Col8a1), 0.015 (Has2), 0.007 (Pdgfrb, Cdc20, Mki67), 0.003 (Tagln, Ccnb2), 0.024 (Vegfc), 0.009 (Cdk1). Two-sided t-test. c Venn diagram showing the distribution of genes significantly upregulated in activated PSCs and those downregulated by shFoxm1 or shSrf (FC > 2) as identified by RNA-seq. n = 2 independent samples. d Heatmap from hierarchical clustering showing the effects of FOXM1 and SRF depletion on genes induced by in vitro activation and suppressed by either TF depletion, including markers for myofibroblast (dot) and proliferation (square). Genes suppressed by shSrf only, by both shSrf and shFoxm1, and by shFoxm1 only (III) are respectively grouped in I, II, and III. eg Selected ontology terms enriched in genes induced in PSC activation and suppressed by shFoxm1 (e), by shSrf (f), and by shSrf only but not shFoxm1 (g). TF enrichment (a) and GO analyses (eg), one-sided Fisher’s exact test. Source data are provided in a Source Data file.
Fig. 3
Fig. 3. Ent treatment restricts chromatin opening during PSC activation.
a Numbers and percentages of accessible sites detected by ATAC-seq and their genomic annotations in pre-activated PSCs (D1) and PSCs at D3 under Veh (D3V) or Ent treatment (D3E, 5 μM). n = 2 independent samples. b Venn diagrams showing the distributions of accessible sites among PSC samples with the percentages relative to the total detected sites. c Numbers of sites with significantly increased or decreased accessibility (FC > 2, FDR q < 0.05) and those without significant changes (others) post-activation (D3V vs D1) and under Ent treatment (D3E vs D3V), along with the percentages relative to D3V. d Scatter plot showing the accessibility changes post-activation (y-axis) and under Ent treatment (x-axis) at genomic sites (22,879) with accessibility significantly increased in PSC activation (FC > 2, FDR q < 0.05) and changed by Ent (FDR q < 0.05), including sites at selected PSC activation markers and TFs. Dotted lines, FC of 2 (D3E vs D3V). e, f Heatmap showing the normalized ATAC-seq read counts (e) and histogram showing average normalized read counts (f) for genomic sites (55,422) showing significantly increased accessibility post-activation in individual replicates (Rep.) of PSC samples. g GSEA plots showing genes upregulated post-activation are enriched in genes with genomic sites showing highly increased accessibility. hj Genome browser tracks for selected myofibroblast (h), proliferation (i) and TF (j) gene loci in representative PSC samples with genomic sites displaying differential accessibility highlighted (box). Scale bar, 10 kb. k Venn diagram showing the distribution of genomic sites with significantly increased accessibility post-activation (FC > 2, FDR q < 0.05) and those with significantly reduced accessibility under Ent (FC > 2, FDR q < 0.05). l Representative enriched ontology terms for genes with sites showing accessibility highly increased post-activation (FC > 4, FDR q < 0.05) and highly reduced by Ent (FC > 4, FDR q < 0.05). GO analysis, one-sided Fisher’s exact test. Source data are provided as a Source Data file.
Fig. 4
Fig. 4. Ent suppresses CAF activation and TGF-β- and TNF-α-induced responses.
a, b RT-qPCR data showing the expression of representative functional genes after 2 d Ent treatment (10 μM) in mouse (m) (imCAF1, a) and human (h) CAF (ONO, b) cells. c Scatter plot from RNA-seq data showing genes significantly upregulated (red, 2080) or downregulated (blue, 2502) by Ent (10 μM, 2 d) in ONO with functional genes highlighted. FDR q < 0.05. d Selected ontology terms enriched in the top 500 Ent-downregulated or -upregulated genes. e GSEA plots showing the enrichment of TGF-β and TNF-α pathway components in Ent-downregulated genes. f Dot plots showing the TGF-β (1 ng/ml, 2 d) induced expression changes under Veh or Ent treatment (10 μM, 2 d) at TGF-β-upregulated (333) or -downregulated (170) genes in ONO. g Heatmap from hierarchical clustering showing the expression changes by TGF-β, Ent or both at genes induced by TGF-β and sensitive to Ent-directed suppression. h Representative ontology terms enriched in the gene set in g. i RT-qPCR results confirming the Ent effect on selected TGF-β-induced genes in ONO. j Dot plots showing the TNF-α (10 ng/ml, 8 h) induced expression changes under Veh or Ent treatment (10 μM, 40 h pre-treatment plus 8 h concurrent treatment with TNF-α) at TNF-α-upregulated (398) or -downregulated (189) genes in hCAFs (YAM). k Heatmap showing the expression changes under the treatments of TNF-α, Ent or both at genes upregulated by TNF-α and sensitive to Ent-directed suppression. l Representative ontology terms enriched in the gene set in k. m RT-qPCR results confirming the Ent effect on selected TNF-α-induced genes in YAM. RT-qPCR (a, b, i, m), n = 3 independent samples; data are presented as mean values ± SEM. RNA-seq, n = 2 (ONO) and 3 (YAM) independent samples. Dot plots (f, j): bars, medians. *p < 0.05; **p < 0.01; ***p < 0.001. Two-sided t-test. GO analysis (d, h, l), one-sided Fisher’s exact test. Source data including p-values are provided as a Source Data file.
Fig. 5
Fig. 5. HDACi lowers CAF-mediated pro-tumorigenic LIF-STAT3 signaling.
a, b RT-qPCR results showing Lif/LIF expression in mCAF (imCAF1, a) and hCAF (YAM, b) cells under Ent treatment (10 μM, 2 d) compared to Veh. c, d Relative abundance of mLIF (c) and hLIF (d) detected by immunoassay in CM from Ent-treated CAFs. e, f Representative images from Western blotting detecting pSTAT3, STAT3 and α-tubulin (TUB, sample processing control) in mouse (p53 2.1.1, e) and human PDAC cells (MIA PaCa2, f) treated with small molecule-depleted CM from Veh- (V) or Ent- (E) treated CAFs, and/or anti-LIF antibody (α-LIF, 4 μg/ml), with quantifications of pSTAT3/STAT3 ratio relative to no CM treatment. g, h Numbers of spheroids formed in p53 2.1.1 (g) and MIA PaCa2 cells (h) with CM, α-LIF antibody (4 μg/ml) and/or recombinant (r) m/hLIF (0.1 μg/ml) treatments. i RT-qPCR results showing the expression of Lif and HDAC genes in imCAF1 cells with shRNAs targeting Hdac1, 2 and 3 (shH1/2/3), compared to shEV. j Relative abundance of mLIF in CM from shH1/2/3 CAFs. k, l Representative images and quantifications of pSTAT3/STAT3 ratio from Western blotting (k) and results from spheroid assay (l) in p53 2.1.1 cells treated with CM from shEV or shH1/2/3 CAFs. RT-qPCR, LIF measurements, Western blotting, n = 3 independent samples; spheroid assays, n = 4 (g, h), 5 (l) cell sample replicates. Data are presented as mean values ± SEM. *p < 0.05; **p < 0.01; ***p < 0.001. Two-sided t-test. Source data including p-values are provided as a Source Data file.
Fig. 6
Fig. 6. HDAC depletion in CAFs reduces tumor progression in vivo.
a, b Estimated volumes (a) and representative images (D16 post-transplantation, b) from ultrasound imaging for orthotopic transplants of PDAC cells (p53 2.1.1) with or without CAFs transduced with shEV or shH1/2/3. Tumor boundaries are highlighted with dotted lines. c Transplant weights at the endpoint (D19). d, e Measurements of total α-SMA, Sirius Red (SR) and CK19 positive areas (d) and ratio of CK19+ and α-SMA+ areas (e) in whole transplant sections. f LIF abundance per mg transplant lysates measured by immunoassay. Transplant measurements (a, c), n = 5 (no CAF), 7 (shEV), 8 (shH1/2/3) transplants; staining quantifications (d, e), n = 7 (shEV), 8 (shH1/2/3) transplants; LIF immunoassay (f), n = 5 transplant lysates. Data are presented as mean values ± SEM. *p < 0.05, =0.033 (c, shH1/2/3 vs shEV), 0.025 (d, CK19+), 0.038 (f); **p < 0.01, =0.006 (a, shEV vs no CAF at D16), 0.004 (a, shH1/2/3 vs shEV at D16), 0.007 (c), 0.001 (d, α-SMA+); ***p < 0.001 (d, SR+). Two-sided t-test. Source data are provided as a Source Data file.
Fig. 7
Fig. 7. Ent treatment arrests tumor progression and provides therapeutic benefits in PDAC GEMM.
a, b Representative tumor images (a) and tumor weight measurement (b) from GEMM (KPf/fC mice) after 3-week treatment of Veh, Ent (5 mg/kg, daily), Gem (25 mg/kg, q3d) or the combination of Ent and Gem. Scale bar, 10 mm. n = 7 (Veh, Ent, Ent+Gem), 4 (Gem) mice. c Kaplan-Meier curves showing the survival time after treatment initiation in KPf/fC mice. n = 15 (Veh), 16 (Ent), 11 (Gem), 18 (Ent+Gem) mice. Median survival (d): 22 (Veh), 29 (Ent), 28 (Gem), 34.5 (Ent+Gem). d, e Pathological grading of tumor samples from Veh- or Ent-treated KPf/fC at moribund (d), and representative images of Grades 2 (well differentiated) and 4 (poorly differentiated) tumor sections with hematoxylin and eosin (H&E) staining (e). Scale bar, 25 μm. n = 10 tumors. f, g Measurements of total CK19, α-SMA, and Ki67 and SR positive areas (f) and ratio of CK19+ over α-SMA+ areas (g) in the whole tumor sections from KPf/fC mice under Veh or Ent treatment. n = 10 (f, CK19+), 8 (Veh in f, α-SMA+ and g), 7 (Ent in f, α-SMA+ and g), 6 (f, SR+ and Ki67+). p = 0.904 (g). Data in b, f, g are presented as mean values ± SEM. *p < 0.05, =0.025 (b, Ent+Gem vs Ent), 0.019 (b, Ent+Gem vs Gem), 0.013 (f, α-SMA+), 0.029 (f, SR+); **p < 0.01, =0.002 (c, Gem vs Ent+Gem), 0.004 (f, CK19+), 0.001 (f, Ki67+); ***p < 0.001 (b, Ent vs Veh; c, Ent vs Veh; c, Ent+Gem vs Ent). Survival analysis (c), log-rank test; others (b, f), two-sided t-test. Source data are provided as a Source Data file.
Fig. 8
Fig. 8. Ent treatment enriches lipogenic fibroblasts and reduced myofibroblast frequency in vivo.
a UMAP showing 10 stromal fibroblast subpopulations with representative markers from tumors in KPf/fC mice. n = 56,723 cells from 10 mice. b, c Violin plots showing the expression of selected inflammatory/adventitial (b) and myofibroblastic markers (c) in fibroblast subpopulations. d UMAP showing the distribution of stromal fibroblast subpopulations from Veh- or Ent-treated KPf/fC mice. n = 30,867 cells from 5 Veh-treated mice, 25,826 cells from 5 Ent-treated mice. e, f Bar graphs showing the percentages of fibroblast subpopulations on average (e) and in individual mice (f). #, p = 0.062 (Subpopulation 8); *p < 0.05, =0.001 (Subpopulation 3), 0.033 (Subpopulation 9). Two-sided t-test. g Violin plots showing the expression of selected markers for the lipogenic subpopulation (Subpopulation 3). h, i Violin plots showing that Ent enhances the expression of lipogenic markers (h) and reduces myofibroblast markers (i) in the bulk fibroblast populations. j, k Quantifications (j) and representative images (k) of FABP4 staining in representative areas of Grades 2 and 4 tumors from KPf/fC mice. n = 6 representative areas. ***p < 0.001. Two-sided t-test. Scale bar, 200 μm. Boxes in violin plots (b, c, g, h, i): center lines, medians; box limits, first and third quartiles; whiskers, minima (first quantiles –1.5 × IQR) and maxima (third quantiles + 1.5 × IQR). IQR, interquartile range. Data in f, j are presented as mean values ± SEM. Source data are provided as a Source Data file.

Update of

References

    1. Rahib L, et al. Projecting cancer incidence and deaths to 2030: the unexpected burden of thyroid, liver, and pancreas cancers in the United States. Cancer Res. 2014;74:2913–2921. doi: 10.1158/0008-5472.CAN-14-0155. - DOI - PubMed
    1. Siegel RL, Miller KD, Fuchs HE, Jemal A. Cancer Statistics, 2021. CA A Cancer J. Clinic. 2021;71:7–33. doi: 10.3322/caac.21654. - DOI - PubMed
    1. Apte MV, Pirola RC, Wilson JS. Pancreatic stellate cells: a starring role in normal and diseased pancreas. Front. Physiol. 2012;3:344. doi: 10.3389/fphys.2012.00344. - DOI - PMC - PubMed
    1. Ying H, et al. Genetics and biology of pancreatic ductal adenocarcinoma. Genes Dev. 2016;30:355–385. doi: 10.1101/gad.275776.115. - DOI - PMC - PubMed
    1. Evan GI, et al. Re-engineering the pancreas tumor microenvironment: a “regenerative program” hacked. Clin. Cancer Res. 2017;23:1647–1655. doi: 10.1158/1078-0432.CCR-16-3275. - DOI - PMC - PubMed

Publication types

MeSH terms