. 2023 Dec 7;13(1):21569.
doi: 10.1038/s41598-023-48660-x.

Structural lineament analysis of the Bir El-Qash area, Central Eastern Desert, Egypt, using integrated remote sensing and aeromagnetic data

Affiliations

Structural lineament analysis of the Bir El-Qash area, Central Eastern Desert, Egypt, using integrated remote sensing and aeromagnetic data

Waheed H Mohamed et al. Sci Rep. .

Abstract

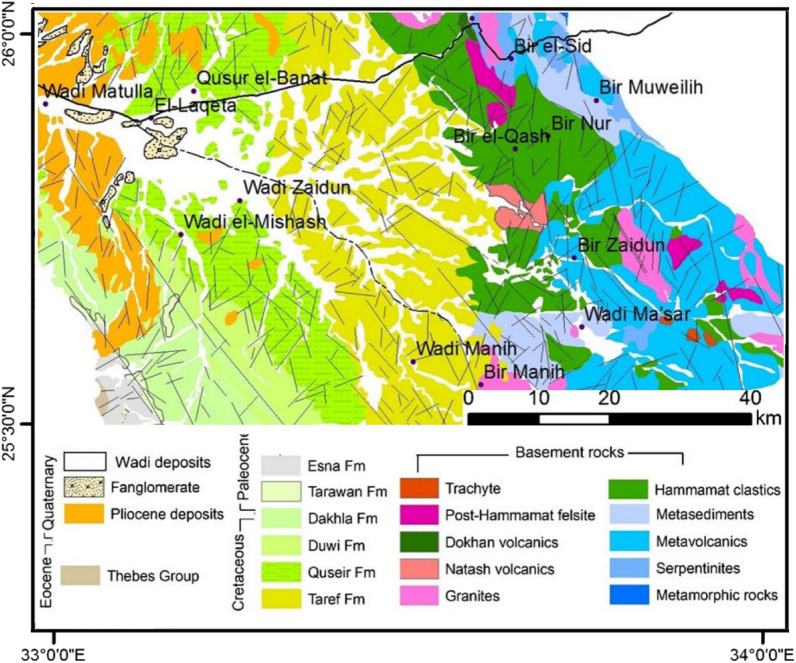
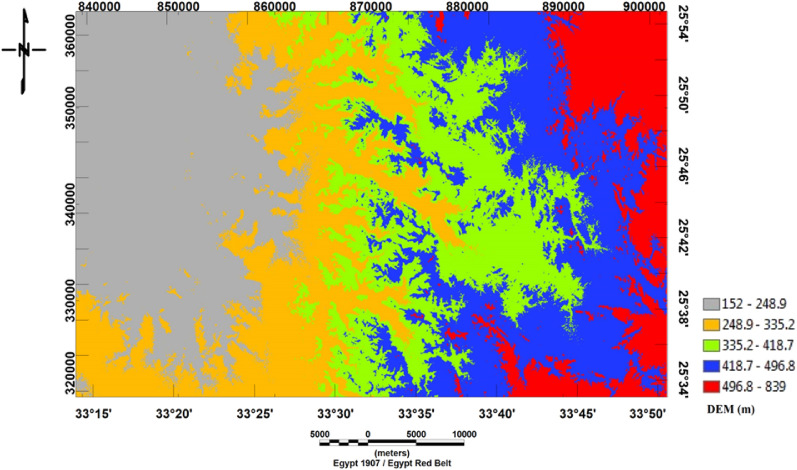
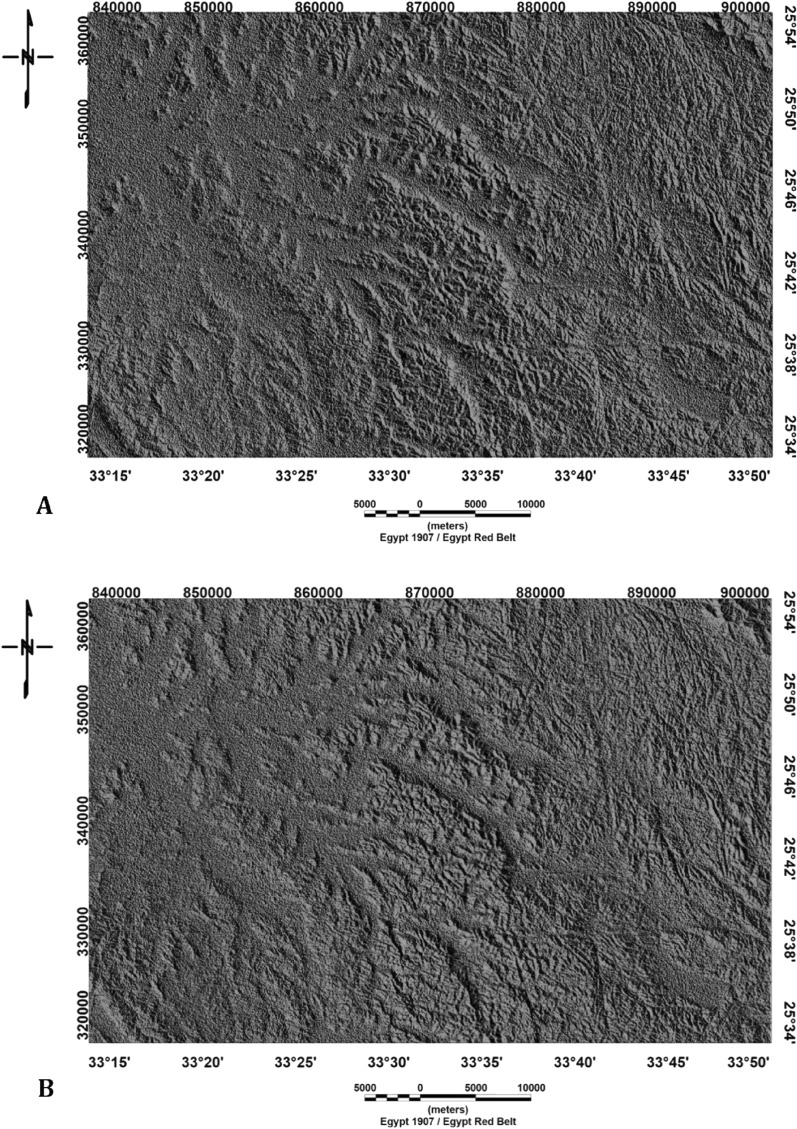
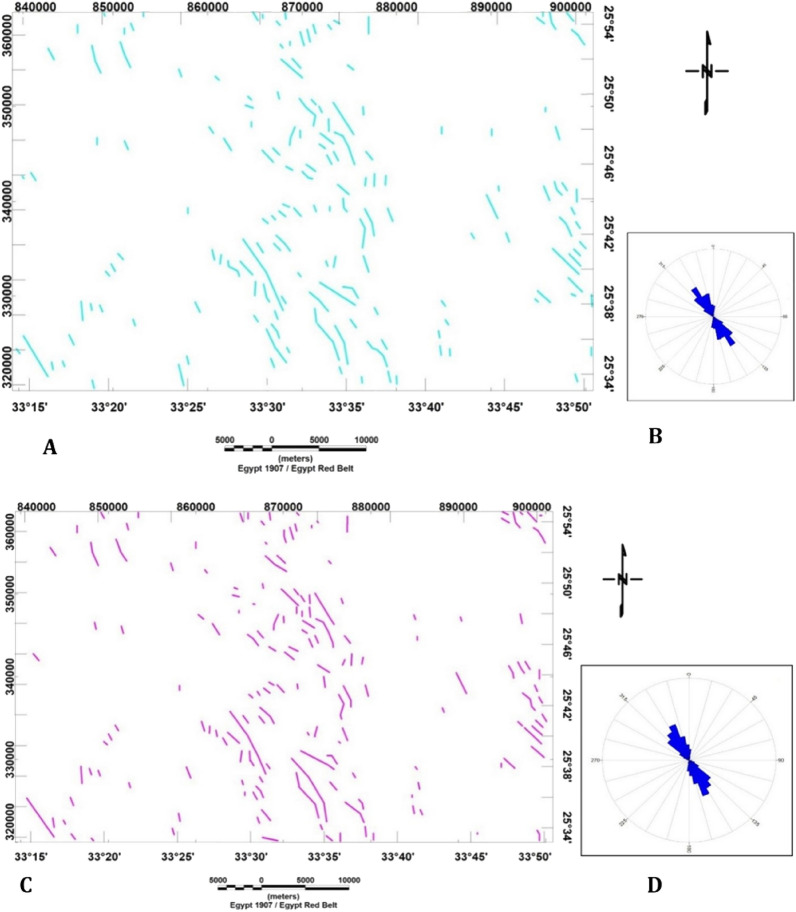
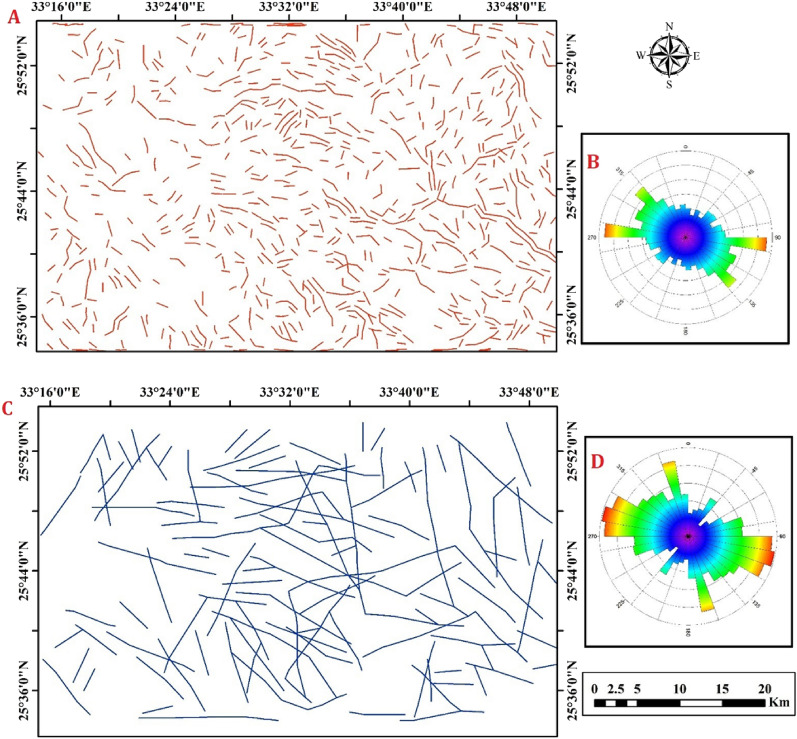
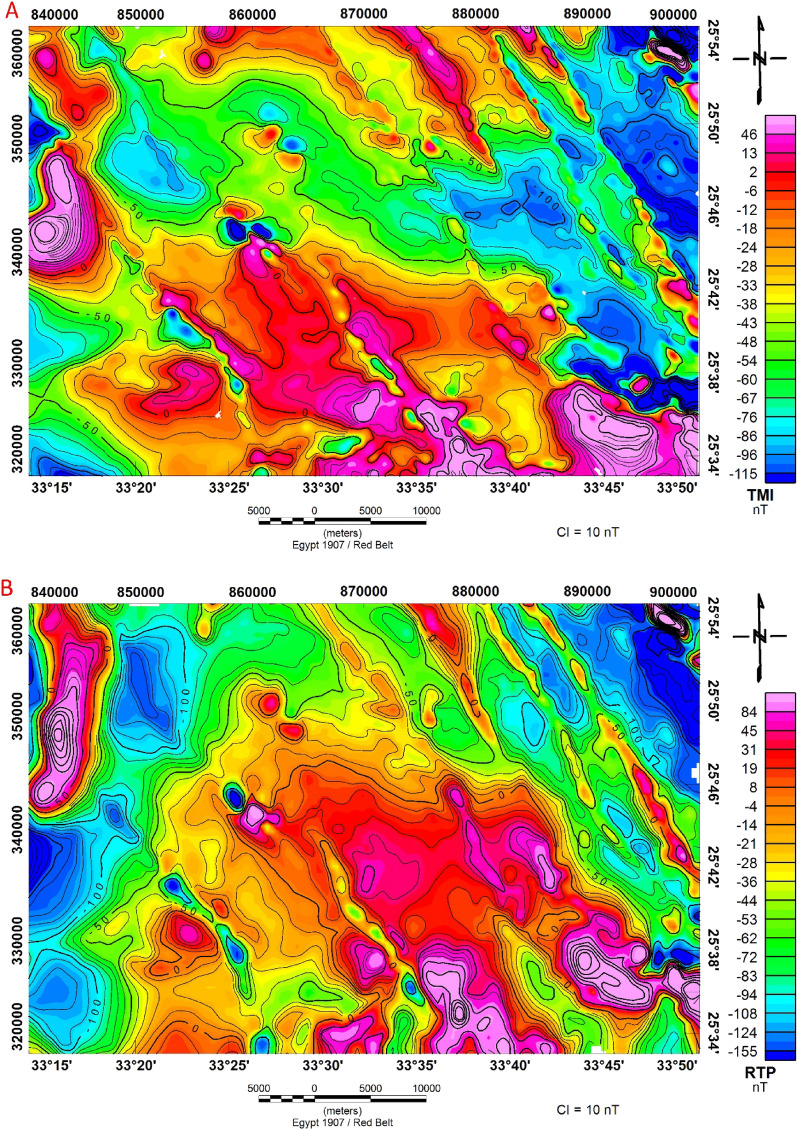
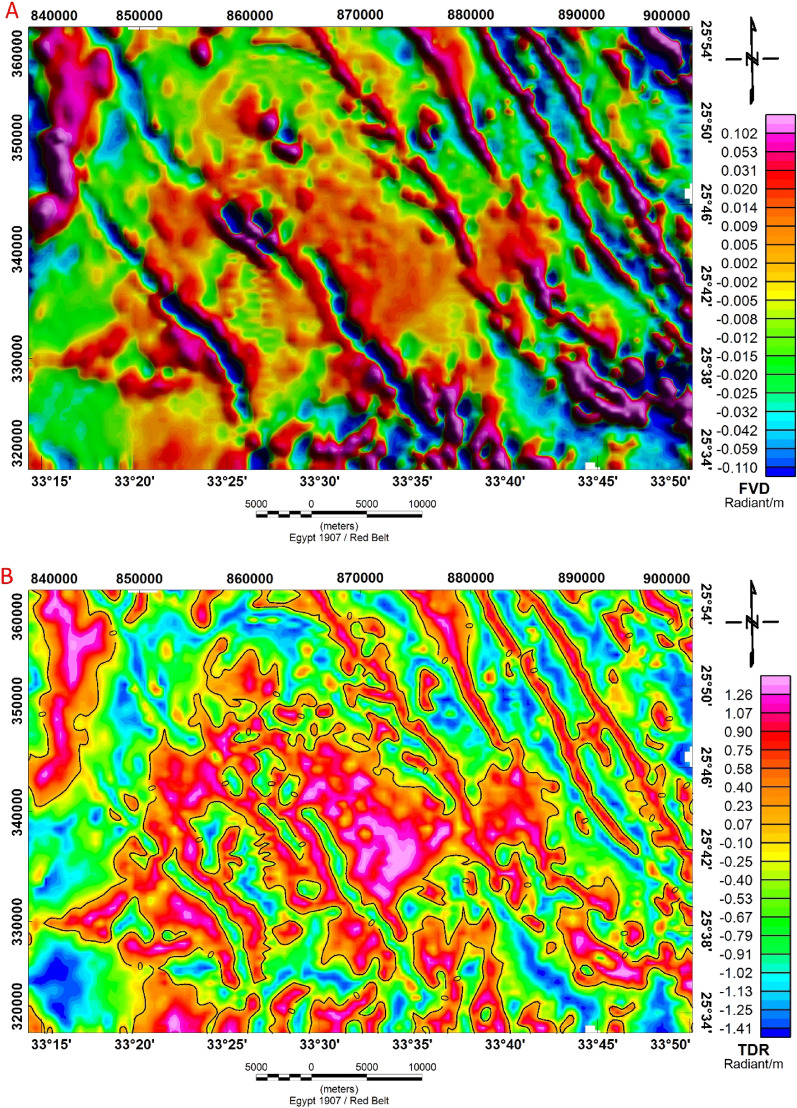
The Bir El-Qash area, located in the Central Eastern Desert of Egypt, is characterized by a diverse range of igneous, metamorphic, and sedimentary rocks with ages spanning from the Late Proterozoic to Quaternary. Integration of remote sensing with aeromagnetic data was conducted to generate surface and subsurface structural lineaments. Shaded relief from digital elevation models, principal component analysis of Landsat-8 data, and ALOS/PALSAR images were utilized to create lineament maps. Airborne magnetic data were employed to reveal subsurface characterizations. The study area has undergone various tectonic activities, resulting in complex structures. Multiple fault trends and fractures were identified, including the NW-SE (Red Sea-Gulf of Suez) trend, the NE-SW trending Syrian arc trend, the N-S trending East African trend and the WNW-ESE trend. By analyzing the tectonic features of the Bir El-Qash area, this study provides insights into the geological history and evolution of the Eastern Desert of Egypt.


Conflict of interest statement

The authors declare no competing interests.

Figures

Figure 1
Figure 1
Location map of the Bir El-Qash area, Central Eastern Desert, Egypt (using Arc GIS 10.8 and ENVI 5.3 software).
Figure 2
Figure 2
Geological map of the Bir El-Qash Area, Central Eastern Desert, Egypt after, (using Arc GIS 10.4).
Figure 3
Figure 3
(A) Geologic fault trends and fractures derived from the geologic map of Bir El-Qash area, Central Eastern Desert, Egypt and (B) Rose diagram of geologic lineaments of the study area.
Figure 4
Figure 4
Digital Elevation Model (DEM) of Bir El-Qash area, Central Eastern Desert, Egypt.
Figure 5
Figure 5
(A) Combination of shaded relief images of the Bir El-Qash region, Central Eastern Desert, Egypt, with sun angles of 0°, 45°, 90°, and 135°. (B) Shaded relief image generated by integrating four shaded relief images of the Bir El-Qash region in Egypt's Central Eastern Desert with sun angles of 180°, 225°, 270°, and 315°.
Figure 6
Figure 6
(A) Lineament map generated by integrating shaded relief images with sun angles of 0°, 45°, 90°, and 135° and (B) Rose diagram of the lineaments of the Bir El-Qash region, Centr of Eastern Desert, Egypt. (C) Lineament created by integrating of shaded relief images with sun angles of 180°, 225°, 270°, and 315° and (D) Rose diagram of the automated lineaments of Bir El-Qash region, Central of Eastern Desert, Egypt.
Figure 7
Figure 7
(A) Principal Component Analysis (PC1) image of the study area. (B) Grayscale image of AlOS/PALSAR SAR data.
Figure 8
Figure 8
(A) Automatic lineament map of PCA1 image of the study area. (B) Rose diagram of automatic Lineament map. (C) Automatic lineament map of PALSAR image of the study area. (D) Rose diagram of automatic Lineament map.
Figure 9
Figure 9
(A) Total Magnetic Intensity Map (TMI), and (B) Reduced to northern magnetic pole (RTP) map of the of Bir El-Qash area, Central Eastern Desert, Egypt.
Figure 10
Figure 10
Power spectrum technique shows the depth of magnetic sources of Bir El-Qash area, Central Eastern Desert, Egypt.
Figure 11
Figure 11
(A) Regional anomaly map and, (B) Residual anomaly map of airborne magnetic data of Bir El-Qash area, Central Eastern Desert, Egypt.
Figure 12
Figure 12
(A) First order anomaly map of vertical derivative technique and, (B) Tilt Derivative (TDR) technique of Bir El-Qash area, Central Eastern Desert, Egypt.
Figure 13
Figure 13
(A) Structural index of (0) and (B) Structural index of (1) based on the Euler deconvolution technique of Bir El-Qash area, Central Eastern Desert, Egypt.
Figure 14
Figure 14
Enhanced horizontal gradient amplitude of Bir El-Qash area, Central Eastern Desert, Egypt.
Figure 15
Figure 15
(A) Structural elements resulting from tilt derivative map, (B): rose diagram of structural elements of tilt derivative map, (C) shallow structural elements, (D) rose diagram of shallow structural elements and, (E) deep-seated structural elements and, (F) rose diagram of deep-seated structural elements of the study area.

References

    1. Eldosouky AM, El-Qassas RAY, Pour AB, Mohamed H, Sekandari M. Integration of ASTER satellite imagery and 3D inversion of aeromagnetic data for deep mineral exploration. Adv. Space Res. 2021;68:3641–3662. doi: 10.1016/j.asr.2021.07.016. - DOI
    1. Reynolds, J. An Introduction to Applied and Environmental Geophysics, Wiley, Chester, 2nd edition, 710p (1997).
    1. Khalil A, Hafeez TH, Kotb AE, Saleh HS, Mohamed WH, Takla E. Subsurface structural characterization as deduced from potential field data—West Beni Suef, Western Desert, Egypt. Arab. J. Geosci. 2022;15:1627. doi: 10.1007/s12517-022-10900-1. - DOI
    1. Lasheen ESR, Mohamed WH, Ene A, Awad HA, Azer MK. Implementation of petrographical and aeromagnetic data to determine depth and structural trend of Homrit Waggat Area, Central Eastern Desert, Egypt. Appl. Sci. 2022;12:8782. doi: 10.3390/app12178782. - DOI
    1. Dixon, T. H. Evolution of Continental Crust in the Late Precambrian Egyptian Shield. California University Press, San Diego, USA (1979)