. 2024 Jan;56(1):152-161.
doi: 10.1038/s41588-023-01608-3. Epub 2023 Dec 6.

Inferring compound heterozygosity from large-scale exome sequencing data

Collaborators, Affiliations

Inferring compound heterozygosity from large-scale exome sequencing data

Michael H Guo et al. Nat Genet. 2024 Jan.

Abstract

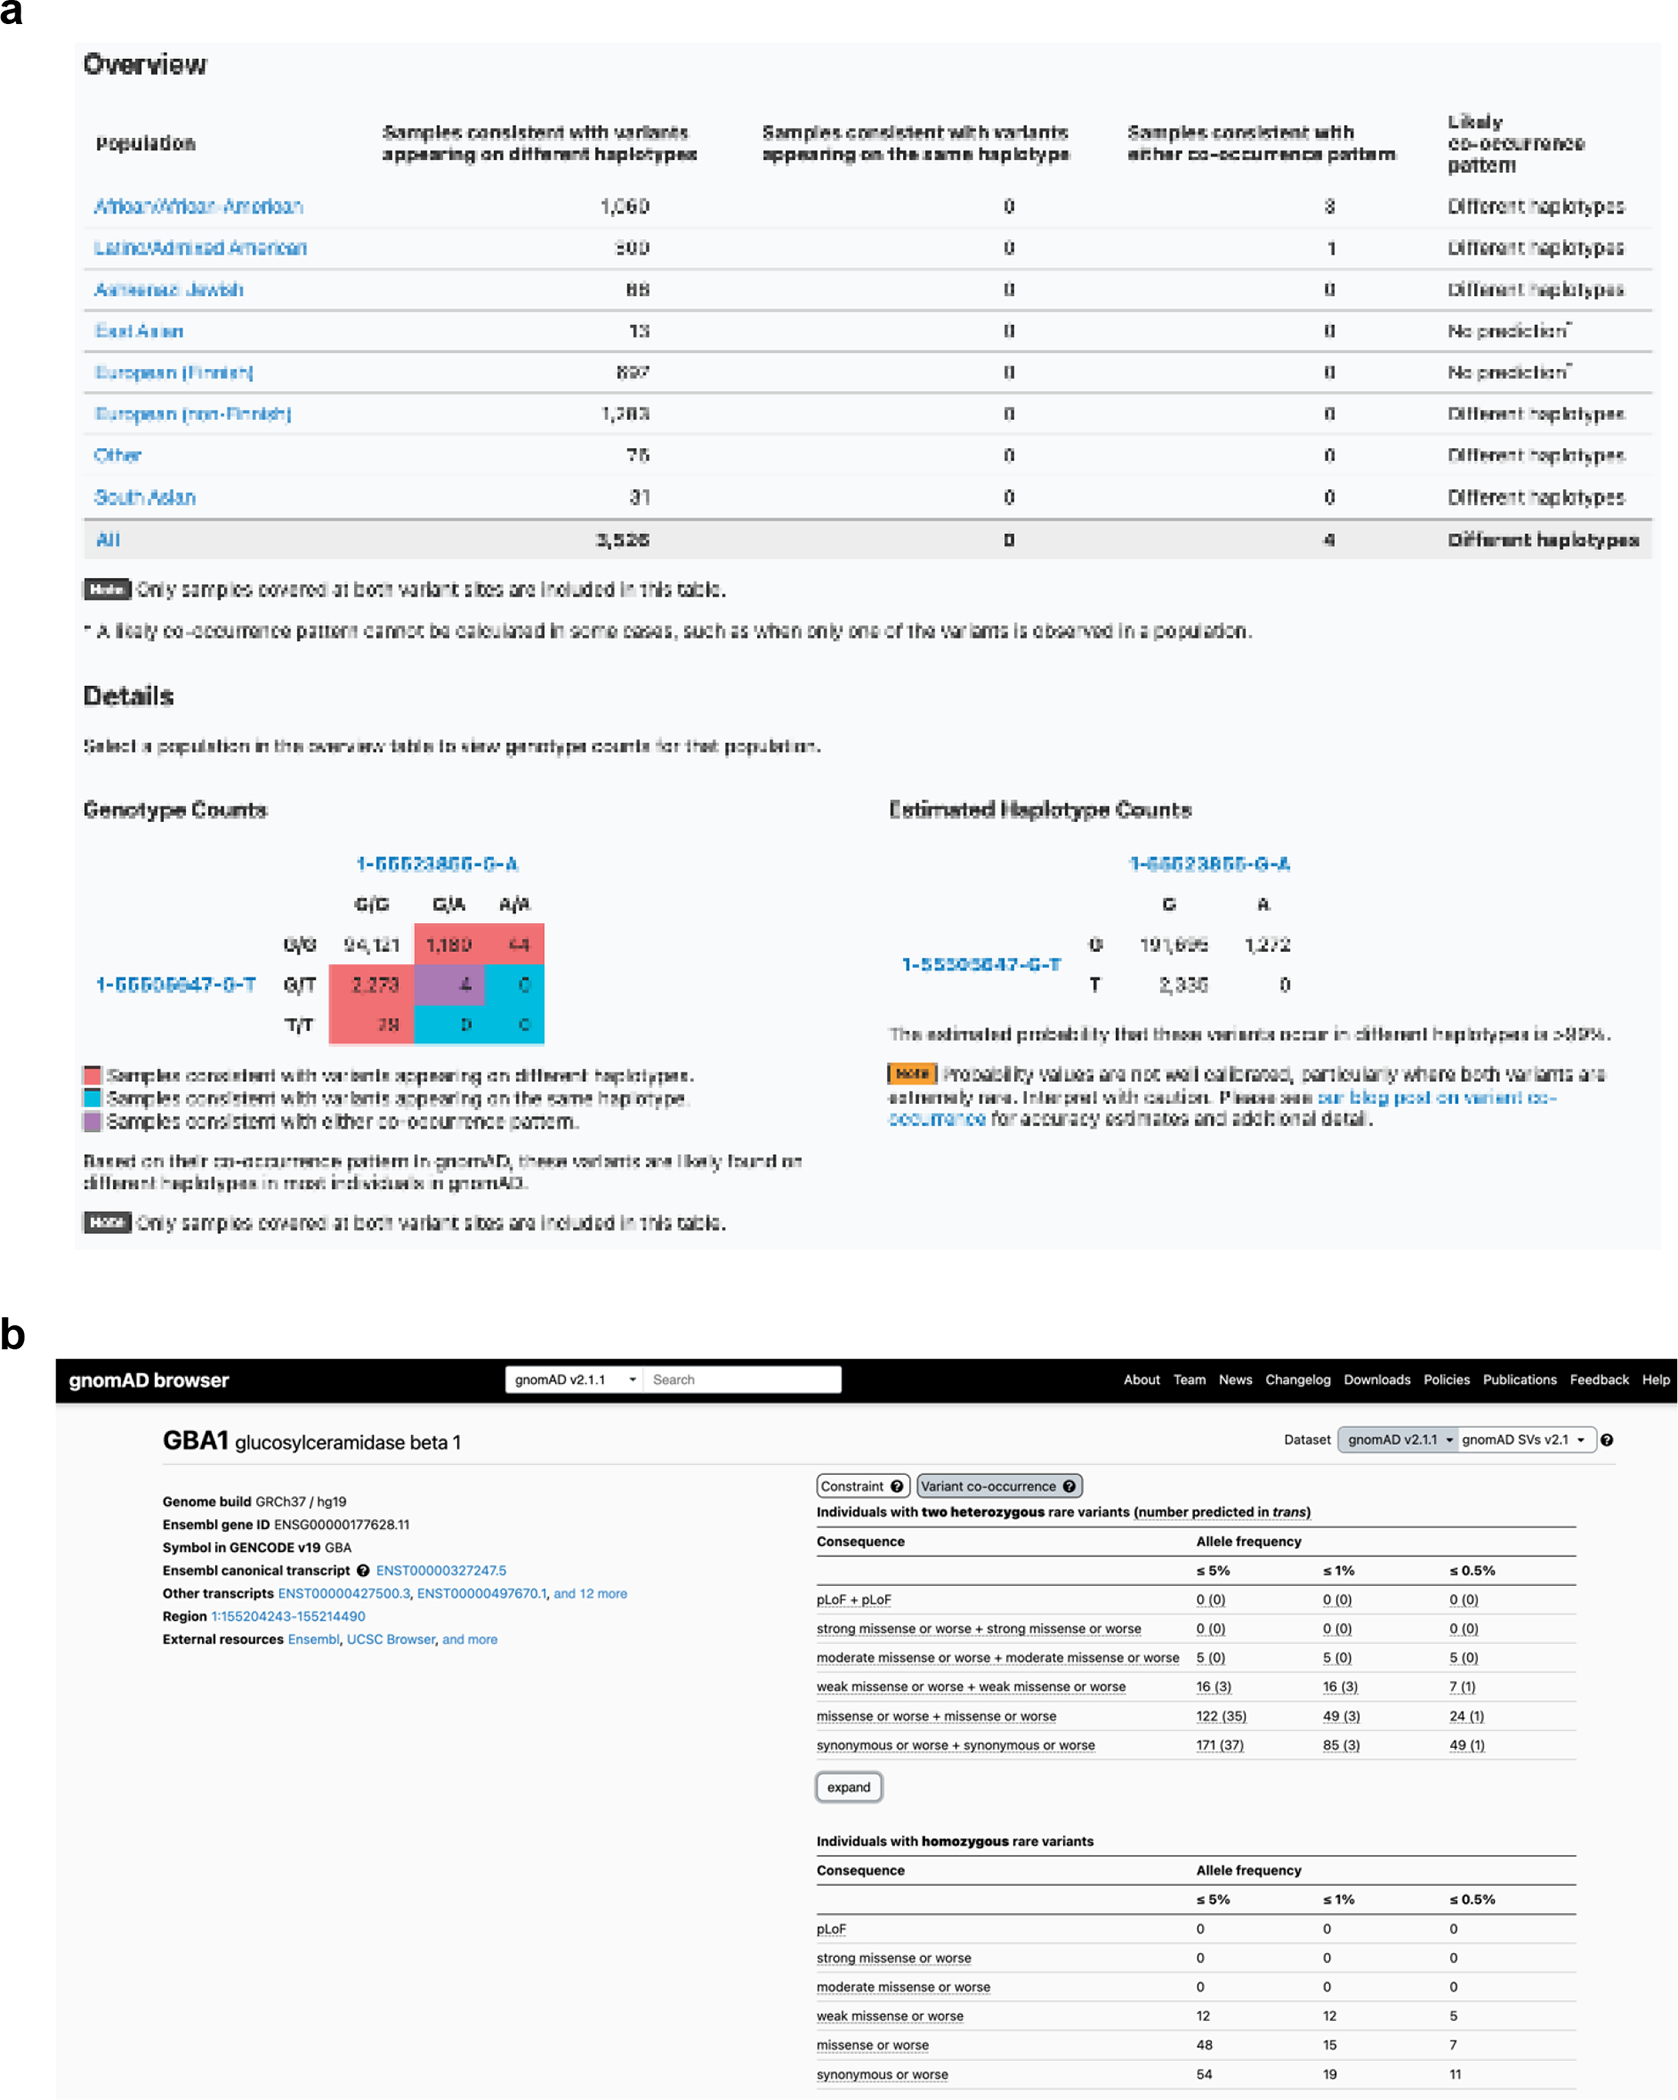
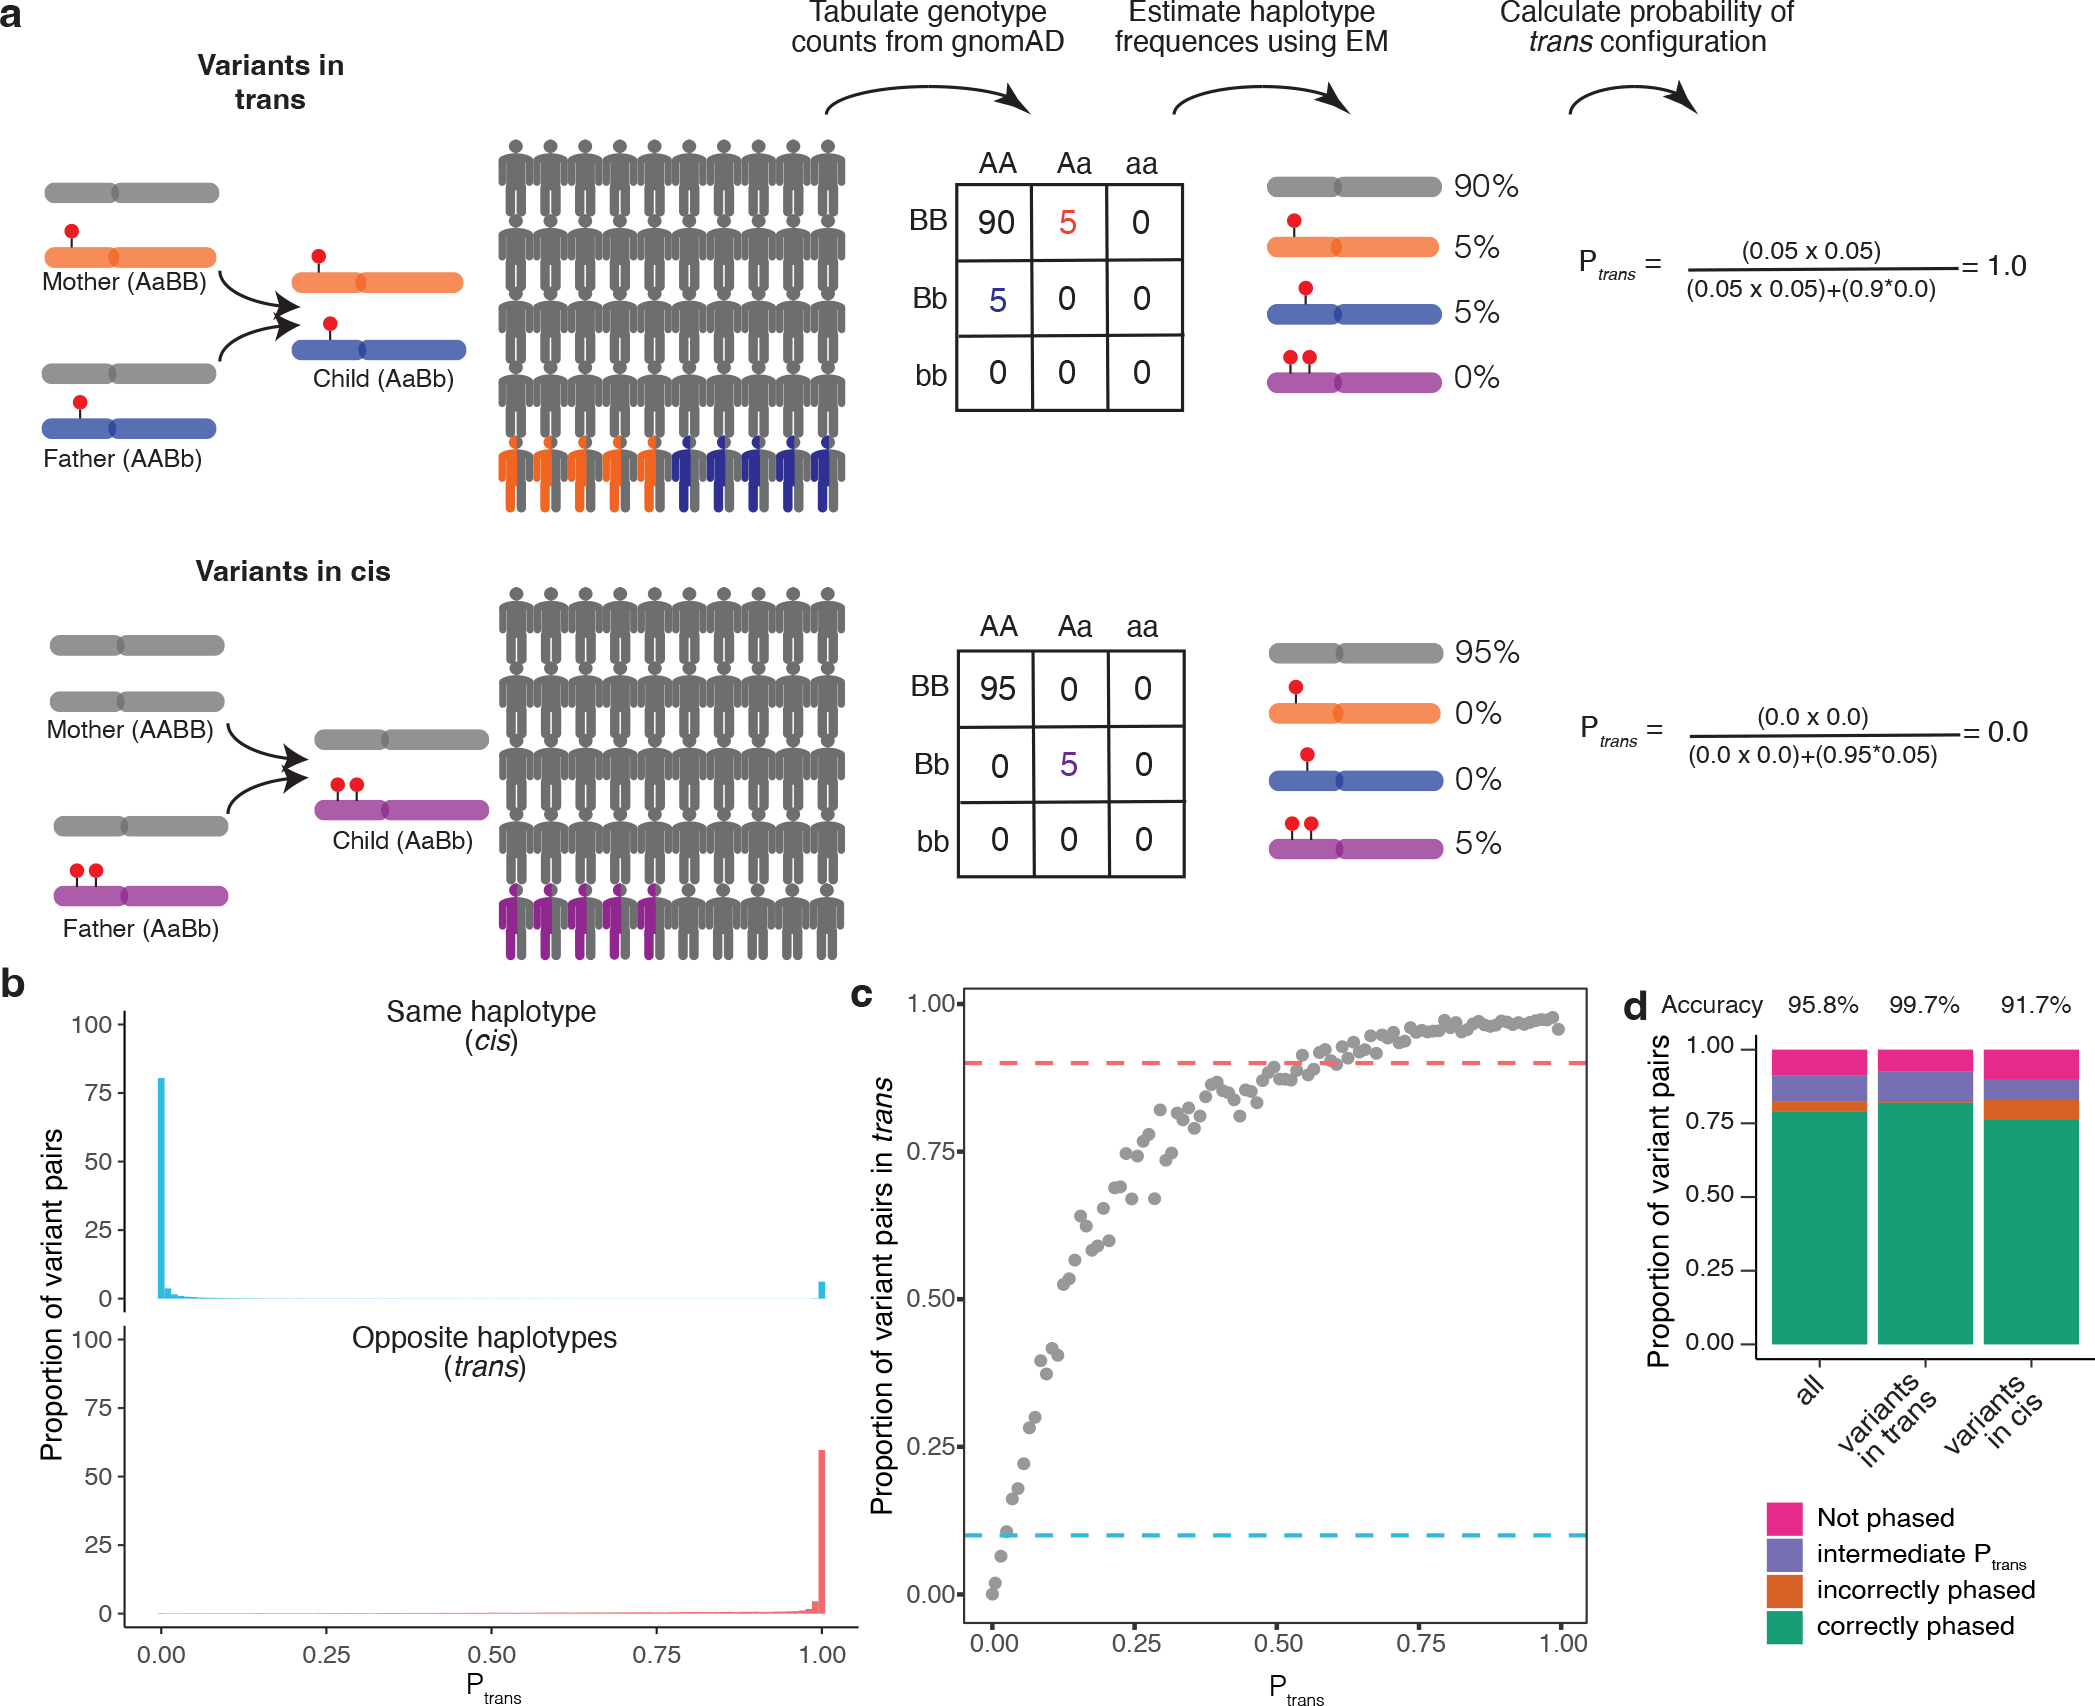
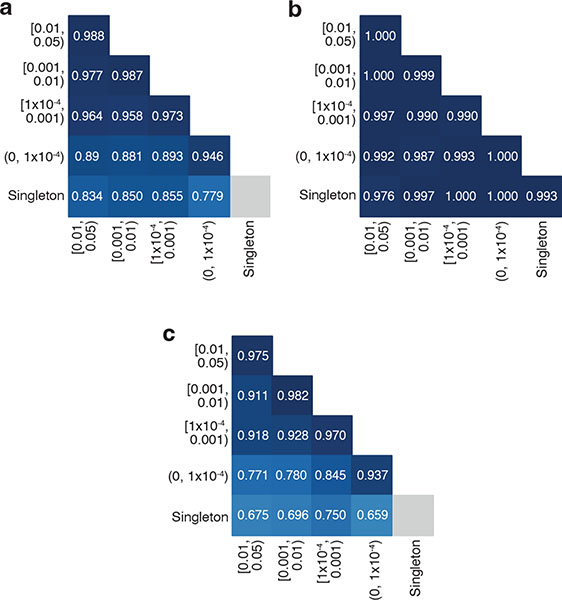
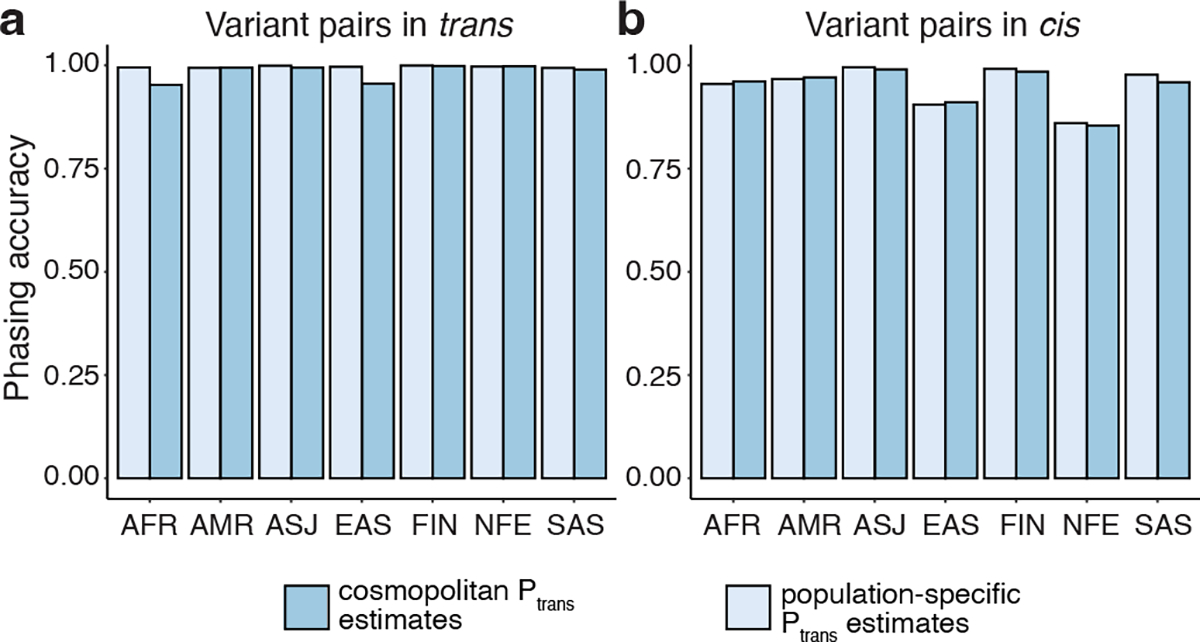
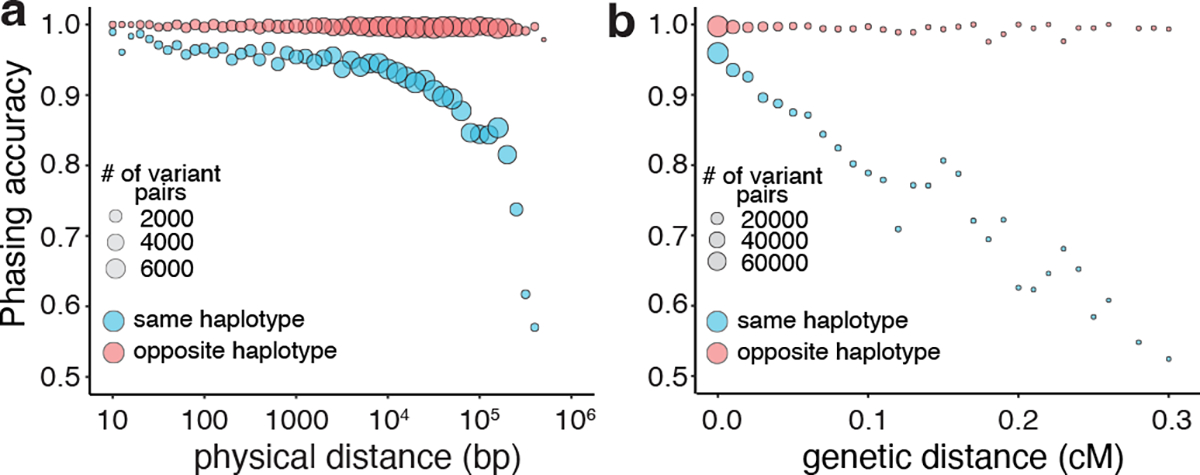
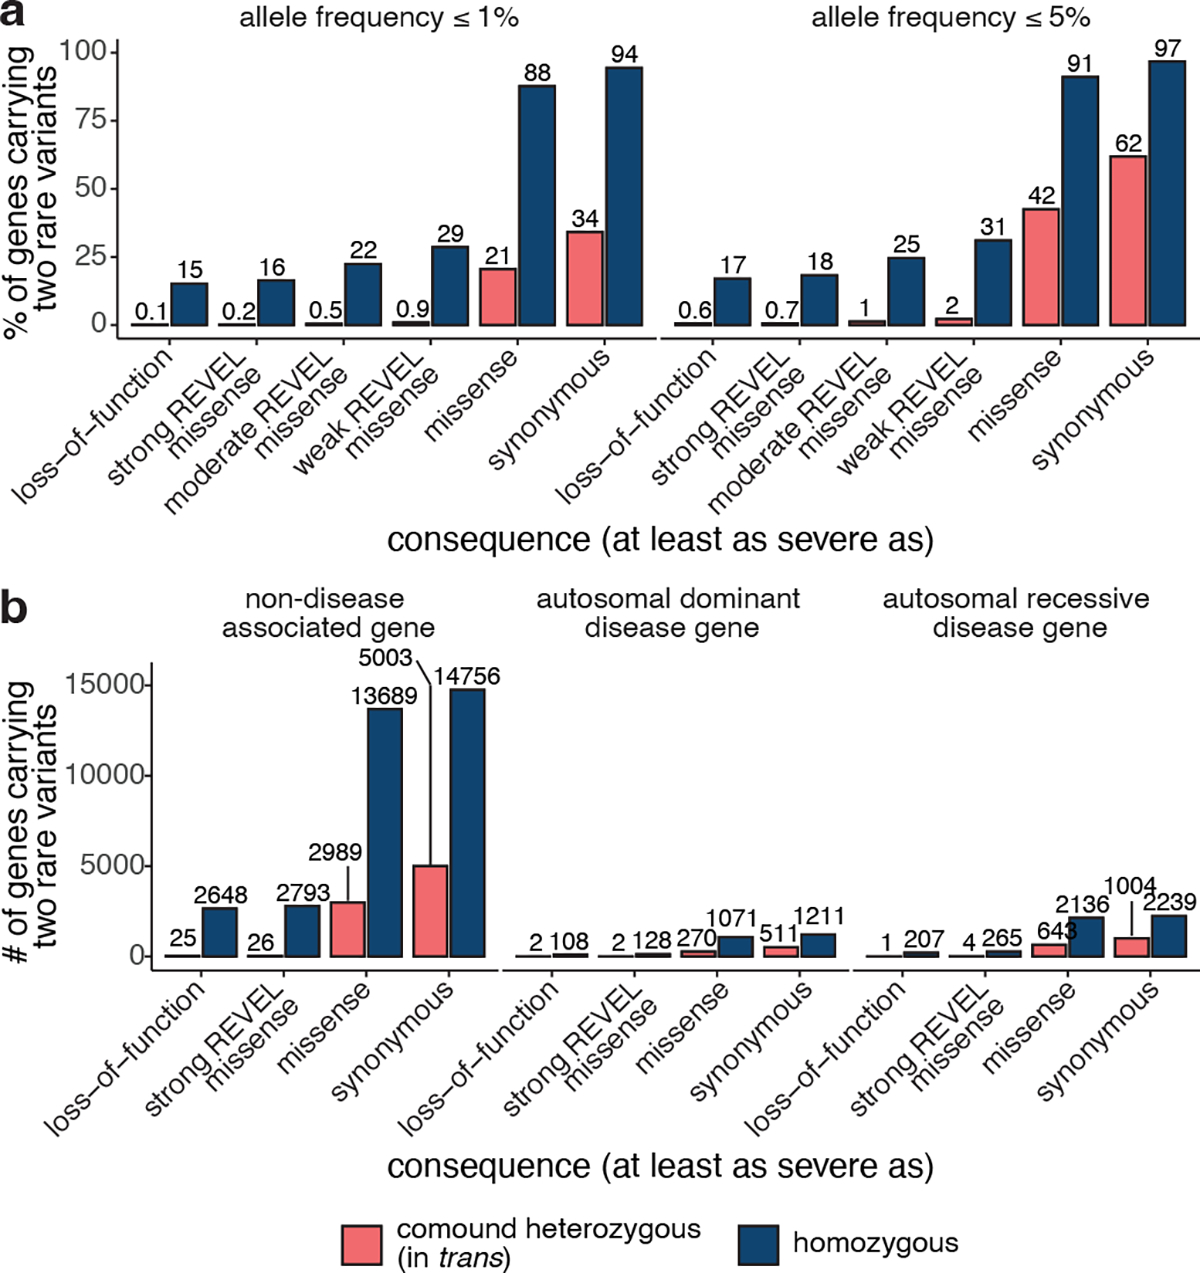
Recessive diseases arise when both copies of a gene are impacted by a damaging genetic variant. When a patient carries two potentially causal variants in a gene, accurate diagnosis requires determining that these variants occur on different copies of the chromosome (that is, are in trans) rather than on the same copy (that is, in cis). However, current approaches for determining phase, beyond parental testing, are limited in clinical settings. Here we developed a strategy for inferring phase for rare variant pairs within genes, leveraging genotypes observed in the Genome Aggregation Database (v2, n = 125,748 exomes). Our approach estimates phase with 96% accuracy, both in trio data and in patients with Mendelian conditions and presumed causal compound heterozygous variants. We provide a public resource of phasing estimates for coding variants and counts per gene of rare variants in trans that can aid interpretation of rare co-occurring variants in the context of recessive disease.


Figures

Extended Data Fig. 1:
Extended Data Fig. 1:. Publicly available browser for sharing phasing data.
a, Sample gnomAD browser output for two variants (GRCh37 1–55505647-G-T and 1–55523855-G-A) in the gene PCSK9. On the top, a table subdivided by genetic ancestry group displays how many individuals in gnomAD v2 from that genetic ancestry are consistent with the two variants occurring on different haplotypes (trans), and how many individuals are consistent with their occurring on the same haplotype (cis). Below that, there is a 3×3 table that contains the 9 possible combinations of genotypes for the two variants of interest. The number of individuals in gnomAD v2 that fall in each of these combinations are shown and are colored by whether they are consistent with variants falling on different haplotypes (red) or the same haplotype (blue), or whether they are indeterminate (purple). The estimated haplotype counts for the four possible haplotypes for the two variants as calculated by the EM algorithm is displayed on the bottom right. The probability of being in trans for this particular pair of variants is >99%. b, Variant co-occurrence tables on the gene landing page. For each gene (GBA1 shown), the top table lists the number of individuals carrying pairs of rare heterozygous variants by inferred phase, allele frequency (AF), and predicted functional consequence. The number of individuals with homozygous variants are tabulated in the same manner and presented as a comparison below. AF thresholds of ≤ 5%, ≤ 1%, and ≤ 0.5% are displayed across six predicted functional consequences (combinations of pLoF, various evidence strengths of predicted pathogenicity for missense variants, and synonymous variants). Both variants in the variant pair must be annotated with a consequence at least as severe as the consequence listed (that is, pLoF + strong missense also includes pLoF + pLoF).
Fig. 1:
Fig. 1:. Overview of phasing approach using Expectation-Maximization method in gnomAD.
a, Schematic of phasing approach. b, Histogram of Ptrans scores for variant pairs in cis (top, blue) and in trans (bottom, red). c, Proportion of variant pairs in each Ptrans bin that are in trans. Each point represents variant pairs with Ptrans bin size of 0.01. Blue dashed line at 10% indicates the Ptrans threshold at which ≥ 90% of variant pairs in bin are on the same haplotype (Ptrans0.02). Red dashed line at 90% indicates the Ptrans threshold at which ≥ 90% of variant pairs in bin are on opposite haplotypes (Ptrans0.55). Calculations are performed using variant pairs with population AF ≥ 1×10⁻⁴. d, Performance of Ptrans for distinguishing variant pairs in cis and trans. Accuracy is calculated as the proportion of variant pairs correctly phased (green bars) divided by the proportion of variant pairs phased using Ptrans (orange plus green bars). b-d, Ptrans scores are population-specific.
Fig. 2:
Fig. 2:. Phasing accuracy as a function of variant allele frequency (AF).
Phasing accuracy at different AF bins for all variant pairs (a), variant pairs in trans (b), and variant pairs in cis (c). Shading of squares and numbers in each square represent the phasing accuracy. Y-axis labels refer to the more frequent variant in each variant pair and X-axis labels refer to the rarer variant in each variant pair. Accuracy is the proportion of correct classifications (i.e., correct classifications / all classifications) and is calculated for all unique variant pairs seen in the trio data across all genetic ancestry groups using population-specific Ptrans calculations.
Fig. 3:
Fig. 3:. Phasing accuracy using population-specific versus cosmopolitan Ptrans estimates.
Population-specific Ptrans estimates are shown in light blue and cosmopolitan Ptrans estimates are shown in medium blue. Accuracies are shown separately for variants in trans (a, left) and variants in cis (b, right).
Fig. 4:
Fig. 4:. Phasing accuracy as a function of distance between variant pairs.
a, Phasing accuracy (y-axis) as a function of physical distance (in base pairs on log10 scale) between variants (x-axis). Blue represents variants on the same haplotype (in cis), and red represents variants on opposite haplotypes (in trans). b, Same as a, except the x-axis shows genetic distance (in centiMorgans). Accuracies for a and b are calculated based on unique variant pairs observed across all genetic ancestry groups using population-specific Ptrans estimates.
Fig. 5:
Fig. 5:. Counts of genes with variants in trans in gnomAD.
a, Proportion of genes with one or more individuals in gnomAD carrying predicted compound heterozygous (in trans) variants or a homozygous variant at ≤ 1% and ≤ 5% AF stratified by predicted functional consequence. b, Number of genes with ≥ 1 individual in gnomAD carrying compound heterozygous (in trans) or homozygous predicted damaging variants at ≤ 1% AF, stratified by predicted functional consequence and Mendelian disease-association in the Online Mendelian Inheritance in Man database. In total, 28 genes (25 non-disease, 2 autosomal dominant, and 1 autosomal recessive) carried predicted compound heterozygous loss-of-function variants at ≤ 1% AF, only seven of which were high confidence “human knock-out” events following manual curation. For predicted compound heterozygous variants, both variants in the variant pair must be annotated with a consequence at least as severe as the consequence listed (i.e., a compound heterozygous loss-of-function variant would be counted under the pLoF category but also included with a less deleterious variant under the other categories). All homozygous pLoF variants previously underwent manual curation as part of Karczewski et al.

Update of

References

    1. Wang Q et al. Landscape of multi-nucleotide variants in 125,748 human exomes and 15,708 genomes. Nat. Commun. 11, 2539 (2020). - PMC - PubMed
    1. Bansal V, Halpern AL, Axelrod N & Bafna V An MCMC algorithm for haplotype assembly from whole-genome sequence data. Genome Res. 18, 1336–1346 (2008). - PMC - PubMed
    1. Patterson M et al. WhatsHap: Weighted Haplotype Assembly for Future-Generation Sequencing Reads. J. Comput. Biol. 22, 498–509 (2015). - PubMed
    1. Hager P, Mewes H-W, Rohlfs M, Klein C & Jeske T SmartPhase: Accurate and fast phasing of heterozygous variant pairs for genetic diagnosis of rare diseases. PLoS Comput. Biol. 16, e1007613 (2020). - PMC - PubMed
    1. Maestri S et al. A Long-Read Sequencing Approach for Direct Haplotype Phasing in Clinical Settings. Int. J. Mol. Sci. 21, (2020). - PMC - PubMed

Methods-only references

    1. Van der Auwera GA et al. From FastQ data to high confidence variant calls: the Genome Analysis Toolkit best practices pipeline. Curr. Protoc. Bioinformatics 43, 11.10.1–11.10.33 (2013). - PMC - PubMed
    1. Hail Team. Hail 0.2.105-acd89e80c345. GitHub; https://github.com/hail-is/hail/commit/acd89e80c345.
    1. Choi Y, Chan AP, Kirkness E, Telenti A & Schork NJ Comparison of phasing strategies for whole human genomes. PLoS Genet. 14, e1007308 (2018). - PMC - PubMed
    1. Roadmap Epigenomics Consortium et al. Integrative analysis of 111 reference human epigenomes. Nature 518, 317–330 (2015). - PMC - PubMed
    1. International HapMap Consortium et al. A second generation human haplotype map of over 3.1 million SNPs. Nature 449, 851–861 (2007). - PMC - PubMed