. 2024 Jan;25(1):166-177.
doi: 10.1038/s41590-023-01692-x. Epub 2023 Dec 6.

Repeated mRNA vaccination sequentially boosts SARS-CoV-2-specific CD8+ T cells in persons with previous COVID-19

Affiliations

Repeated mRNA vaccination sequentially boosts SARS-CoV-2-specific CD8+ T cells in persons with previous COVID-19

Emily S Ford et al. Nat Immunol. 2024 Jan.

Abstract

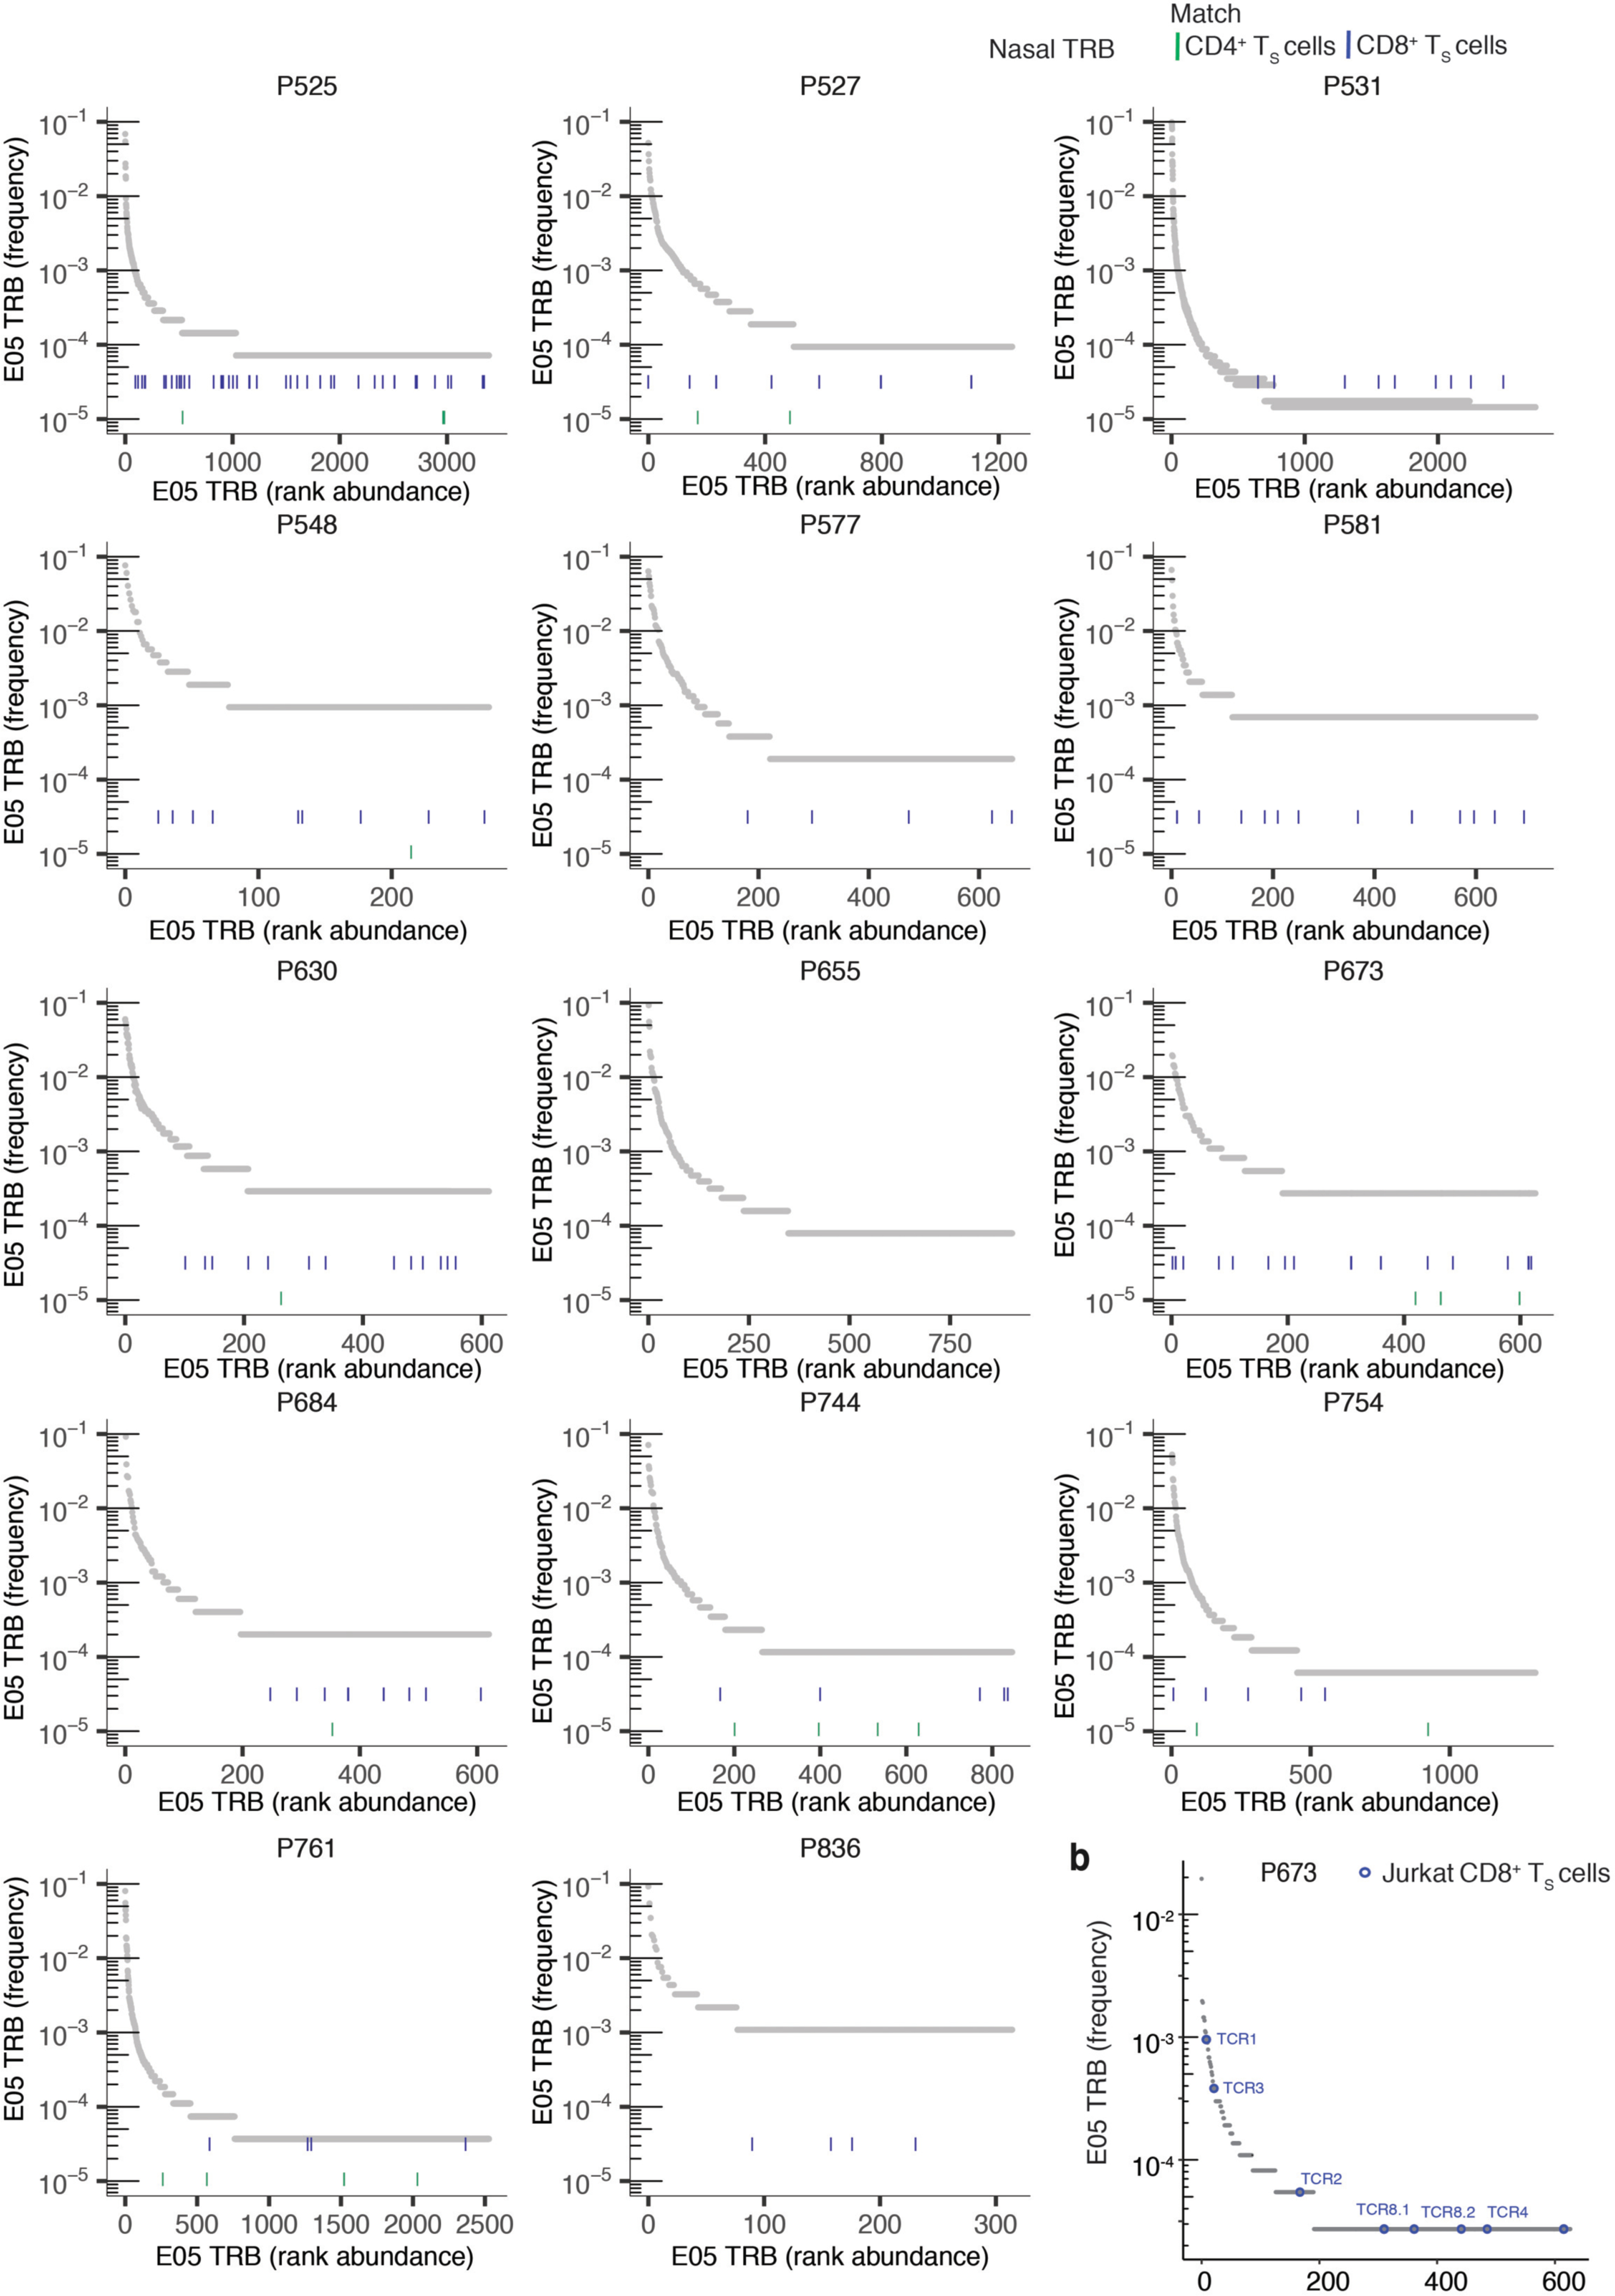
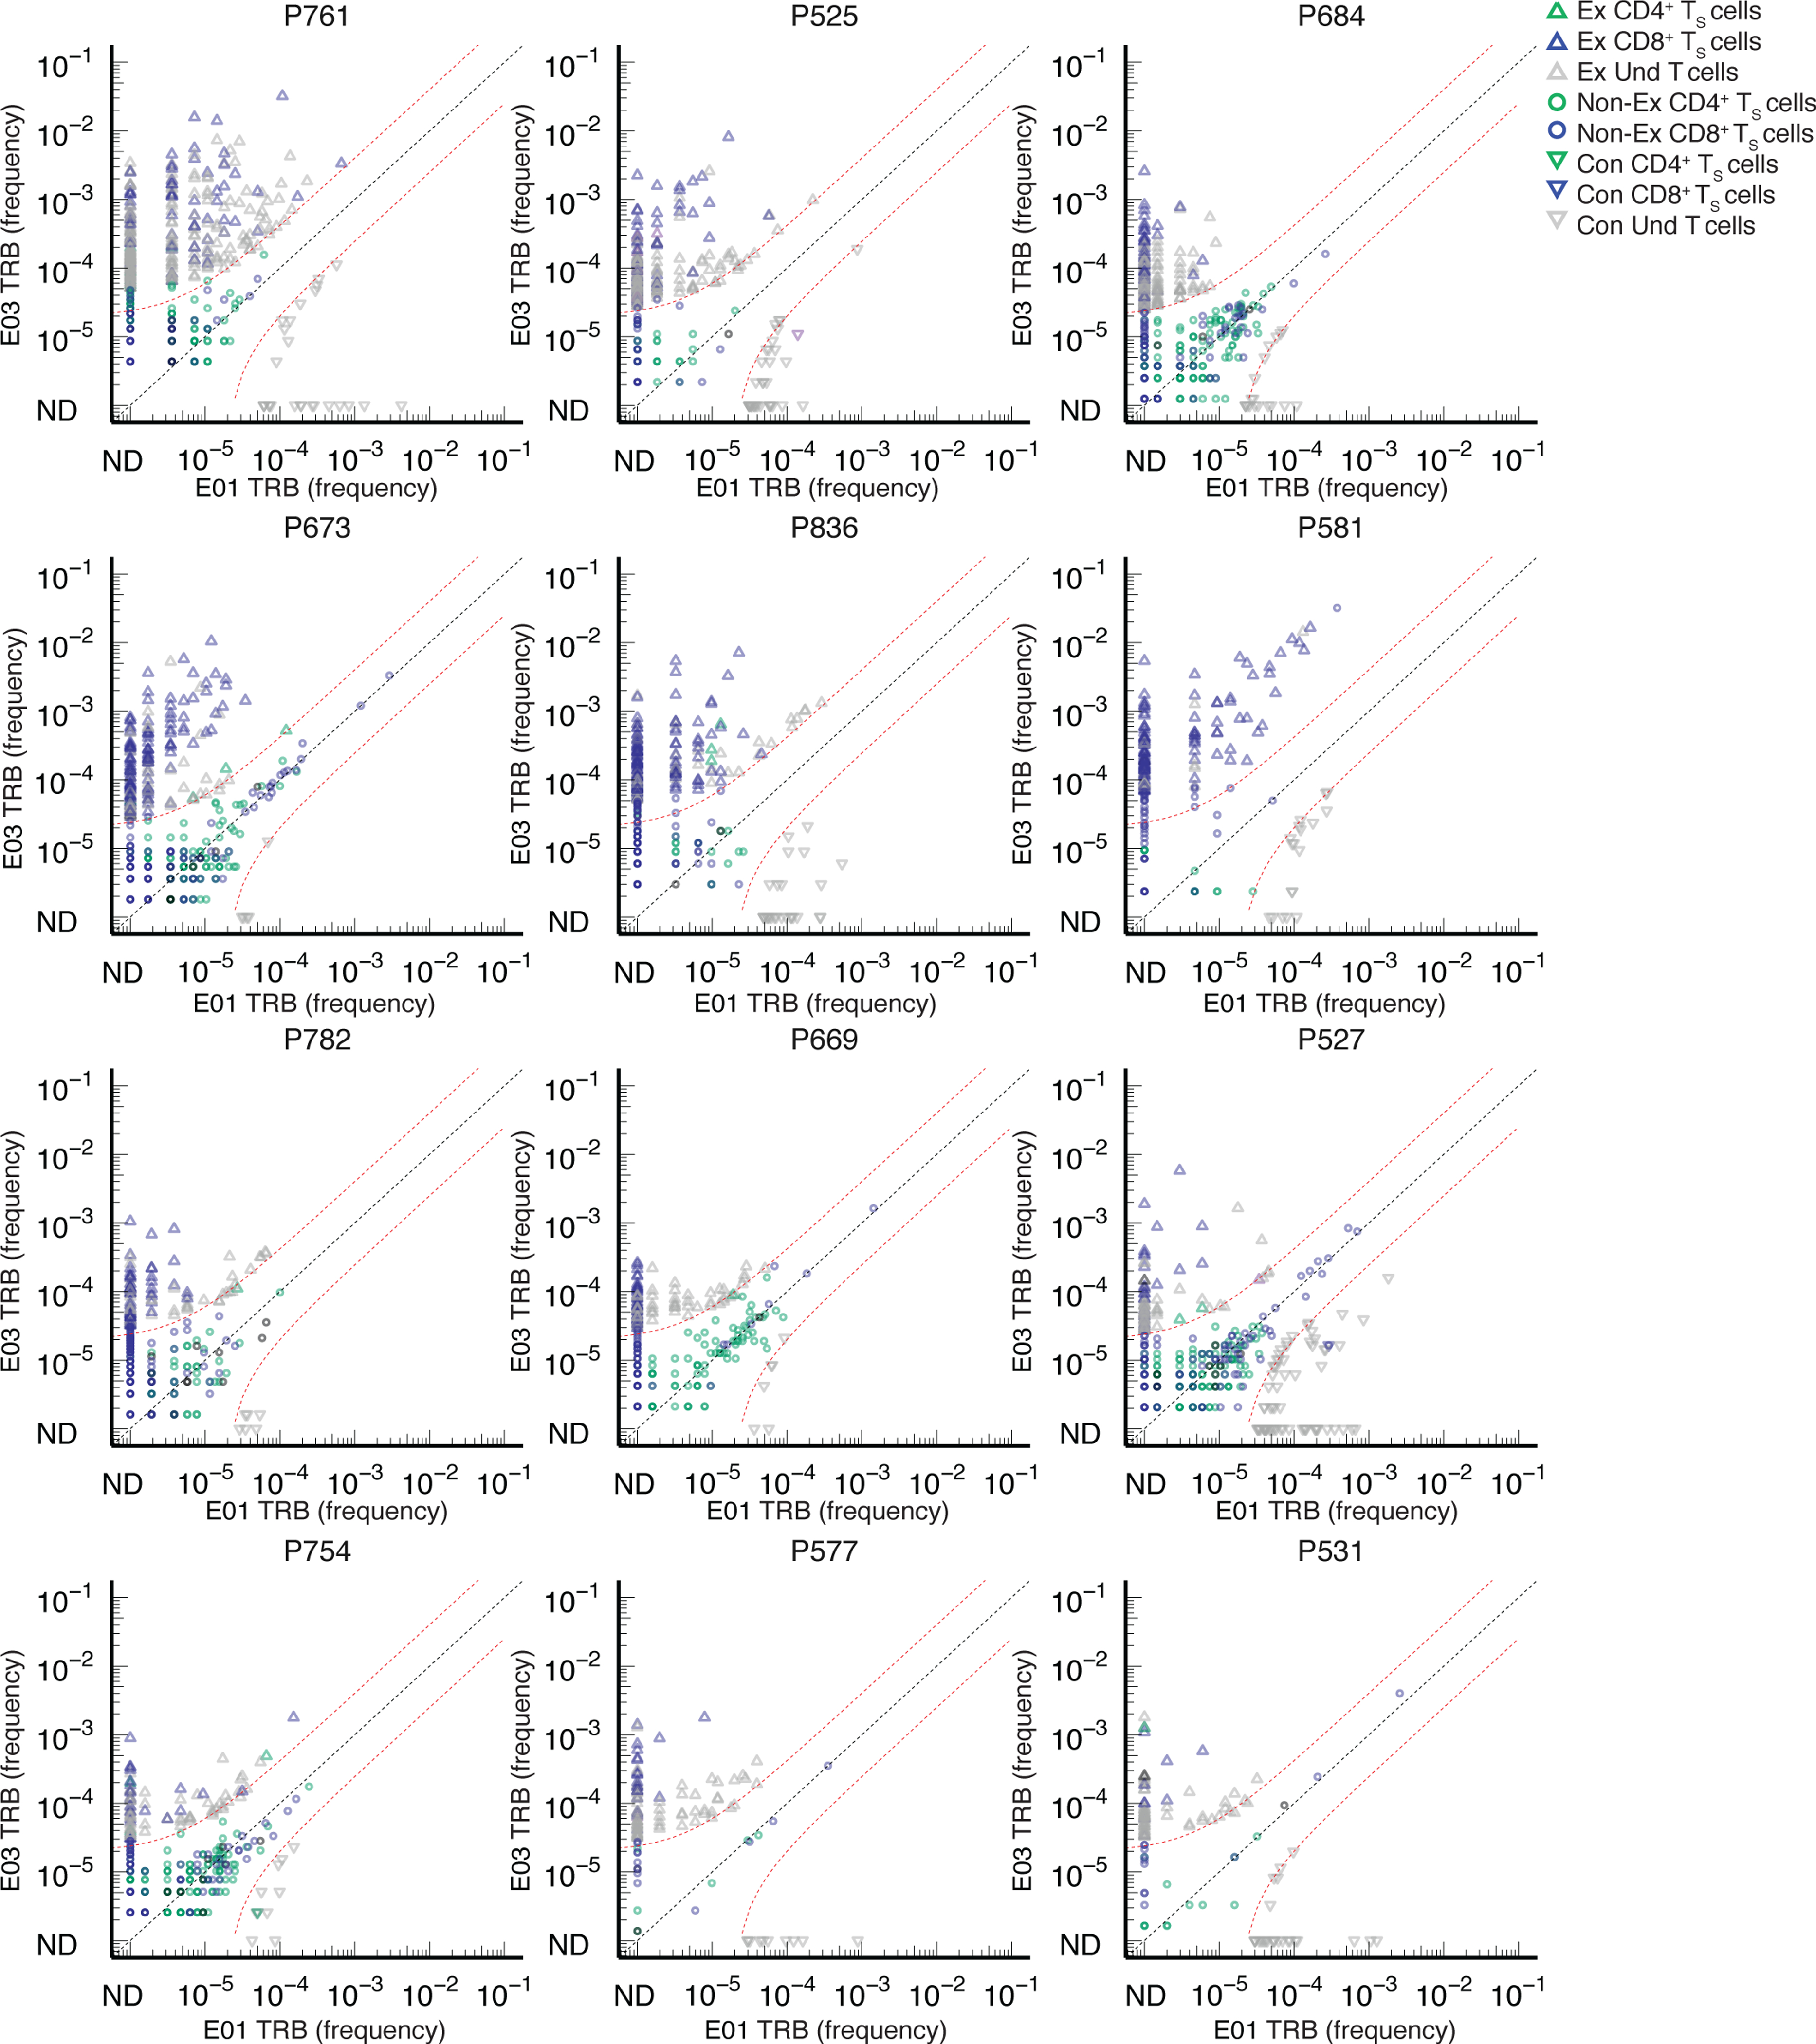
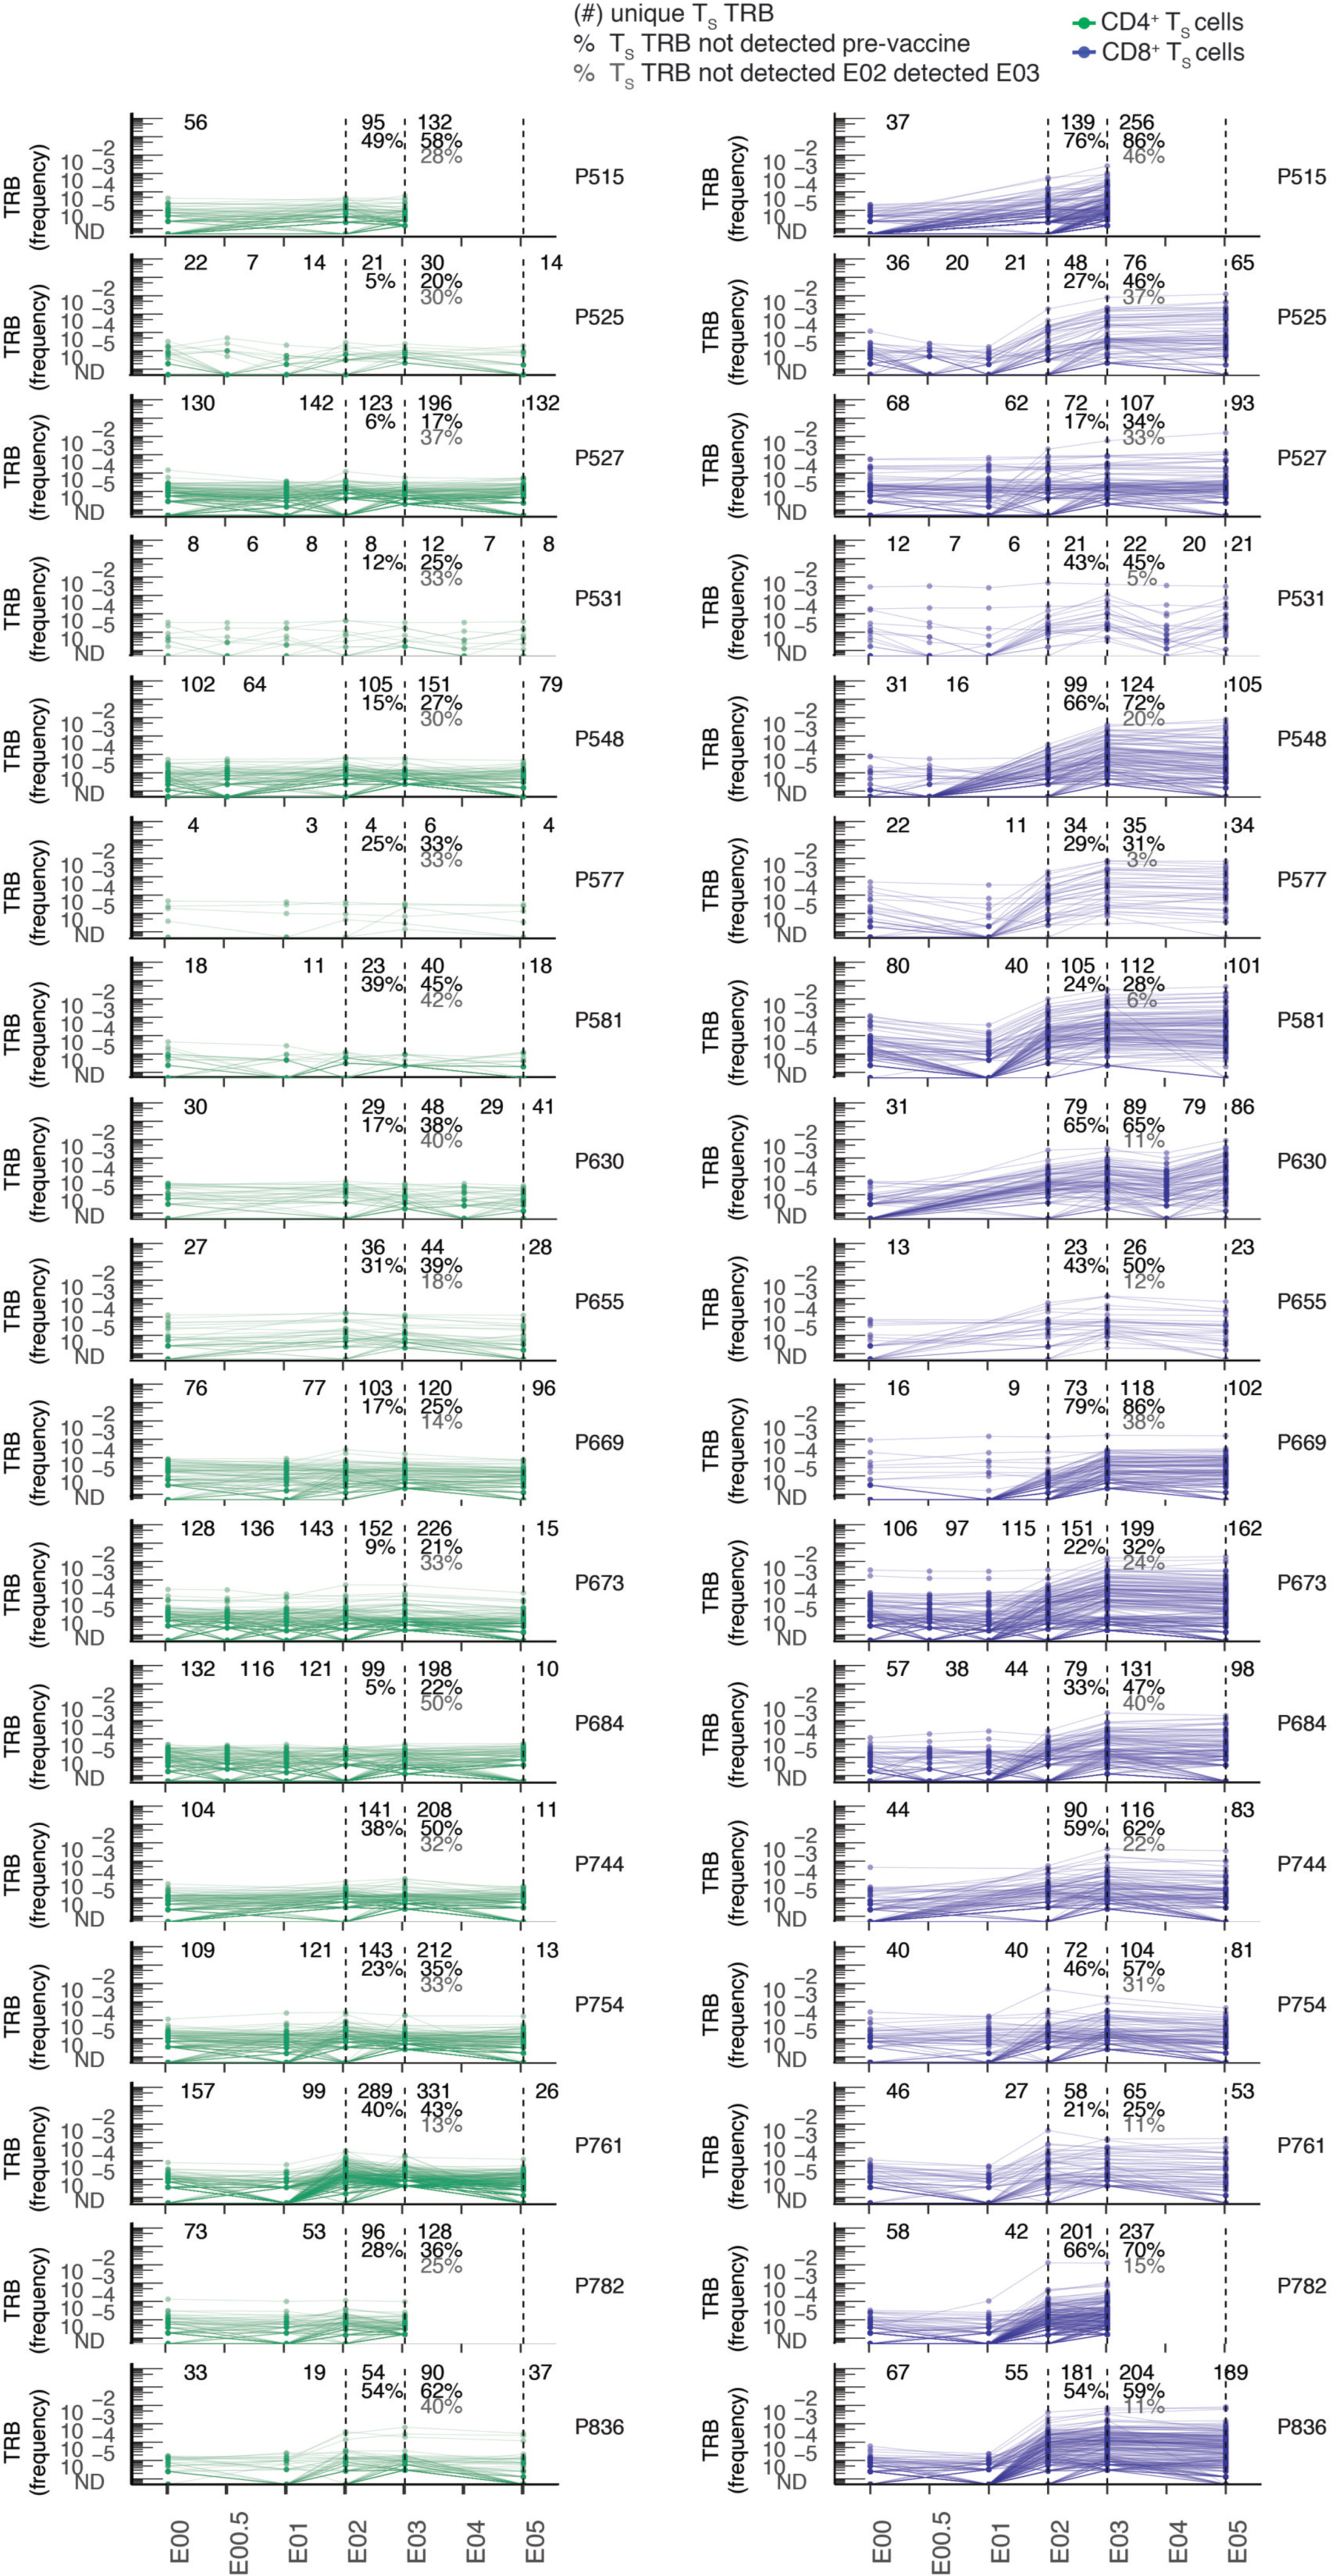
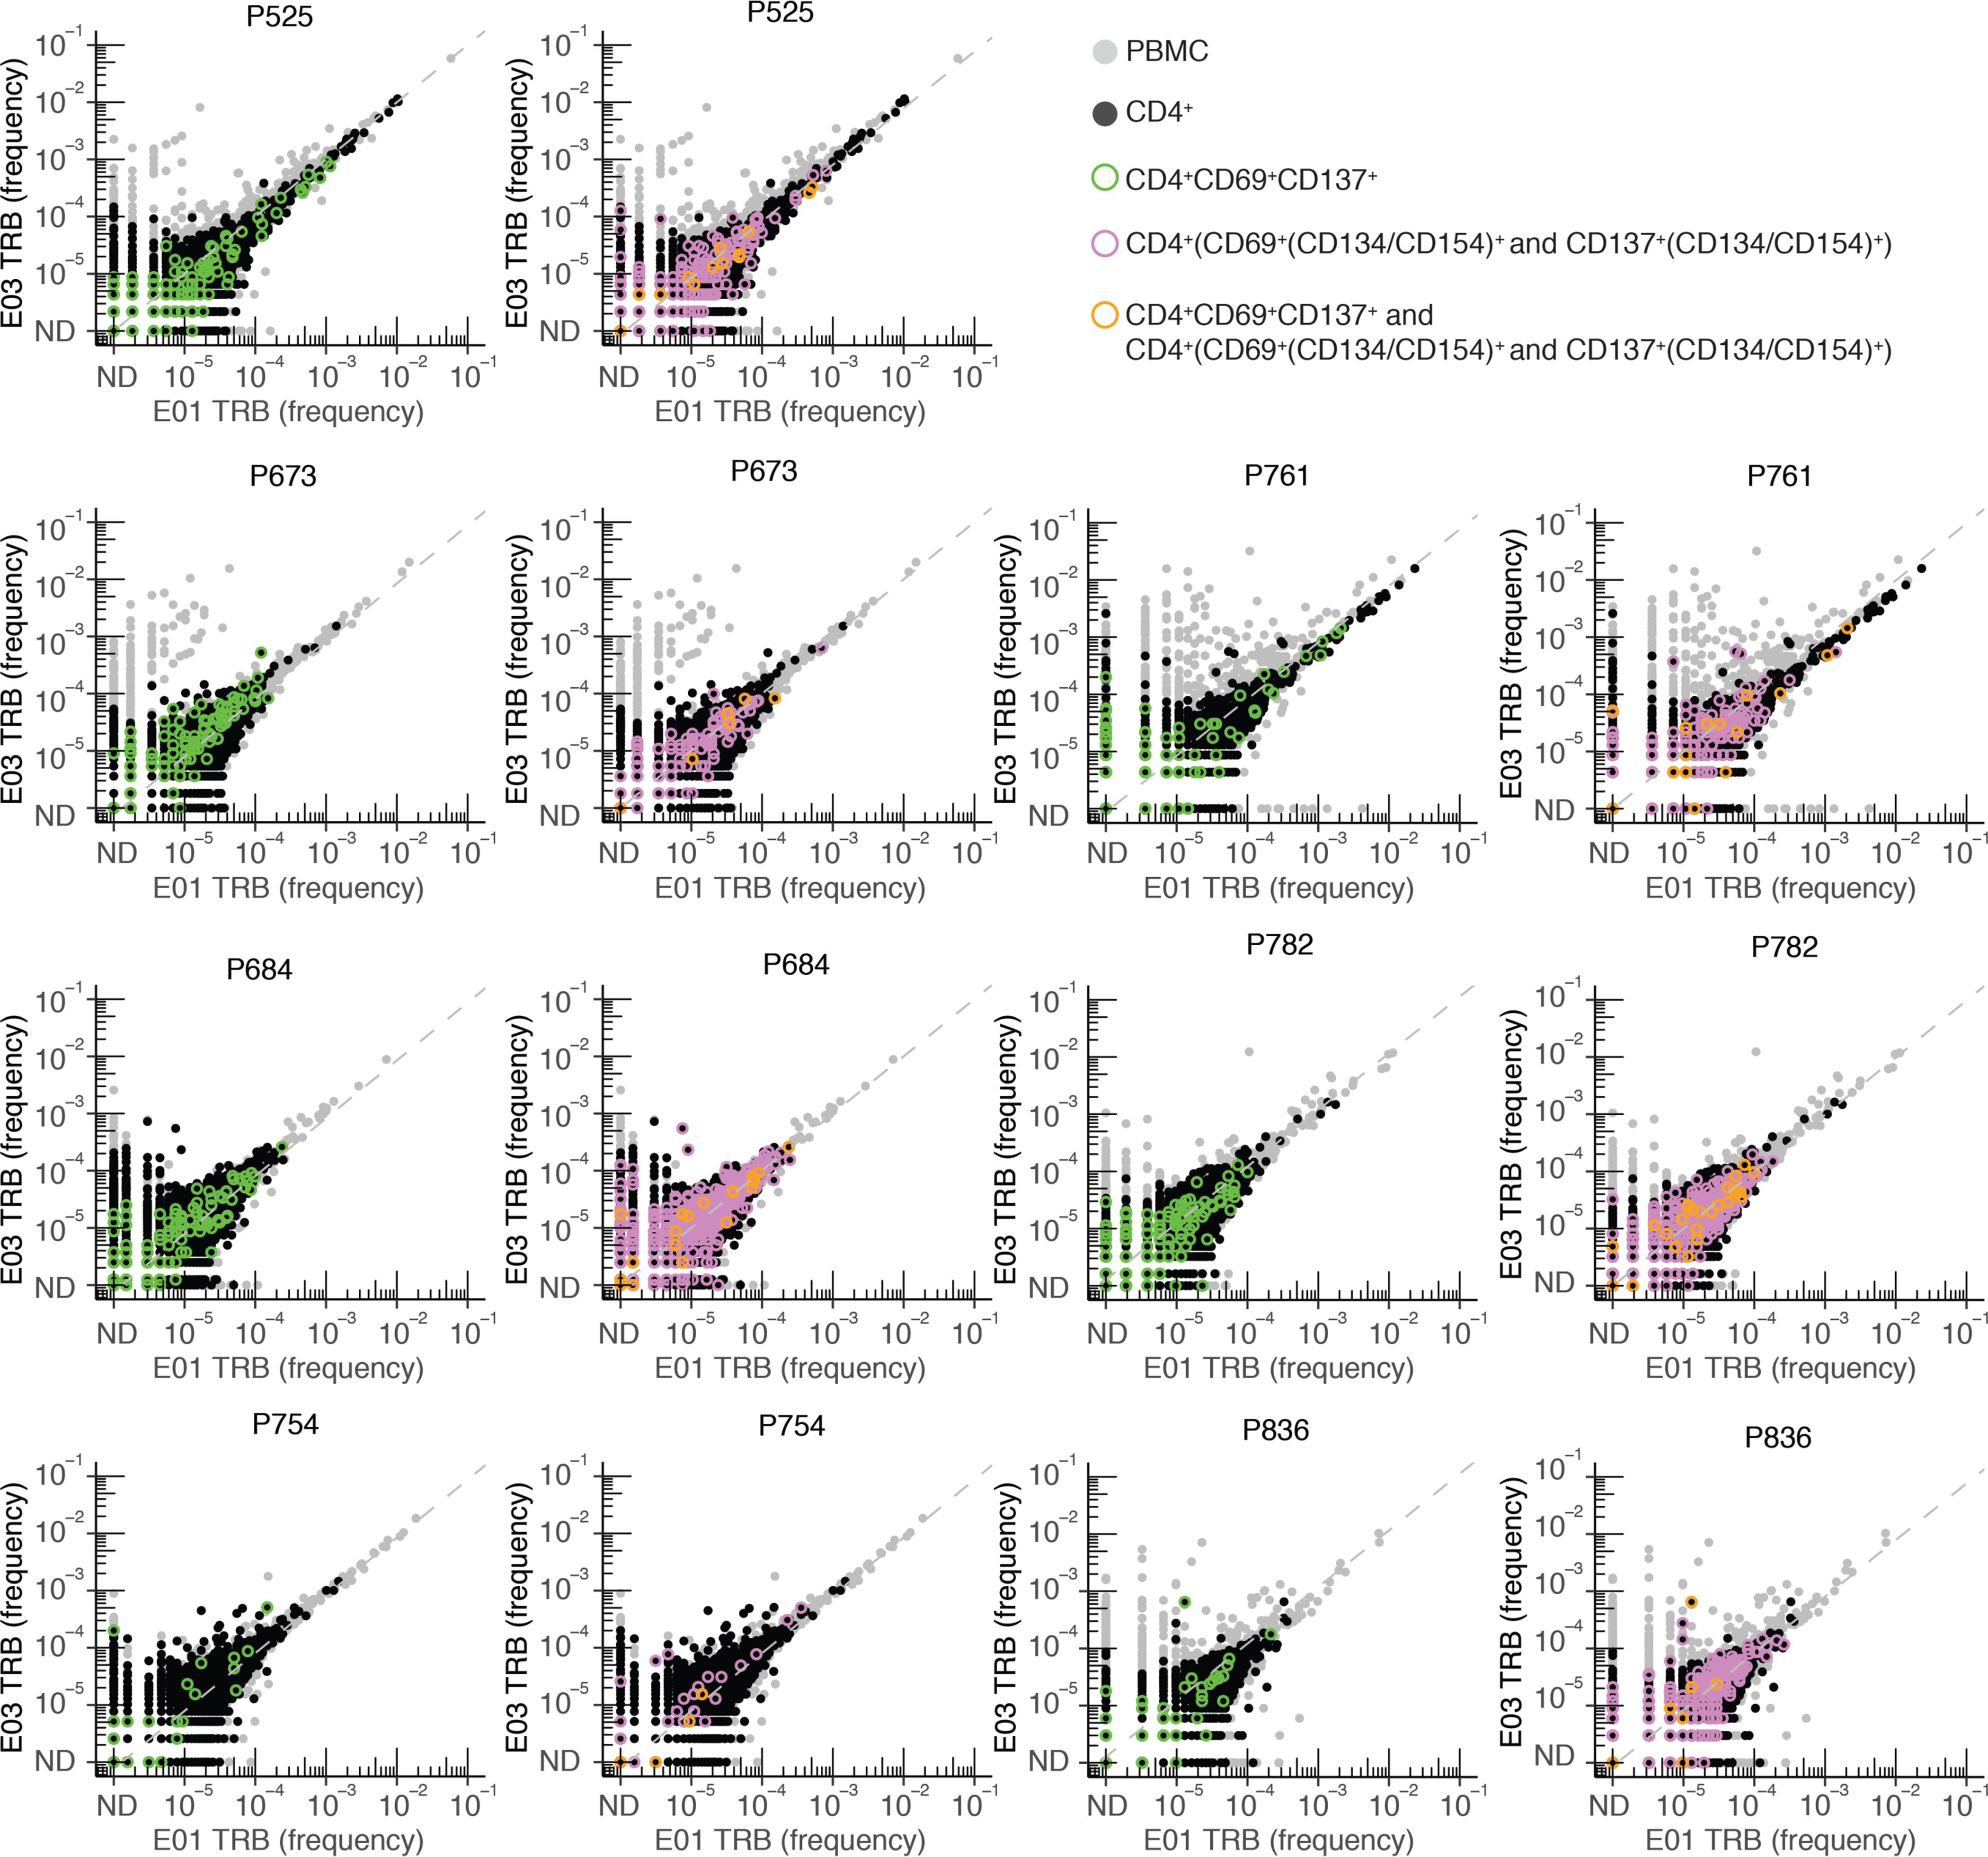
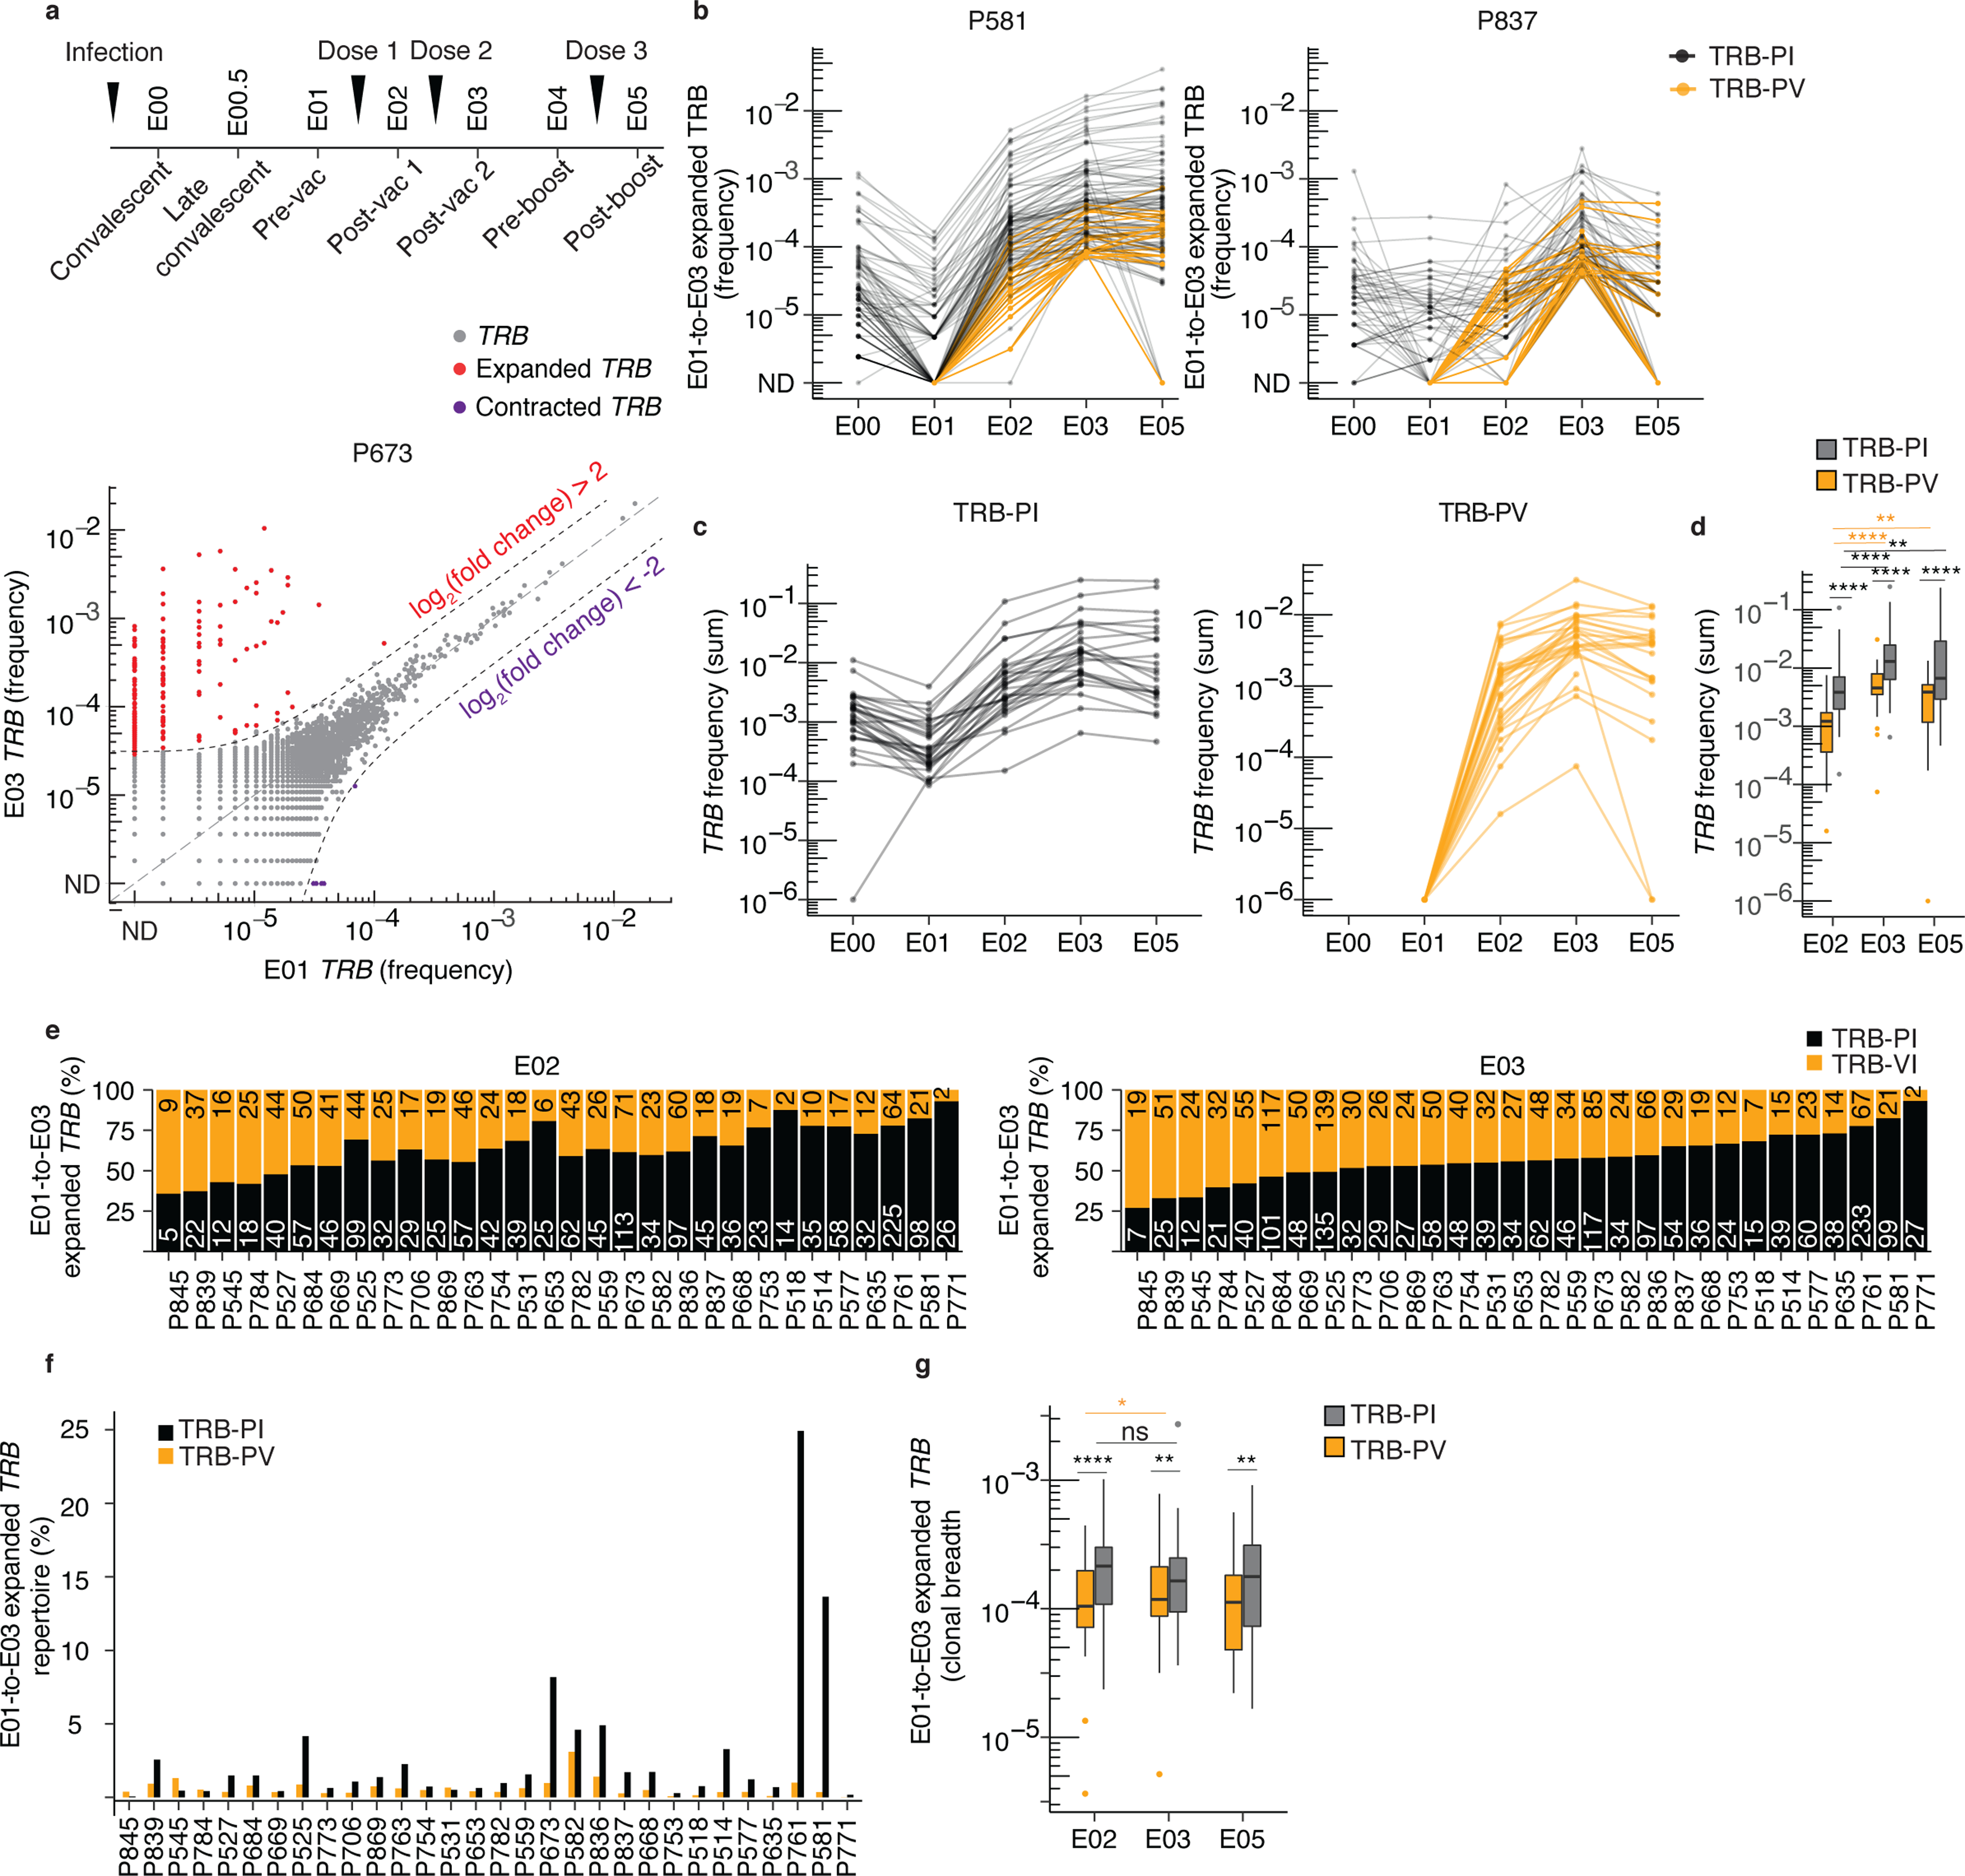
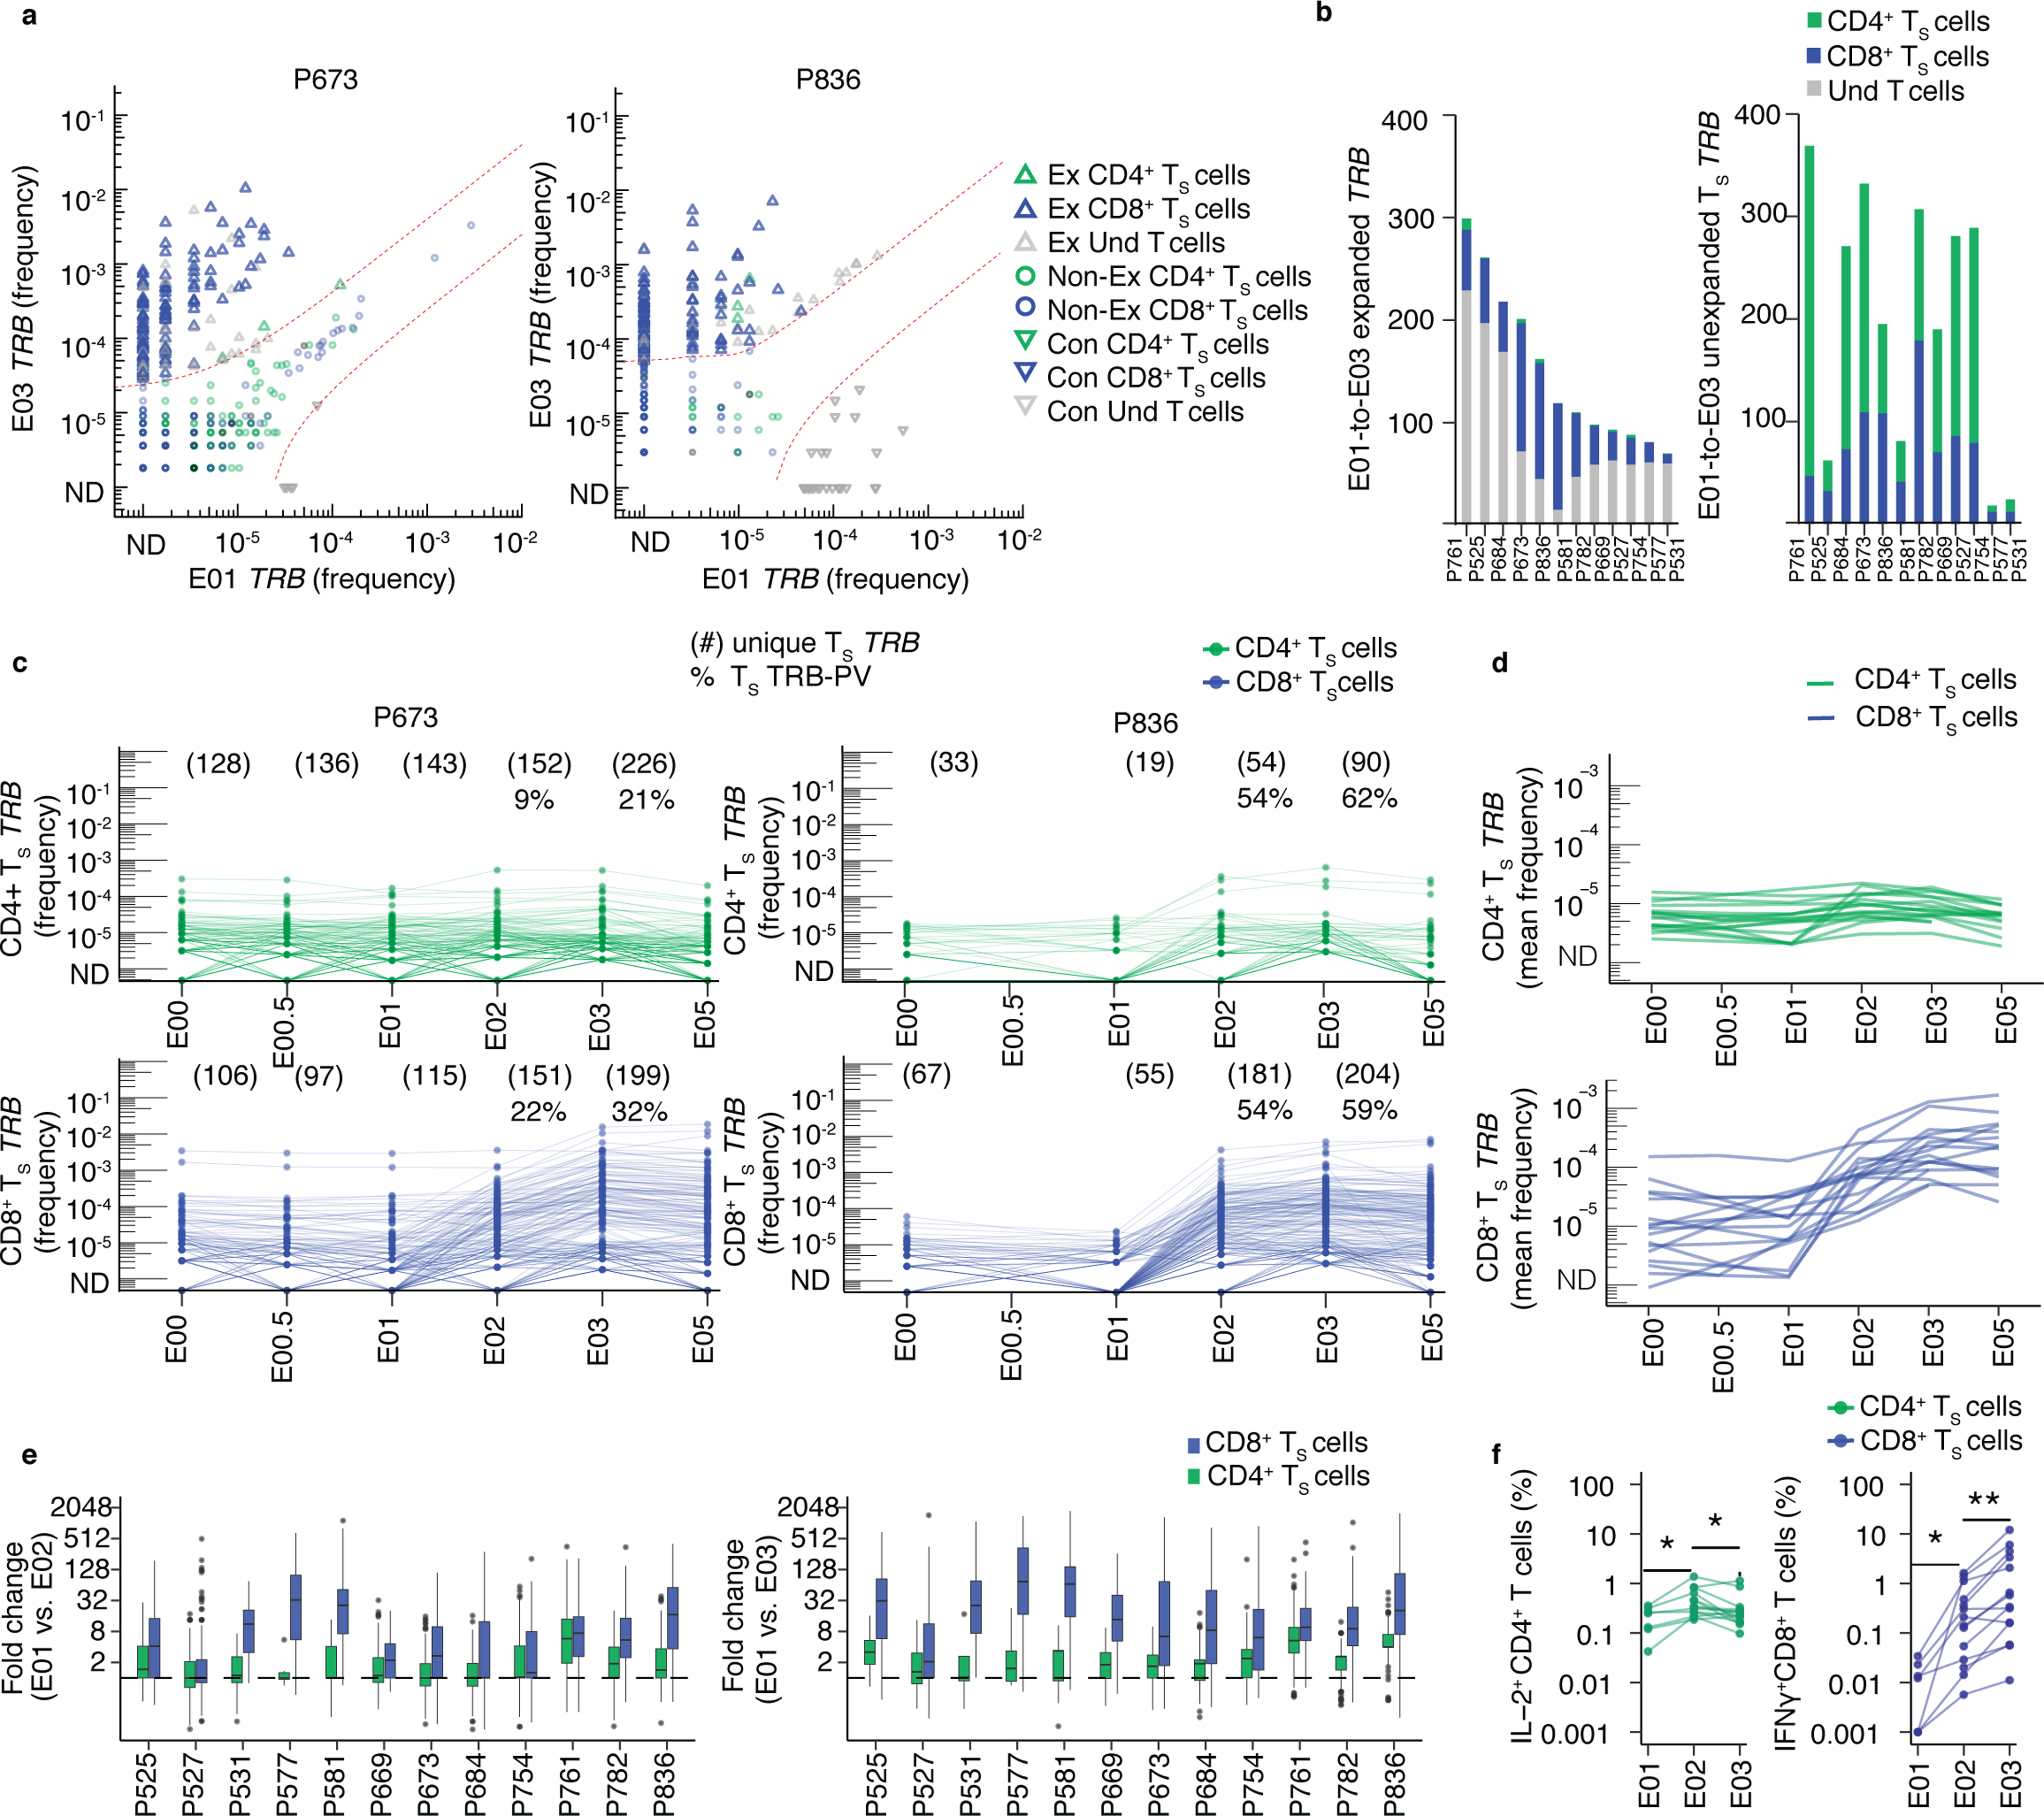
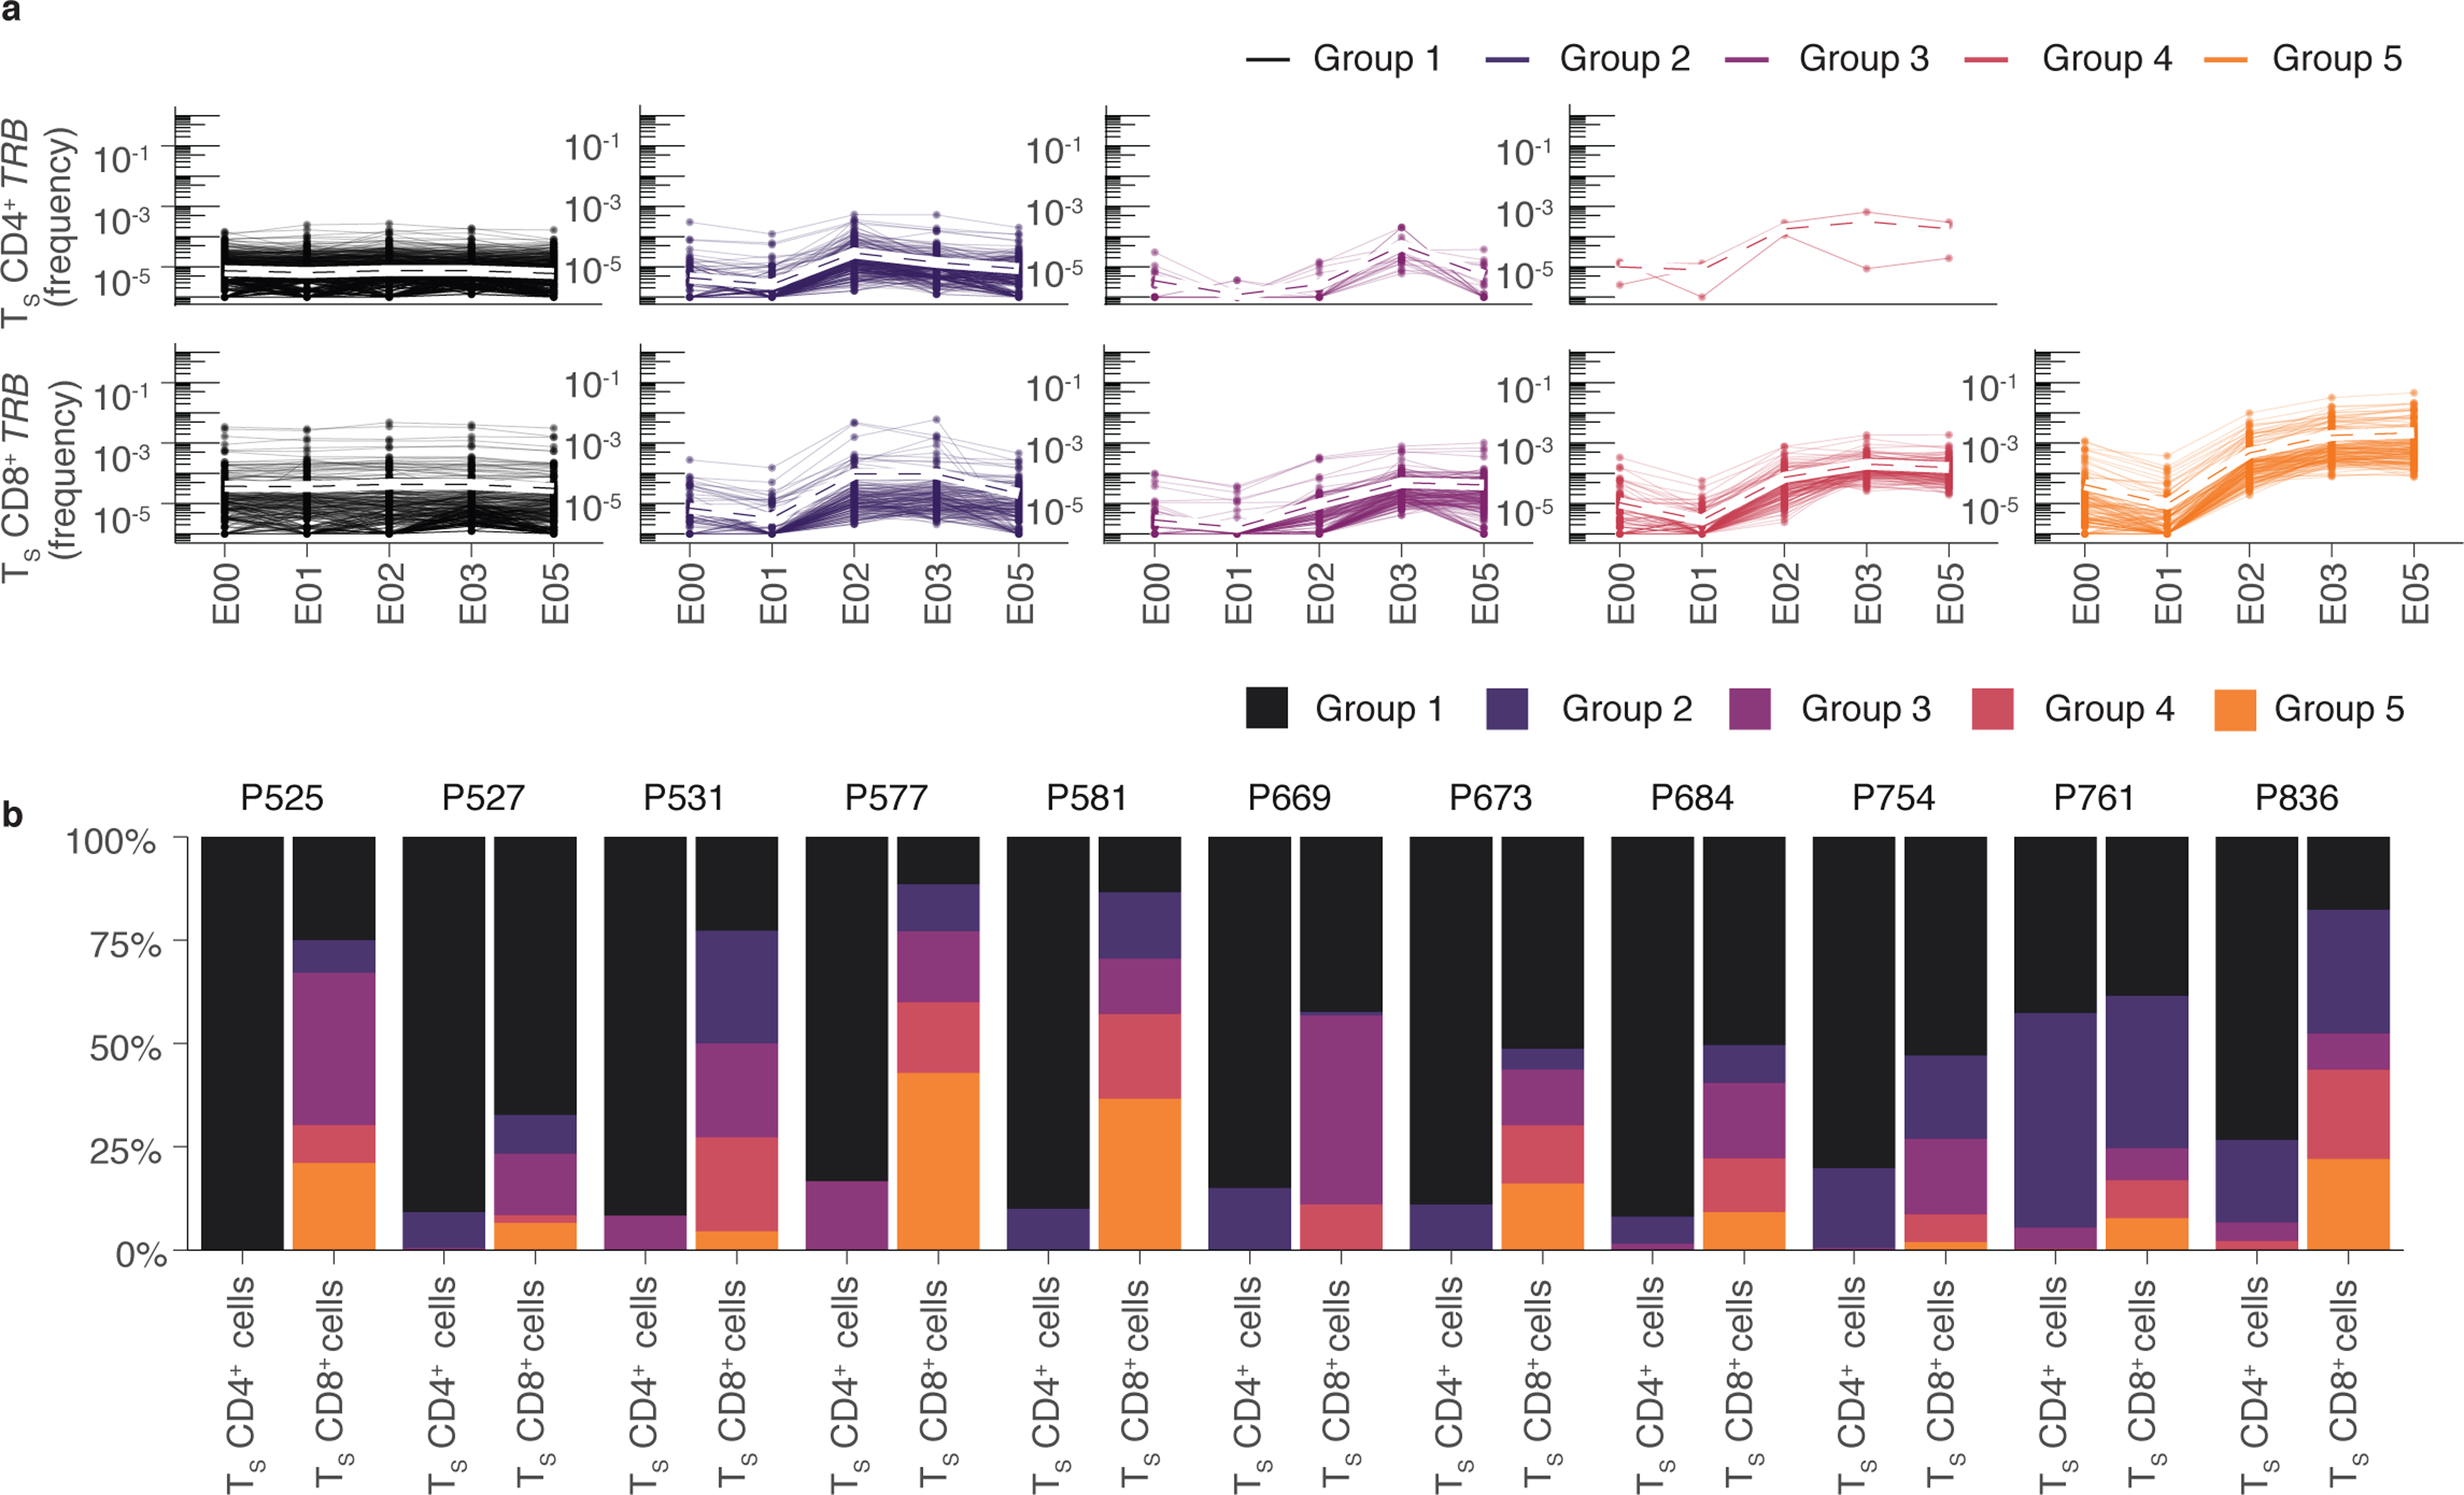
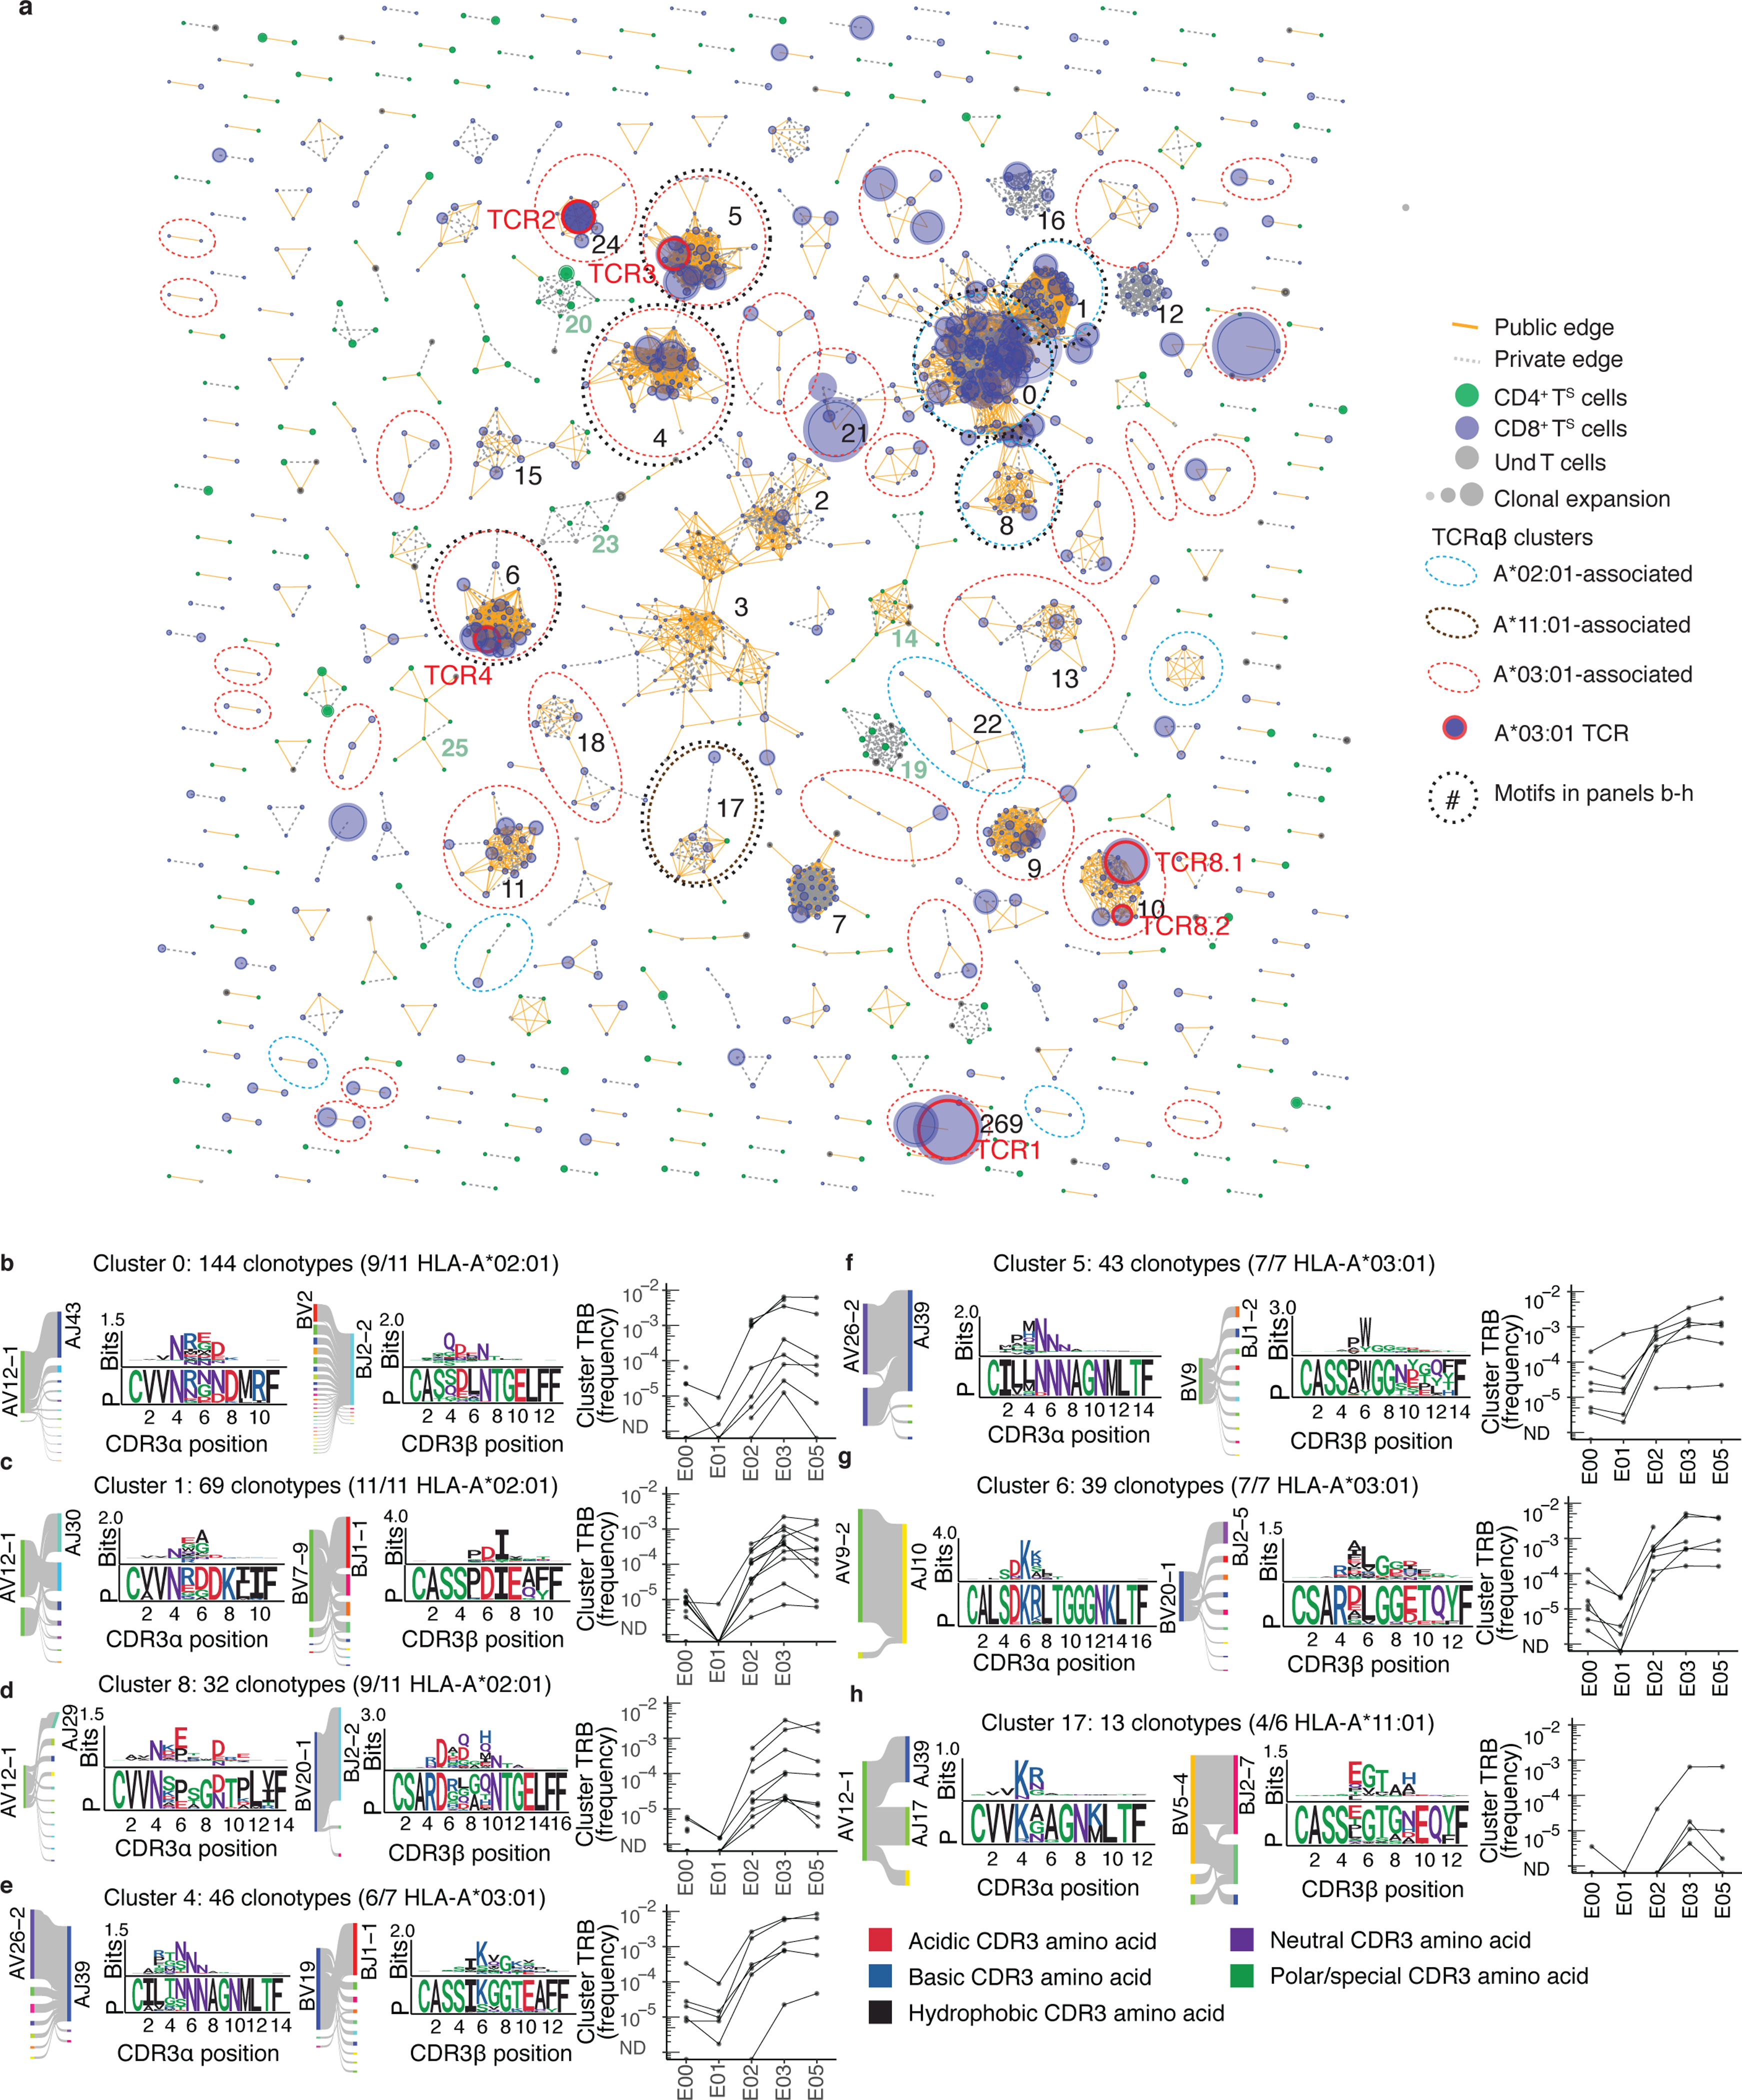
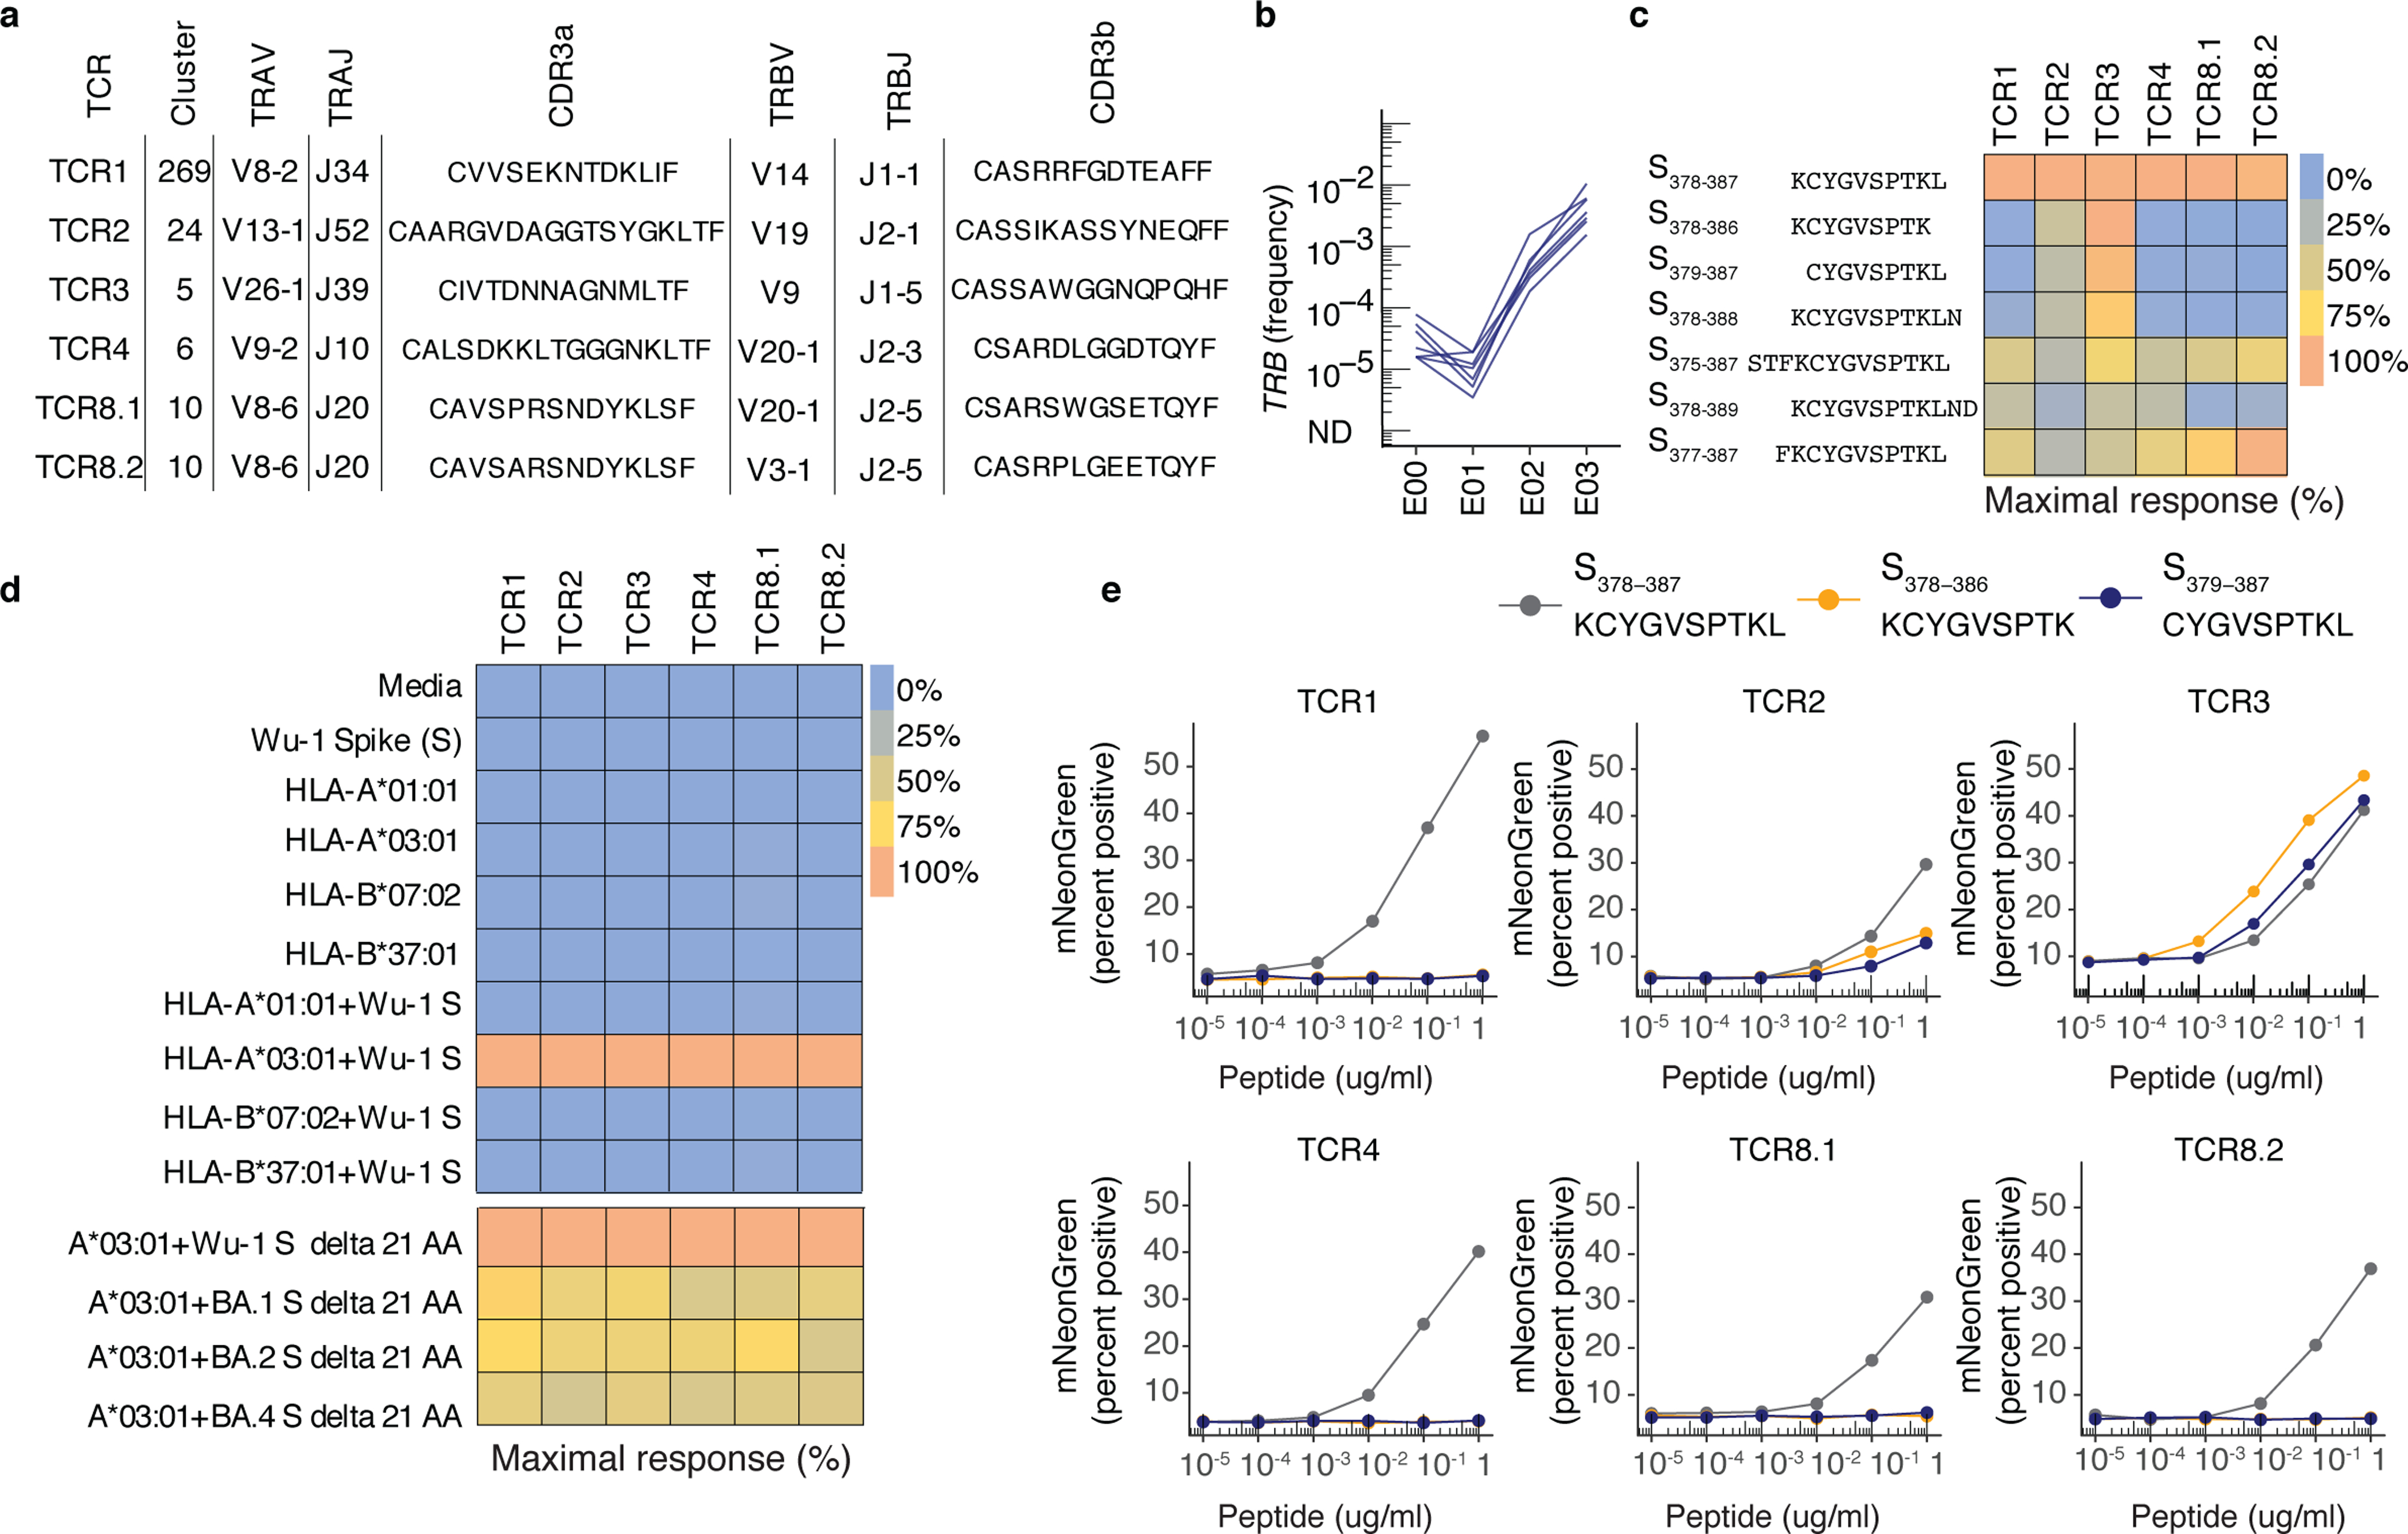
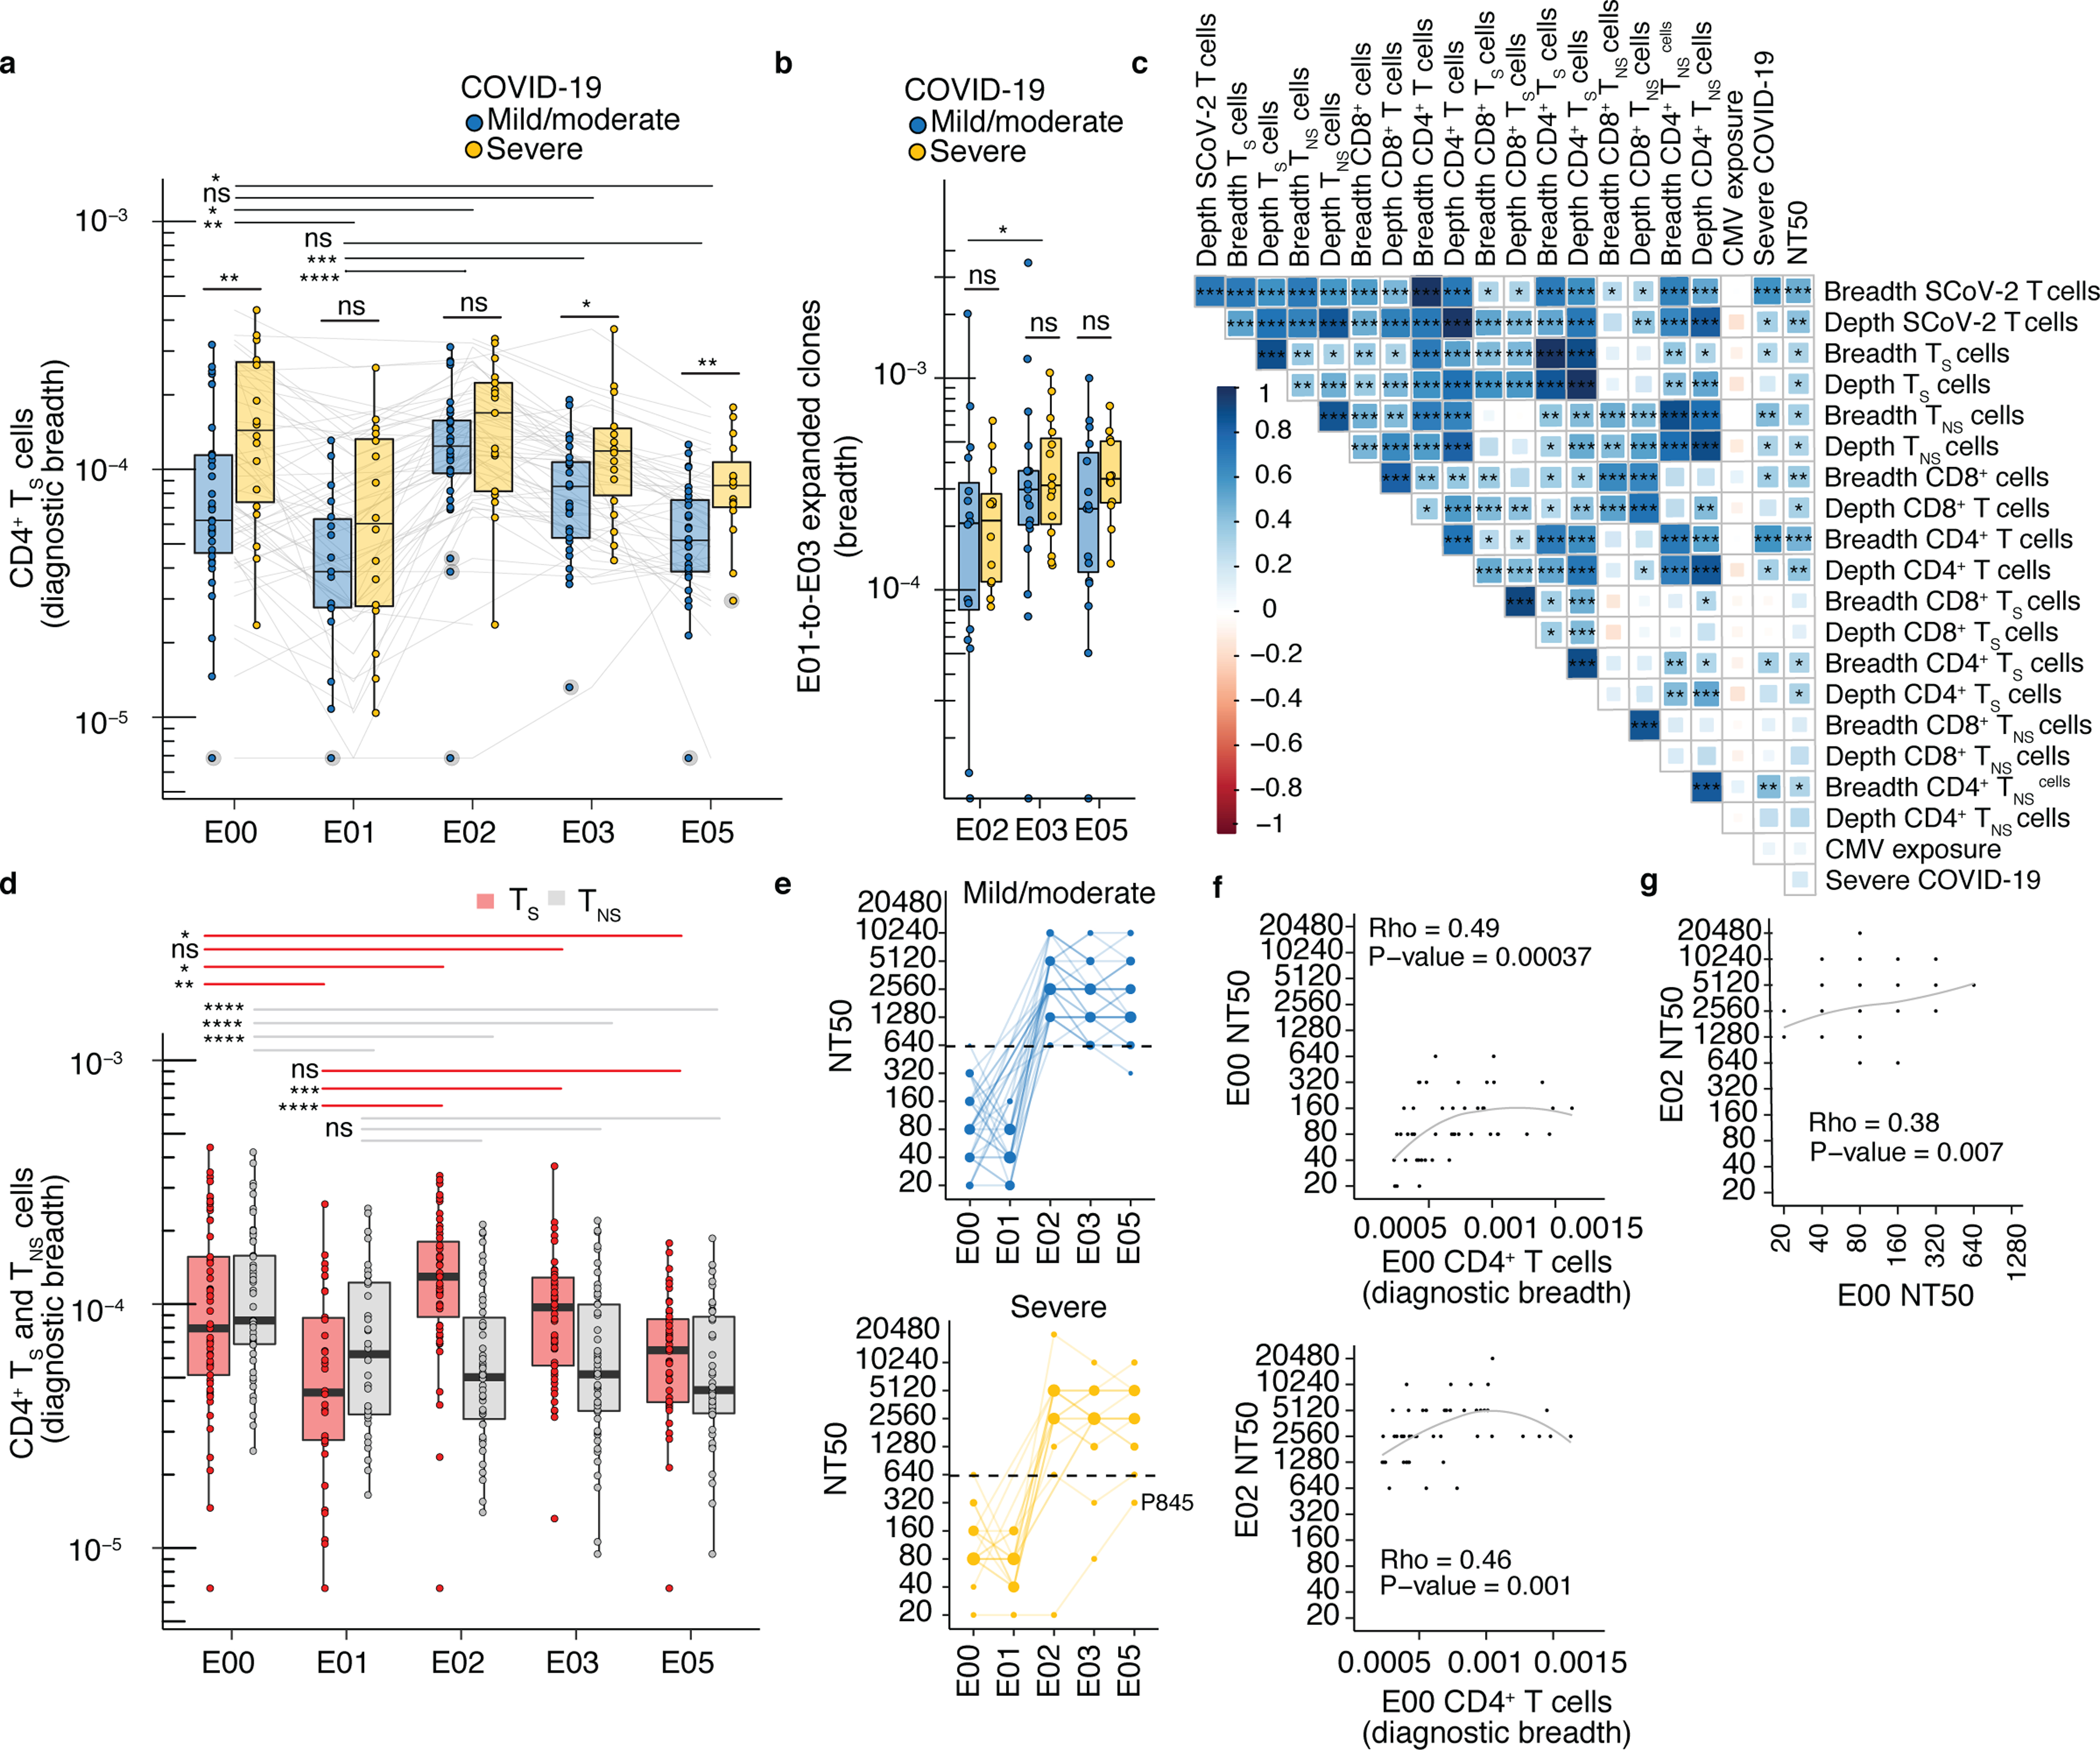
Severe acute respiratory syndrome coronavirus 2 (SARS-CoV-2) hybrid immunity is more protective than vaccination or previous infection alone. To investigate the kinetics of spike-reactive T (TS) cells from SARS-CoV-2 infection through messenger RNA vaccination in persons with hybrid immunity, we identified the T cell receptor (TCR) sequences of thousands of index TS cells and tracked their frequency in bulk TCRβ repertoires sampled longitudinally from the peripheral blood of persons who had recovered from coronavirus disease 2019 (COVID-19). Vaccinations led to large expansions in memory TS cell clonotypes, most of which were CD8+ T cells, while also eliciting diverse TS cell clonotypes not observed before vaccination. TCR sequence similarity clustering identified public CD8+ and CD4+ TCR motifs associated with spike (S) specificity. Synthesis of longitudinal bulk ex vivo single-chain TCRβ repertoires and paired-chain TCRɑβ sequences from droplet sequencing of TS cells provides a roadmap for the rapid assessment of T cell responses to vaccines and emerging pathogens.


Conflict of interest statement

Conflict of Interest Statements:

HSR and RE are employees of Adaptive Biotechnologies, Inc. B.E., E.E. and M.R.H. performed this work as employees of Laulima Government Solutions. M.M. and E.P. are subcontractors to Laulima Government Solutions; they performed this work as employees of Tunnell Government Services. The other authors have no competing interest. The funders had no role in study design, data collection and analysis, decision to publish or preparation of the manuscript.

Figures

Extended Data Fig. 1.
Extended Data Fig. 1.. Schedule of infection, vaccination, and sample collection.
Fifty-three study participants with prior SARS-CoV-2 infection as documented by seropositivity to S and N proteins and participant P845 who was seronegative prior to vaccination received either BNT162 or mRNA-1273 1st dose (closed circle), 2nd dose (closed triangle), and booster (3rd) dose (closed square) on the days after symptom onset as shown. Persons with mild or moderate COVID-19 are shown in magenta, persons with severe COVID-19 in black. Duration of hospitalization in persons with severe COVID-19 is shown in purple. PBMC were obtained at exam visits convalescence (E00, n = 54), late convalescence (E00.5, n = 16), pre-dose 1 (E01, n = 34), post-dose 1 (E02, n = 52), post-dose 2 (E03, n = 53), pre-boost (E04, n = 7), and post-boost (E05, n = 44). 33 persons had samples at E00, E01 and E03, 31 had samples at E00, E01, E02, and E03, and 26 had samples at all of E00, E01, E02, E03, and E05. Three participants were observed to have breakthrough COVID-19 infection based on boosting of anti-nucleocapsid antibody levels at visit E05 (P545, P664, P669), indicated in orange. All participants received primary vaccination but not all received a booster dose.
Extended Data Fig. 2.
Extended Data Fig. 2.. Primary vaccination led to expansion in specific TCR clonotypes in vaccinated persons.
Frequency (% of bulk TRB repertoire) of individual clonotypes in E01 vs. E03 in 32 persons with both samples. Expanded (red) (or contracted, purple) clonotypes were defined as log2(fold change) > 2 (or < 0.5) and Fisher’s exact test FDR-adjusted q value < 0.05. Dotted line indicates y = x. Participant ID at top of each graph. ND = not detected. Serologically-naive Participant P845 is not shown.
Extended Data Fig. 3.
Extended Data Fig. 3.. Frequency of E01-to-E03 expanded clonotypes from E00 through E05.
(a) E01-to-E03 expanded clonotype frequency (abundance) over the course of the study. Each line is an individual clonotype. TRB-PI are shown in black, TRB-PV are in orange (n = 30). ND = not detected. (b) Boxplot at lower right shows the percent of TRB-PI and TRB-PV for each participant that were detectable after a 3rd vaccine dose (E05) (n = 26). Median, IQR and whiskers (1.5*IQR) are noted. Comparison between groups is by two-sided Wilcoxon rank sum test, p = 0.0023. Participants P742 and P758 were not sampled at E02 and trajectories are not shown. Participant P665 had no expanded clonotypes and is not shown. Participant P845 was serologically naive at E00. Participants P545 and P669 experienced breakthrough infection between the E03 and the E05 timepoints and so repertoires at E05 represent both repeat natural infection as well as mRNA booster vaccine dose.
Extended Data Fig. 4.
Extended Data Fig. 4.. AIM-scTCRɑβ-seq enriches a complex set of clonotypes from PBMC after mRNA vaccination of previously SARS-CoV-2 infected persons.
(a) Frequency of clonotypes detected by CD69+CD137+ AIM-scTCRɑβ-seq plotted against the productive frequency of TRB-matched templates in bulk TRB sequencing at E03. Cell types defined by oligonucleotide-labeled mAbs are shown as CD4+ (green), CD8+ (blue), or phenotype not defined (purple) T cells. Clonotype enrichment in CD69+CD137+ AIM-scTCRɑβ-seq was determined by cumulative distribution function (CDF) with false discovery rate (FDR) correction (Methods). Clonotypes that were detected, but not enriched, in CD69+CD137+ AIM-scTCRɑβ-seq are shown in red (n = 180) and were omitted from CDR3 motif discovery analysis. UND indicates clonotypes that could not be assigned a TCRB unambiguously. (b,c) Productive frequency of CD69+CD137+ AIM-scTCRɑβ-seq detected clonotypes in relation to change in productive frequency from E01 to E03 in bulk TCR-β-seq is shown for 2 representative participants, including one with a lower proportion of representation in CD69+CD137+ AIM-scTCRɑβ-seq of their significantly expanded clonotypes (P525, b) and another with a higher proportion of significantly expanded clonotypes also seen by CD69+CD137+ AIM-scTCRɑβ-seq (P581, c). (d,e) Density plots show proportion of unique, expanded clonotypes by frequency at E03 (d) or fold change from E01 to E03 (primary vaccination) (e) by detection in CD69+CD137+ AIM-scTCRɑβ-seq at E03 amongst 12 participants with both paired E01/E03 bulk TCR-β-seq and CD69+CD137+ AIM-scTCRɑβ-seq.
Extended Data Fig. 5.
Extended Data Fig. 5.. TS from CD69+CD137+ AIM-scTCRɑβ-seq matching TRB clonotypes from nasal swabs in 14 participants at E05.
(a) Rank abundance plots of TRB clonotypes in nasal samples in 14 participants, where blue (CD8+) and green (CD4+) dashes indicate rank of clones identified in the same participant’s blood by CD69+CD137+ AIM-scTCRɑβ-seq at E03. (b) In participant P673, rank abundance plot of TRB clonotypes in nasal samples collected at E05. Clones labeled TCR1, TCR2, TCR3, TCR4, TCR8.1 and TCR8.2 indicate TRB clonotypes with exact sequence match to experimentally-confirmed receptors shown to recognize HLA-A*03:01 S epitopes.
Extended Data Fig. 6.
Extended Data Fig. 6.. TS and vaccine-expanded clonotypes.
Overlay of TRB sequences from CD69+CD137+ AIM-scTCRɑβ-seq of TS cells onto bulk TRB clonotype frequency at E01 and E03 in two representative participants. E01-to-E03 expanded (Ex) or contracted (Con), TRB clonotypes are shown, with TRB matching an CD69+CD137+ AIM-scTCRɑβ-seq (TS) shown in color and unmatched TRB are shown in gray (Und). Among clonotypes that neither expanded nor contracted (Non-Ex), only CD69+CD137+ AIM-scTCRɑβ-seq TRB-matched clonotypes are shown between red dashed lines. Frequencies of TRB clonotypes pre- and post-vaccine are as resolved by bulk TCR-β-seq. ND = not detected.
Extended Data Fig. 7.
Extended Data Fig. 7.. Abundance of TS clonotypes by TCRβ-seq over time.
Longitudinal tracking of abundance of CD69+CD137+ AIM-scTCRɑβ-seq-identified CD4+ and CD8+ TS TRB clonotypes in PBMC by TCRβ-seq in all participants with AIM-scTCRɑβ-seq. Numbers in top rows indicate the number of unique CD69+CD137+ AIM-scTCRɑβ-seq TRB clonotypes from E03 detected at each time point. Percentages refer to the fraction of CD69+CD137+ AIM-scTCRɑβ-seq clonotypes detected at the E02 and E03 timepoints, respectively, detected only post-vaccination. Percentages in gray are the fraction of unique clones detected at E03 that are below the level of detection at E02. Not all participants had samples at each time point, indicated by absence of dot symbols at those samples. Participant P669 had SARS-CoV-2 infection between E03 and E05 timepoints and so this E05 repertoire reflects repeat SARS-Co-2 infection and mRNA booster vaccine.
Extended Data Fig. 8.
Extended Data Fig. 8.. Selection of AIM-scTCRɑβ-seq T cells using CD69, CD137, and CD134/ CD154 marker sets compared to bulk TCRβ-seq and sorted CD4 TCRβ-seq from PBMCs from E01 to E03.
Frequency (% of bulk TRB repertoire) of individual clonotypes in E01 vs. E03 in 7 persons studied by CD69+CD137+ AIM-scTCRɑβ-seq and (CD69/CD137)+(CD134/CD154)+ CD4+ AIM-TCRβ-seq. Dotted line indicates y = x. Participant ID at top of each pair of graphs. ND = not detected. All PBMC are shown. Clonotypes found in the total CD4+ sorted fraction are shown in black. Clonotypes present in the total CD4+ sorted fraction and also enriched in sequential sorting of CD4+CD69+CD137+ (green) cells are overlaid with CD4+CD69+(CD134/CD154)+ and CD4+CD137+(CD134/CD154)+ (pink) cells in the left and right panels, respectively, for seven participants. Clonotypes in all three fractions (total CD4+, CD4+CD69+CD137+, and CD4+CD69+(CD134/CD154)+ and CD4+CD137+(CD134/CD154)+) are shown in orange. Gray shaded clonotypes were not identified as CD4+ by any of these methods.
Fig. 1.
Fig. 1.. Vaccines expand previously detected and low abundance clonotypes.
(a) Timing of PBMC sampling and frequency (fraction of the bulk TRB repertoire) of individual clonotypes in E01 vs. E03 in one representative participant (P673). Expanded clonotypes were defined as log2(fold change) > 2 (or < 0.5) and Fisher’s exact test FDR-adjusted p value < 0.05. (b) Frequency of E01-to-E03 expanded clonotypes from E00 through E05 in two representative participants (P581 and P837). (c) Sum of E01-to-E03 expanded TRB clonotype frequency (abundance) per participant detected at E00 and E01 (post-infection TRB clonotypes, TRB-PI) or detected exclusively starting at E02 (post-vaccination TRB clonotypes, TRB-PV, n = 28). (d) Comparison of abundance of E01-to-E03-expanded TRB-PI and TRB-PV at E02 (n = 30), E03 (n = 30) E05 (n = 28) relative to E01. (e) Number of unique E01-to-E03 expanded TRB-PI and TRB-PV clonotypes detected at E02 (post-dose 1) and E03 (post-dose 2), ranked by fraction of repertoire present at E03. (f) Breadth of E01-to-E03-expanded TRB-PI and TRB-PV clonotypes at E02 (n = 30), E03 (n = 30) and E05 (n = 28). (g) The percent of total E01-to-E03-expanded TRB clonotypes detected at E02 (n = 30), E03 (n = 30) and E05 (n = 28).d, f, g, level of statistical significance by Wilcox rank sum test between groups or Wilcoxon signed-rank test within groups between time periods is indicated: ns = not significant, *p<0.05, **p<0.01, ****p<0.0001. Box plots represent median, IQR, and whiskers (1.5 * IQR). All tests are two-sided.
Fig. 2.
Fig. 2.. Longitudinal kinetics of S-reactive clonotypes defined by AIM-scTCRɑβ-seq from post-infection to post-vaccination.
(a) Overlay of TRB sequences from CD69+CD137+ AIM-scTCRɑβ-seq of TS cells onto bulk TRB clonotype frequency at E01 and E03 in two representative participants. E01-to-E03 expanded (Ex), non-expanded (non-Ex) or contracted (Con) TRB clonotypes for TRB sequences matching CD69+CD137+ AIM-scTCRɑβ-seq (TS) and unmatched TRB sequences (undetected, Und) are shown. (b) Numbers of expanded or non-expanded PBMC TRB-defined clonotypes matching CD8+ or CD4+ TS clonotypes in 12 participants with E01-E03 expanded samples. (c) Longitudinal tracking of CD69+CD137+ AIM-scTCRɑβ-seq-identified CD4+ and CD8+ TS TRB clonotype abundance in PBMC of two representative participants. The number of unique CD69+CD137+ AIM-scTCRɑβ-seq TRB clonotypes from E03 detected at each time point are shown. Percentages represent CD69+CD137+ AIM-scTCRɑβ-seq TRB-PV clonotypes for the E02 and E03 timepoints. (d) Mean abundances of S-reactive CD4+ and CD8+ T cell clonotypes identified by CD69+CD137+ AIM-scTCRɑβ-seq in 17 participants at E00 to E05. (e) Distribution of fold-changes (median, box (IQR), and whiskers (1.5 * IQR)) observed for S-reactive CD4+ or CD8+ T cell clonotypes between E01 and E02 and E01 and E03. (f) Intracellular cytokine staining after stimulation of PBMC isolated at E01 (n=7), E02 (n=14) and E03 (n=14) with S peptides. Level of statistical significance by paired, two-sided Wilcoxon signed-rank test is indicated *p<0.05, **p<0.01.
Fig. 3.
Fig. 3.. Trajectories of S-reactive clonotypes defined by AIM-scTCRɑβ-seq differentiate CD4+ and CD8+ T cells.
(a) Unsupervised hierarchical clustering of S-reactive clonotypes identified by CD69+CD137+ CD69+CD137+ AIM-scTCRɑβ-seq based on cosine similarity of their E00, E01, E02, E03, E05 log productive frequency showing five major trajectory types: minimal proliferation (Group 1), proliferation at E02 followed by contraction (Group 2), proliferation at E03 (Group 3), proliferation at E02 without contraction (Group 4) or proliferation at E02 and E03 (Group 5). Mean trajectory with each group is shown as a dashed line. (b) The percentage of clonotypes per participant by trajectory group for CD4+ and CD8+ TS cells in the 11 participants with CD69+CD137+ AIM-scTCRɑβ-seq phenotyping and PBMC sampling at all 5 visits (E00-E05).
Fig. 4.
Fig. 4.. TCRαβ sequence similarity network shows public CD8+ T cell responses among sequences recovered by AIM-scTCRɑβ-seq.
(a) Sequence similarity graph with 1448 paired TCRɑβ clonotypes and 248 convergent CD8+ T cell and CD4+ T cell clusters of two or more S-reactive clonotypes recovered from 17 persons at E03. Edges are formed between similar receptors (TCRdist ≤ 100). Edges indicate connections between TCRs observed in multiple or single participants. Circle size represents the relative frequency of each TCRαβ clonotype. Equivalent TCRαβ amino acid sequences may be included more than once if found in multiple participants. (b-h) Logo plots for representative clusters indicated by integers in (a) with inferred restricting HLA class I alleles (see Methods) and number of participants contributing to each cluster with the matching HLA allele, and graphs showing the sum of clonal frequency of the TRB sequences in each cluster in longitudinal PBMC repertoires for each participant. For each CDR3 motif, the lower sequence logo shows the probability of each amino acid residue at each CDR3 position, and the upper sequence logo depicts the information content in bits comparing the residue usage to a set of randomly selected CDR3 with the same V and J gene usage as the sequence cluster (Methods).
Fig. 5.
Fig. 5.. Transgenic CD8+ T cell-origin TCRs from 5 public clusters are activated in the context of HLA-A*03:01 and the KCY epitope.
(a) TRA- and TRB-gene usage and CDR3 sequences of transgenic TCRs from five public sequence-similarity clusters expressed in Jurkat reporter cells (Methods). (b) Frequency in PBMC of selected clonotypes in the bulk TCRβ-seq datasets from E00 to E03. (c) Heatmap showing the percent of maximal response for each TCR expressed in the Jurkat reporter cells cultured with HLA-A*03:01-expressing APC exposed to peptides of varying lengths in the region of residues 378–386 of S protein [1μg/mL] within a single experiment. (d) Heatmap showing the percent of maximal response for each TCR expressed in Jurkat reporter cells stimulated with HLA class I-expressing artificial APC with or without co-transfection of full-length S from SARS-CoV-2 strain Wuhan-1 (Wu-1) within a single experiment. Controls include APC treated with media or S alone. The last four rows of the heatmap represent a separate experiment, whereby each TCR was tested with HLA-A*03:01 and Wu-1 S or Omicron variants BA.1, BA.2, and BA.4. (e) Peptide titration (10−5 to 1 μg/mL) with SARS-CoV-2 S 10-mer (KCYGVSPTKL) and internal 9-mers (KCYGVSPTK and CYGVSPTKL) tested with TCR-transduced Jurkat reporter cells cultured with lymphoblastoid cell lines known to express HLA-A*03:01. Y-axis shows percent of reporter cells with mNeonGreen fluorescence.
Fig. 6.
Fig. 6.. TRB sequence-defined metrics and nAb associate with disease severity before and after mRNA vaccination.
(a) Comparison of diagnostic CD4+ TS breadth (Methods) between participants with mild/moderate COVID-19 at E00 (n=35), E01 (n=18), E02 (n=35), E03 (n=35), E05 (n =29) and severe COVID-19 at E00 (n=19), E01 (n=16), E02 (n=17), E03 (n=18), E05 (n=15)). (b) Breadth of E01-to-E02, E01-E03 and E01-E05 expanded clonotypes in mild/moderate COVID-19 at E02 (n=17), E03 (n=18), E05 (n=16), and severe COVID-19 at E02 (n=12), E03 (n=15), E05 (n=12). (c) Rank correlation of diagnostic sequence-defined metrics (S, spike; NS, non-spike) with severity and neutralization titers (NT50) at E00 (n = 51). CMV exposure was imputed from TRB repertoire (Methods). Shading, strength of correlation (ρ correlation coefficient); asterisks, level of statistical significance. (d) Breadth of inferred CD4+ TS and TNS TRB sequences from PBMC at E00 (n=54), E01 (n=34), E02 (n=52), E03 (n=53), E05 (n=44). (e) NT50 of serum antibodies in mild/moderate (n=35) and severe COVID-19 (n=19) at E00, E01, E02, E03, and E05). (f) Association of CD4+ T cell diagnostic breadth at E00 with nAb NT50 at E00 and E02 (n=52). (g) Association between E00 nAb NT50 and E02 nAb NT50 (n=52) in participants with prior SARS-CoV-2 infection. In (a, b, d), tests between time points are paired Wilcoxon signed-rank and between groups with different severity are unpaired Wilcoxon rank-sum. Median, IQR, and whiskers (1.5 * IQR) are shown. Level of two-sided statistical significance is as indicated: ns = not significant, *p<0.05, **p<0.01, ***p<0.001, ****p<0.0001.

References

    1. Goldberg Y. et al. Protection and waning of natural and hybrid immunity to SARS-CoV-2. N. Engl. J. Med 386, 2201–2212 (2022). - PMC - PubMed
    1. Suarez Castillo M, Khaoua H. & Courtejoie N. Vaccine-induced and naturally-acquired protection against Omicron and Delta symptomatic infection and severe COVID-19 outcomes, France, December 2021 to January 2022. Eurosurveillance 27, (2022). - PMC - PubMed
    1. Qu P. et al. Durability of booster mRNA vaccine against SARS-CoV-2 BA.2.12.1, BA.4, and BA.5 subvariants. N. Engl. J. Med 1–4 (2022) doi:10.1056/NEJMc2210546. - DOI - PMC - PubMed
    1. Lim JME et al. SARS-CoV-2 breakthrough infection in vaccinees induces virus-specific nasal-resident CD8+ and CD4+ T cells of broad specificity. J. Exp. Med 219, (2022). - PMC - PubMed
    1. Peng Y. et al. Broad and strong memory CD4+ and CD8+ T cells induced by SARS-CoV-2 in UK convalescent individuals following COVID-19. Nat. Immunol 21, 1336–1345 (2020). - PMC - PubMed

Substances