. 2024 Jan;625(7994):345-351.
doi: 10.1038/s41586-023-06801-2. Epub 2023 Dec 6.

TAF15 amyloid filaments in frontotemporal lobar degeneration

Affiliations

TAF15 amyloid filaments in frontotemporal lobar degeneration

Stephan Tetter et al. Nature. 2024 Jan.

Abstract

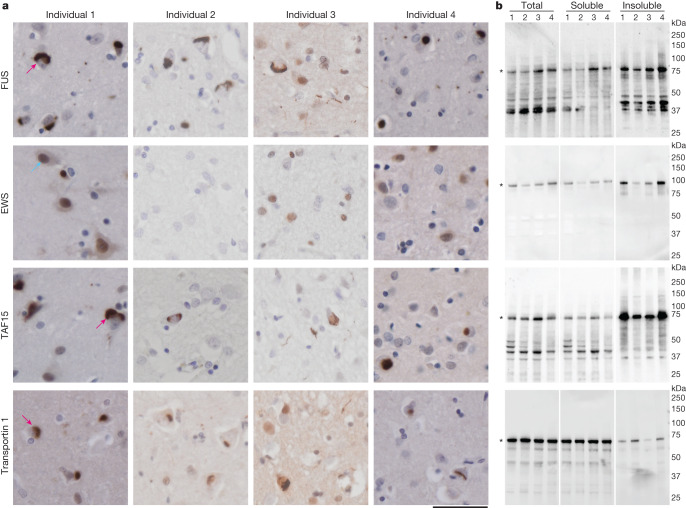
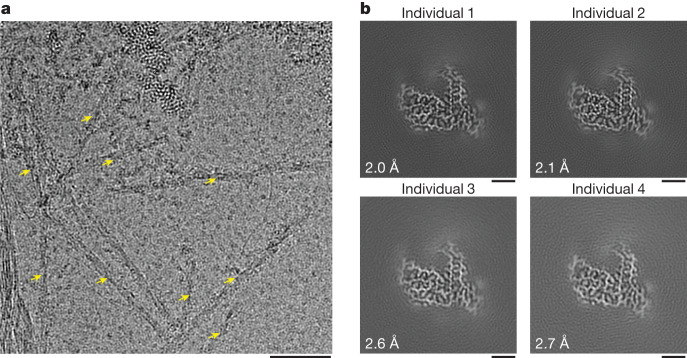
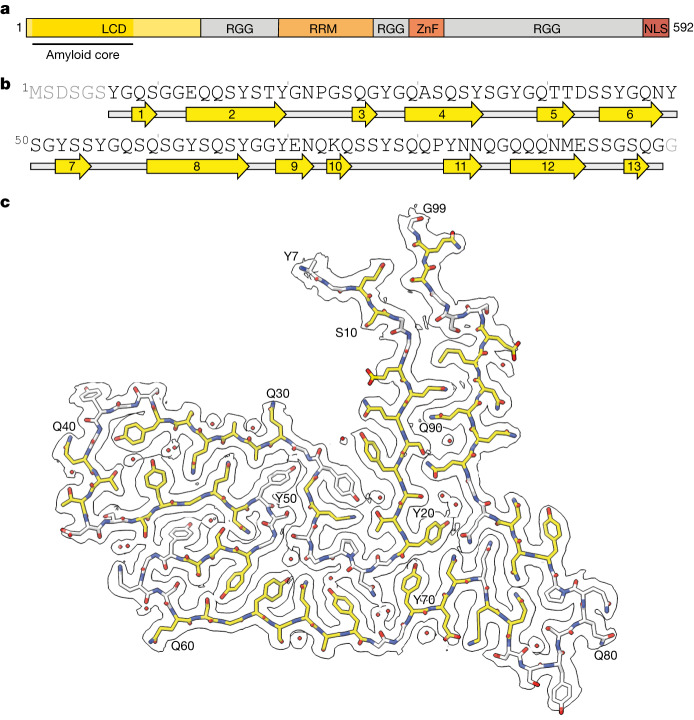
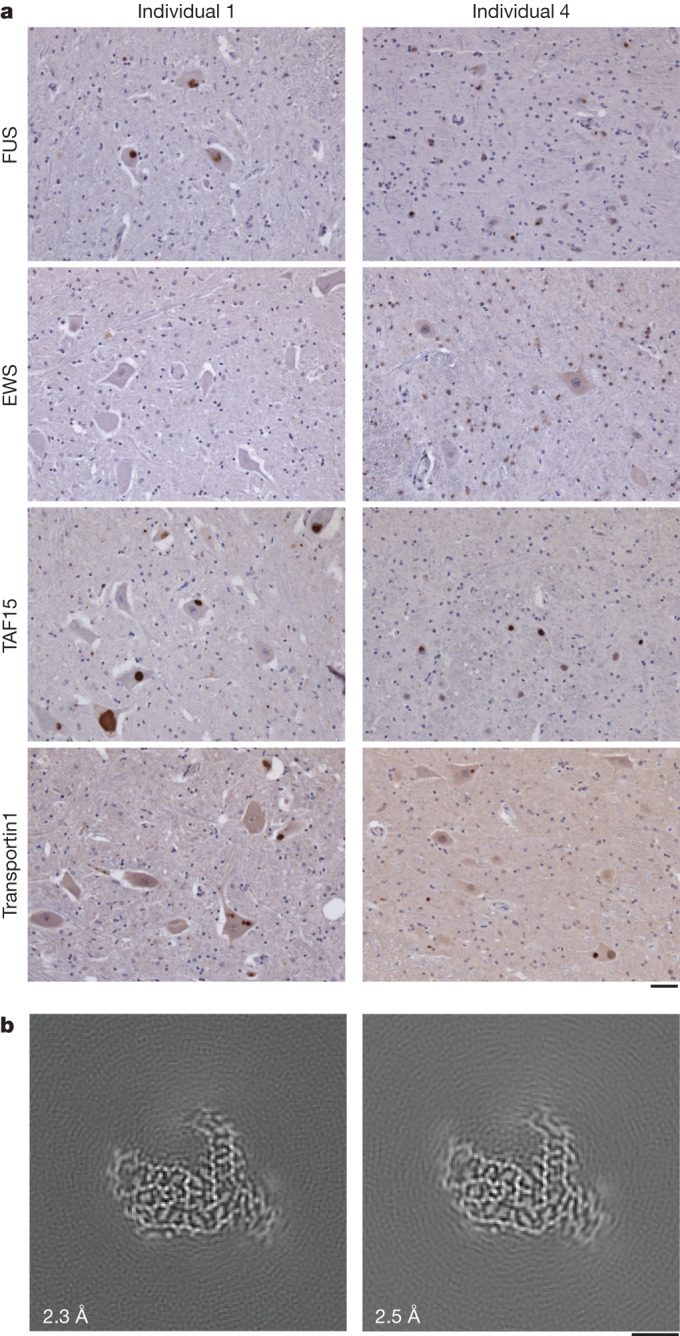
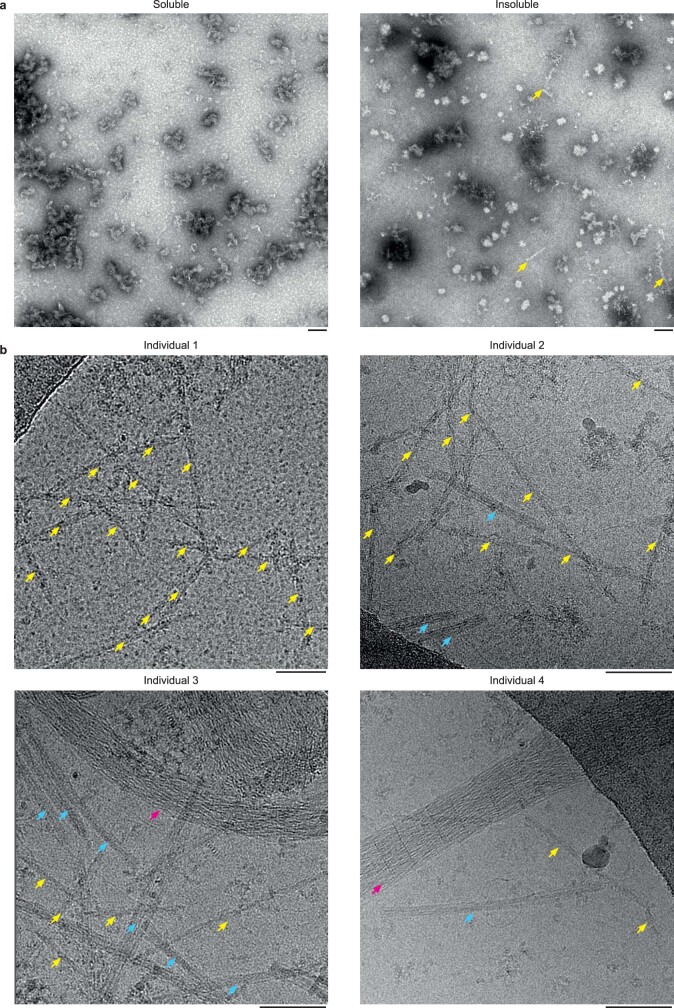
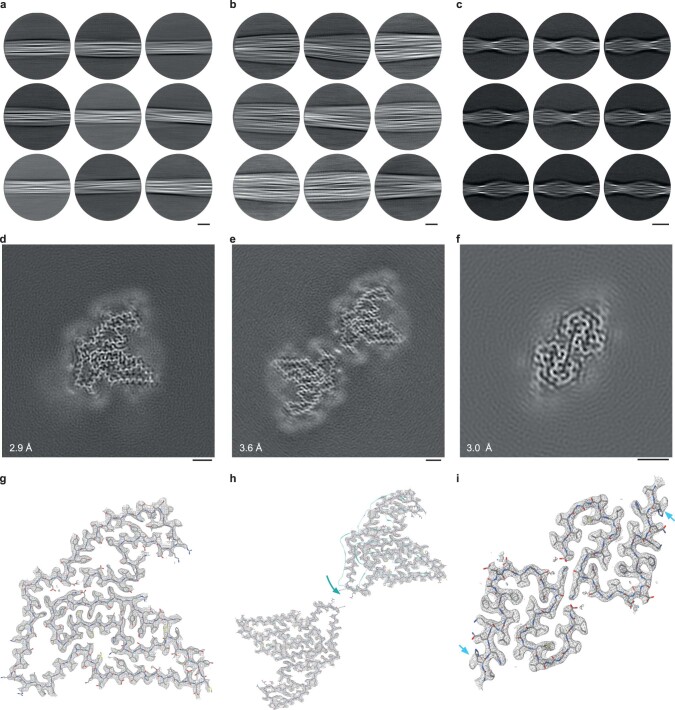
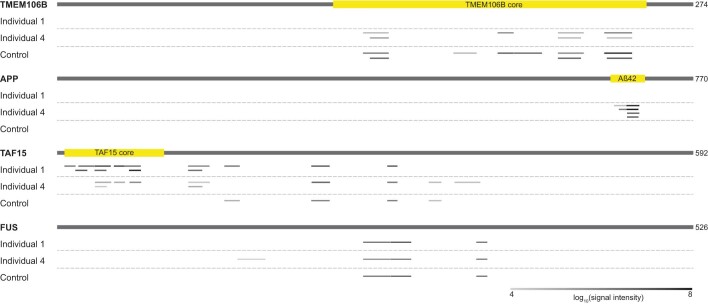
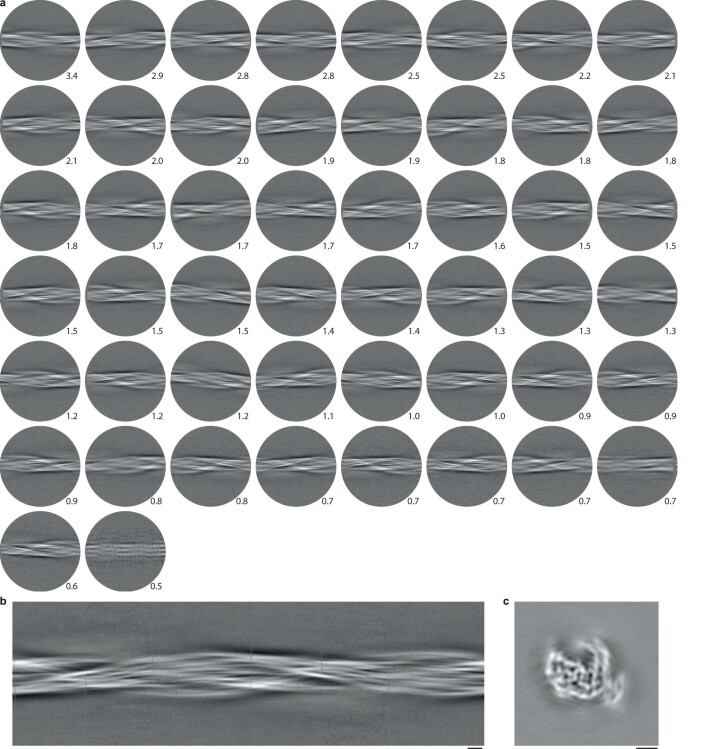
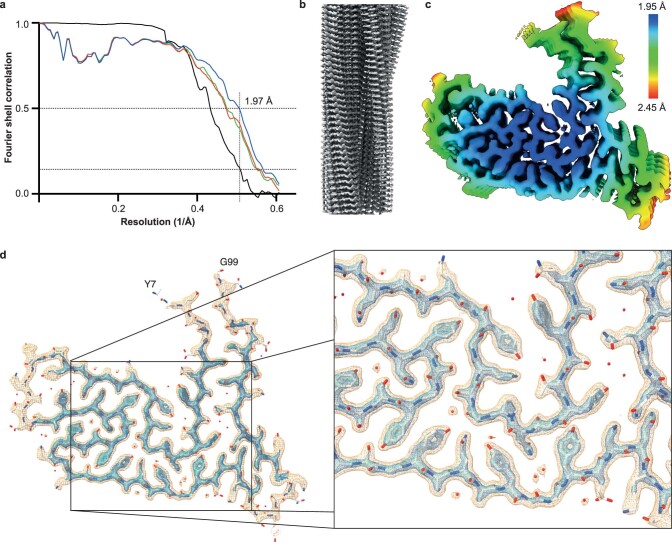
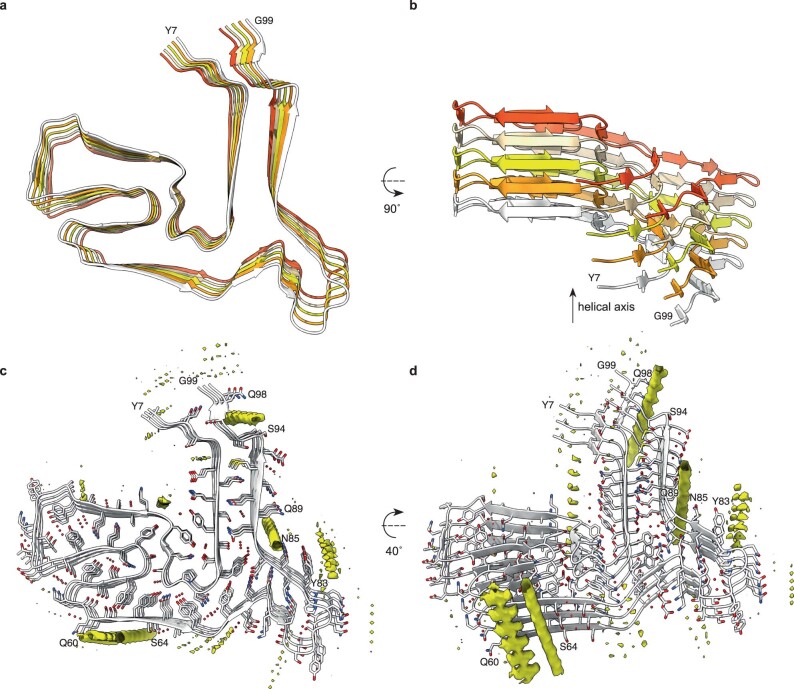
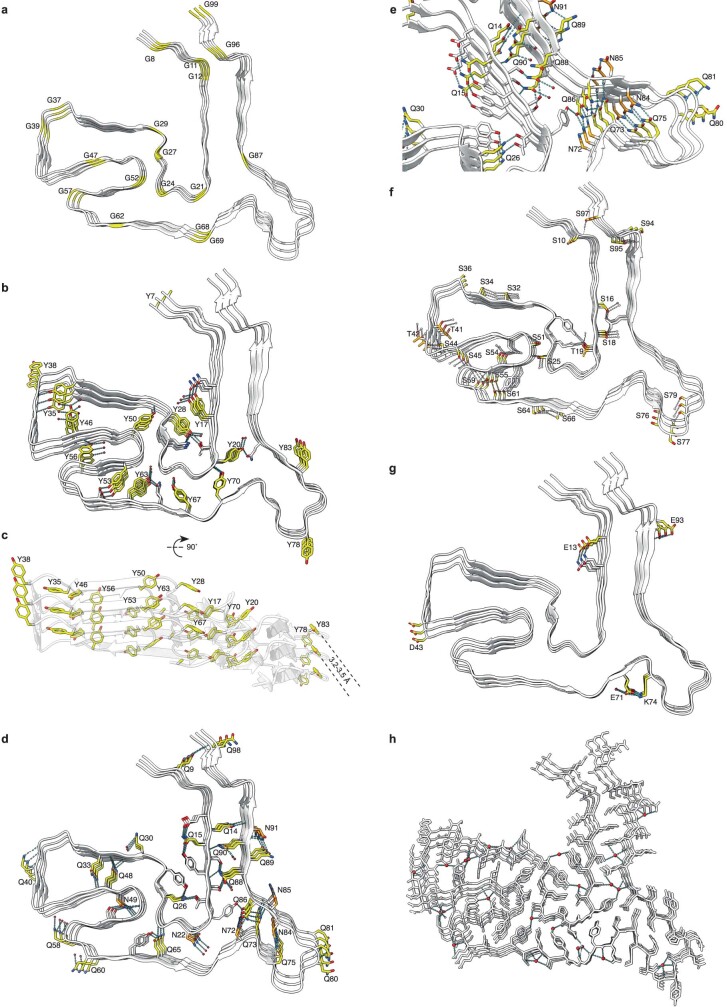
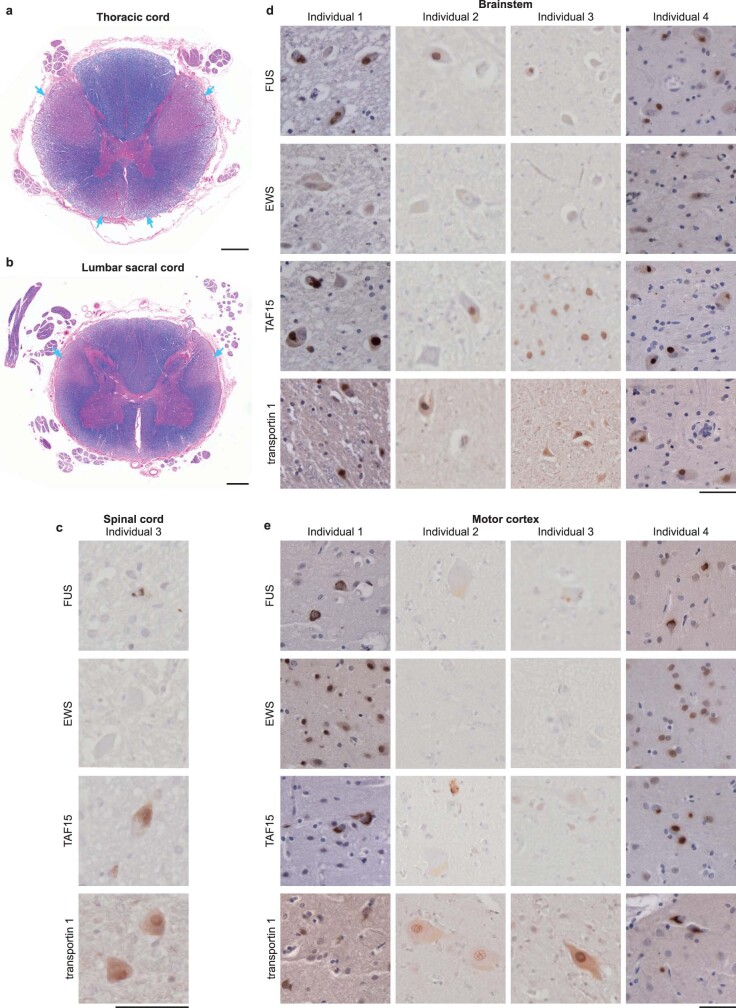
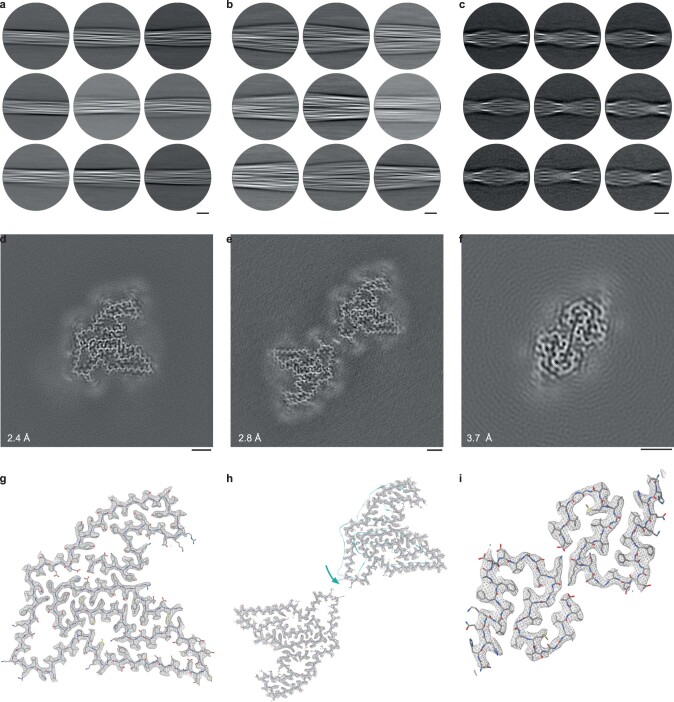
Frontotemporal lobar degeneration (FTLD) causes frontotemporal dementia (FTD), the most common form of dementia after Alzheimer's disease, and is often also associated with motor disorders1. The pathological hallmarks of FTLD are neuronal inclusions of specific, abnormally assembled proteins2. In the majority of cases the inclusions contain amyloid filament assemblies of TAR DNA-binding protein 43 (TDP-43) or tau, with distinct filament structures characterizing different FTLD subtypes3,4. The presence of amyloid filaments and their identities and structures in the remaining approximately 10% of FTLD cases are unknown but are widely believed to be composed of the protein fused in sarcoma (FUS, also known as translocated in liposarcoma). As such, these cases are commonly referred to as FTLD-FUS. Here we used cryogenic electron microscopy (cryo-EM) to determine the structures of amyloid filaments extracted from the prefrontal and temporal cortices of four individuals with FTLD-FUS. Surprisingly, we found abundant amyloid filaments of the FUS homologue TATA-binding protein-associated factor 15 (TAF15, also known as TATA-binding protein-associated factor 2N) rather than of FUS itself. The filament fold is formed from residues 7-99 in the low-complexity domain (LCD) of TAF15 and was identical between individuals. Furthermore, we found TAF15 filaments with the same fold in the motor cortex and brainstem of two of the individuals, both showing upper and lower motor neuron pathology. The formation of TAF15 amyloid filaments with a characteristic fold in FTLD establishes TAF15 proteinopathy in neurodegenerative disease. The structure of TAF15 amyloid filaments provides a basis for the development of model systems of neurodegenerative disease, as well as for the design of diagnostic and therapeutic tools targeting TAF15 proteinopathy.


Conflict of interest statement

The authors declare no competing interests.

Figures

Fig. 1
Fig. 1. FET proteins and transportin 1 in FTLD–FET.
a, FUS, EWS, TAF15 and transportin 1 immunoreactivity (brown) in the prefrontal cortex of individials 1–4 with FTLD–FET. Sections were counterstained with haematoxylin (blue). Scale bar, 50 μm. Neuronal cytoplasmic inclusions were immunoreactive for FUS, TAF15 and transportin 1 (examples indicated by magenta arrows for individual 1). Antibodies against EWS showed diffuse labelling of nuclei only (example indicated by cyan arrow for individual 1). b, Immunoblots of the total homogenate, sarkosyl-soluble fraction and sarkosyl-insoluble fraction of frontotemporal cortex grey matter from individuals 1–4 with FTLD–FET with antibodies against FUS, EWS, TAF15 and transportin 1. Asterisks indicate bands corresponding to full-length proteins. Bands of lower molecular weight probably correspond to protease cleavage products. For uncropped images of immunoblots see Supplementary Fig. 1. a,b, Results are representative of n ≥ 3 technical replicates per individual.
Fig. 2
Fig. 2. Cryo-EM characterization of amyloid filaments from individuals with FTLD–FET.
a, Representative cryo-EM micrograph of the sarkosyl-insoluble fraction of frontotemporal cortex grey matter from individual 1 with FTLD–FET. Abundant amyloid filaments are indicated by arrows. Scale bar, 50 nm. Results are representative of n ≥ 3 technical replicates per individual. Additional micrographs for all four individuals are shown in Extended Data Fig. 1b. b, Cryo-EM reconstructions of amyloid filaments from individuals 1–4 with FTLD–FET showing a readily traceable protein backbone and well-resolved amino acid side-chain densities. All four reconstructions have an identical filament fold. Resolution estimates are indicated. Scale bars, 2 nm.
Fig. 3
Fig. 3. Cryo-EM structure of TAF15 amyloid filaments from FTLD–FET.
a, Domain organization of TAF15. The region comprising the ordered core of TAF15 amyloid filaments is indicated. RRM, RNA recognition motif; ZnF, zinc finger domain. b, Sequence alignment of secondary structure elements of the TAF15 amyloid filament fold. Arrows indicate β-strands. c, Cryo-EM reconstruction and atomic model of the TAF15 amyloid filament structure, shown for a single TAF15 molecule perpendicular to the helical axis. The carbon atoms of residues forming β-strands are shown in yellow and ordered solvent as red spheres.
Fig. 4
Fig. 4. Motor neuron inclusions and TAF15 filaments.
a, FUS, EWS, TAF15 and transportin 1 immunoreactivity (brown) in the spinal cord of individuals 1 and 4 with FTLD–FET. Sections were counterstained with haematoxylin (blue). Motor neuron inclusions were immunoreactive for FUS, TAF15 and transportin 1. Antibodies against EWS showed only diffuse labelling of nuclei. Results are representative of n ≥ 3 technical replicates per individual. Additional immunohistochemistry of spinal cord, motor cortex and brainstem for all four individuals is shown in Extended Data Fig. 8. Scale bar, 50 μm. b, Cryo-EM reconstructions of amyloid filaments from the motor cortex of individual 1 (left) and medulla of individual 4 (right), showing TAF15 filaments with a fold identical to those from prefrontal cortices. Resolution estimates are indicated. Scale bar, 2 nm.
Extended Data Fig. 1
Extended Data Fig. 1. Electron micrographs of sarkosyl-soluble and -insoluble brain extracts from individuals with FTLD-FET.
a, Representative negative stain electron micrographs of the sarkosyl-soluble and -insoluble fractions of prefrontal cortex grey matter from FTLD-FET individual 1. Amyloid filaments were only observed in the insoluble fraction (yellow arrows). Scale bar, 100 nm. b, Cryo-EM micrographs of the sarkosyl-insoluble fraction of frontotemporal cortex grey matter from FTLD-FET individuals 1–4. Yellow arrows indicate the predominant filament population. Cyan arrows indicate TMEM106B filaments. Magenta arrows indicate collagen fibres. Scale bars, 50 nm. For a and b, the results are representative of n ≥ 3 technical replicates per individual.
Extended Data Fig. 2
Extended Data Fig. 2. Cryo-EM structure of TMEM106B and Aβ42 filaments from the prefrontal cortex of FTLD-FET individual 4.
a-c, Cryo-EM reference-free 2D class averages of the filament segments used to reconstruct TMEM106B singlet (a), TMEM106B doublet (b), and Aβ42 (c) filaments from FTLD-FET individual 4. Scale bars, 10 nm. d-f, Cryo-EM reconstructions of TMEM106B singlet (d), TMEM106B doublet (e), and Aβ42 (f) filaments, viewed as central slices perpendicular to the helical axis. Scale bar, 2 nm. Resolution estimates are indicated. g, Fit of the published atomic model of singlet TMEM106B type 1 filaments (PDB- ID: 7QVC) into the density map (grey mesh), shown for a single peptide perpendicular to the helical axis. h, Fit of the published atomic model of doublet TMEM106B type 1 filaments (PDB-ID: 7QVF) into the density map (grey mesh), shown for two C2 symmetry-related peptides perpendicular to the helical axis. The two chains were fit individually, as their relative orientations were rotated compared to the published model (teal). i, Fit of the published atomic model of Aβ42 type II filaments (PDB-ID: 7Q4M) into the reconstruction (grey mesh), shown for two C2 symmetry-related peptides perpendicular to the helical axis. The overall structure remains similar, with only subtle shifts in the backbone towards the N-termini and His13 side chain flips (cyan arrows) observed in our reconstruction.
Extended Data Fig. 3
Extended Data Fig. 3. Mass spectrometry analysis of TMEM106B, APP, TAF15 and FUS in insoluble extracts from individuals with FTLD-FET.
Peptides identified by mass spectrometry are mapped along the protein sequences of TMEM106B, the amyloid-β precursor protein (APP), TAF15 and FUS. The amyloid filament core regions of TMEM106B and TAF15, as well as the Aβ42 peptide, are highlighted in yellow. Peptides from TMEM106B were not detected for individual 1, in agreement with the cryo-EM data. Peptides from Aβ42 were only detected for individual 4, in agreement with cryo-EM data and histopathology (Extended Data Table 1). Peptides mapping to the TAF15 filament core were only identified for individuals with FTLD-FET. No differences could be identified in FUS peptides for individuals with or without disease. Peptides from EWS and transportin-1 were not detected.
Extended Data Fig. 4
Extended Data Fig. 4. Cryo-EM 2D class averages and 3D initial model of amyloid filaments from FTLD- FET.
a, The 50 most populated cryo-EM reference-free 2D class averages of amyloid filaments from FTLD- FET individual 1 are shown. Numbers indicate the percentage of filament segments in each class average with respect to the total number of classified segments. The displayed classes comprise ~80% of total filament segments. The circular mask has a diameter of 400 Å and corresponds to approximately one helical cross-over of the filaments. b,c, An initial 3D model of amyloid filaments from FTLD-FET individual 1, generated de novo from reference-free 2D class averages, viewed as a 2D projection along the helical axis (b) and as a central slice perpendicular to the helical axis (c). Scale bars, 2 nm.
Extended Data Fig. 5
Extended Data Fig. 5. A high-resolution map of TAF15 amyloid filaments from FTLD-FET.
a, Fourier shell correlation (FSC) curves for two independently refined half maps from individual 1 (black line); for the refined atomic model against the cryo-EM density map (blue); and for the atomic model shaken and refined against the first (green) or second (red) independent half map. FSC thresholds of 0.143 and 0.5, as well as a vertical line at the estimated map resolution of 1.97 Å are plotted. b, The map viewed along the helical axis, showing well-resolved individual TAF15 molecules. c, The map with rainbow-coloured local resolution estimates viewed perpendicular to the helical axis. d, The map, shown at contour levels of 0.015 (orange) and 0.0345 (blue), viewed for a single TAF15 molecule perpendicular to the helical axis, shows a well-resolved backbone and clear side-chain densities, including aromatic rings of tyrosine residues.
Extended Data Fig. 6
Extended Data Fig. 6. The TAF15 amyloid filament fold of FTLD-FET.
a,b, Atomic model of TAF15 amyloid filaments from FTLD-FET shown for five differently-coloured TAF15 molecules perpendicular to (b) and along (c) the helical axis, showing that individual TAF15 molecules are not planar and that the N- and C-termini of neighbouring molecules interact with each other. c,d, Unmodelled densities (yellow), calculated by subtracting modelled density from the cryo-EM map, shown perpendicular to the helical axis (d) and rotated by 40° (e).
Extended Data Fig. 7
Extended Data Fig. 7. Structural features of the TAF15 amyloid filament fold of FTLD-FET.
a–h, Views of the atomic model of TAF15 amyloid filaments from FTLD-FET, shown for three TAF15 molecules, highlighting glycine residues (yellow) (a); tyrosine residues (yellow), their hydrogen bonding network (dashed lines) and staggered stacking interactions of their aromatic side chain groups (b,c); glutamine (yellow) and asparagine (orange) residues and their hydrogen bonding network (dashed lines) (d,e); serine (yellow) and threonine (orange) residues and their hydrogen bonding network (dashed lines) (f); charged residues (yellow), with a salt bridge between K74 and E71 (g); and ordered solvent molecules (red) and their hydrogen bonding network (dashed lines) (h).
Extended Data Fig. 8
Extended Data Fig. 8. Motor neuron pathology.
a, b, Luxol fast blue staining of myelin in the thoracic (a) and lumbar (b) spinal cord of FTLD-FET individual 1 showing extensive corticospinal tract loss (cyan arrows). Scale bar, 1 mm. c–e, FUS, EWS, TAF15 and transportin 1 immunoreactivity (brown) in the spinal cord of individual 3 (c), the brainstem of individuals 1–4 (d); and the motor cortex of individuals 1–4 (e). Sections were counterstained with hematoxylin (blue). Scale bars, 50 μm. Abundant motor neuron inclusions were observed for individuals 1 and 4, whereas inclusions were scarce or absent in individuals 2 and 3. Motor neuron inclusions were immunoreactive for FUS, TAF15 and transportin 1. Antibodies against EWS only showed diffuse labelling of nuclei. For a–e, the results are representative of n ≥ 3 technical replicates per individual.
Extended Data Fig. 9
Extended Data Fig. 9. Cryo-EM structure of TMEM106B and Aβ42 filaments from the brainstem of FTLD- FET individual 4.
a-c, Cryo-EM reference-free 2D class averages of the filament segments used to reconstruct TMEM106B singlet (a), TMEM106B doublet (b), and Aβ42 (c) filaments from the brainstem of FTLD-FET individual 4. Scale bars, 10 nm. d-f, Cryo-EM reconstructions of TMEM106B singlet (d), TMEM106B doublet (e), and Aβ42 (f) filaments, viewed as a central slice perpendicular to the helical axis. Scale bar, 2 nm. Resolution estimates are indicated. g, Fit of the published atomic model of singlet TMEM106B type 1 filaments (PDB-ID: 7QVC) into the density map (grey mesh), shown for a single peptide perpendicular to the helical axis. h, Fit of the published atomic model of doublet TMEM106B type 1 filaments (PDB-ID: 7QVF) into the density map (grey mesh), shown for two C2 symmetry-related peptides perpendicular to the helical axis. The two chains were fit individually, as their relative orientations were rotated compared to the published model (teal). i, Fit of the published atomic model of Aβ42 type II filaments (PDB-ID: 7Q4M) into the reconstruction (grey mesh), shown for two C2 symmetry-related peptides perpendicular to the helical axis.

References

    1. Grossman M, et al. Frontotemporal lobar degeneration. Nat. Rev. Dis. Primers. 2023;9:40. doi: 10.1038/s41572-023-00447-0. - DOI - PubMed
    1. Neumann M, Mackenzie IRA. Review: neuropathology of non-tau frontotemporal lobar degeneration. Neuropath. Appl. Neurobiol. 2019;45:19–40. doi: 10.1111/nan.12526. - DOI - PubMed
    1. Shi Y, et al. Structure-based classification of tauopathies. Nature. 2021;598:359–363. doi: 10.1038/s41586-021-03911-7. - DOI - PMC - PubMed
    1. Arseni, D. et al. TDP-43 forms amyloid filaments with a distinct fold in type A FTLD-TDP. Nature620, 898–903 (2023). - PMC - PubMed
    1. Arseni D, et al. Structure of pathological TDP-43 filaments from ALS with FTLD. Nature. 2022;601:139–143. doi: 10.1038/s41586-021-04199-3. - DOI - PMC - PubMed

MeSH terms