. 2024 Jan;625(7993):92-100.
doi: 10.1038/s41586-023-06045-0. Epub 2023 Dec 6.

A genomic mutational constraint map using variation in 76,156 human genomes

Collaborators, Affiliations

A genomic mutational constraint map using variation in 76,156 human genomes

Siwei Chen et al. Nature. 2024 Jan.

Erratum in

  • Author Correction: A genomic mutational constraint map using variation in 76,156 human genomes.
    Chen S, Francioli LC, Goodrich JK, Collins RL, Kanai M, Wang Q, Alföldi J, Watts NA, Vittal C, Gauthier LD, Poterba T, Wilson MW, Tarasova Y, Phu W, Grant R, Yohannes MT, Koenig Z, Farjoun Y, Banks E, Donnelly S, Gabriel S, Gupta N, Ferriera S, Tolonen C, Novod S, Bergelson L, Roazen D, Ruano-Rubio V, Covarrubias M, Llanwarne C, Petrillo N, Wade G, Jeandet T, Munshi R, Tibbetts K; Genome Aggregation Database Consortium; O'Donnell-Luria A, Solomonson M, Seed C, Martin AR, Talkowski ME, Rehm HL, Daly MJ, Tiao G, Neale BM, MacArthur DG, Karczewski KJ. Chen S, et al. Nature. 2024 Feb;626(7997):E1. doi: 10.1038/s41586-024-07050-7. Nature. 2024. PMID: 38225470 No abstract available.

Abstract

The depletion of disruptive variation caused by purifying natural selection (constraint) has been widely used to investigate protein-coding genes underlying human disorders1-4, but attempts to assess constraint for non-protein-coding regions have proved more difficult. Here we aggregate, process and release a dataset of 76,156 human genomes from the Genome Aggregation Database (gnomAD)-the largest public open-access human genome allele frequency reference dataset-and use it to build a genomic constraint map for the whole genome (genomic non-coding constraint of haploinsufficient variation (Gnocchi)). We present a refined mutational model that incorporates local sequence context and regional genomic features to detect depletions of variation. As expected, the average constraint for protein-coding sequences is stronger than that for non-coding regions. Within the non-coding genome, constrained regions are enriched for known regulatory elements and variants that are implicated in complex human diseases and traits, facilitating the triangulation of biological annotation, disease association and natural selection to non-coding DNA analysis. More constrained regulatory elements tend to regulate more constrained protein-coding genes, which in turn suggests that non-coding constraint can aid the identification of constrained genes that are as yet unrecognized by current gene constraint metrics. We demonstrate that this genome-wide constraint map improves the identification and interpretation of functional human genetic variation.


Figures

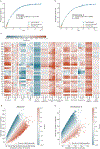
Extended Data Fig. 1:
Construction of mutational model and Gnocchi score. a,b, Estimation of trinucleotide context-specific mutation rates. The proportion of possible variants observed for each substitution and context in 76,156 gnomAD genomes (y-axis) is exponentially correlated with the absolute mutation rate estimated from 1,000 downsampled genomes (x-axis). Fit lines were modeled separately for human autosomes (a) and chromosome X (b). c, Estimation of the effects of regional genomic features on mutation rates. The effects of 13 genomic features at four scales (window sizes 1kb-1Mb; x-axis) on the mutation rate of 32 trinucleotide contexts (y-axis) are shown, colored by the coefficient from regressing de novo mutations (DNMs) on each specific feature and window size. Red/Blue color indicates a positive/negative effect of increasing the feature value on mutation rates; grey crosses indicate significant features at the smallest possible window size after Bonferroni correction for 13×4=52 tests. Abbreviations: LCR=low-complexity region, SINE/LINE=short/long interspersed nuclear element, Dist=Distance, Recomb=Recombination, Methyl=Methylation. d,e, The distribution of Gnocchi score as a function of expected and observed variation. Each point represents the Gnocchi score of a 1kb window on the genome (N=1,984,900 on autosomes (d) and N=57,729 on chromosome X (e)), which quantifies the deviation of observed variation from expectation. A positive Gnocchi score (red) indicates depletion of variation (observed<expected) and the higher the score the stronger the depletion; the red dashed line indicates the 99th percentile of Gnocchi scores across the autosomes (d) or chromosome X (e).
Extended Data Fig. 2:
Comparison of Gnocchi score between coding and non-coding regions. a, The proportion of highly constrained windows (Gnocchi≥4) as a function of the percentage of coding sequences in a window (left to right: N=1,906/49,525, 3,244/55,676, 2,240/18,461, 1,506/7,094, 969/3,519, 569/1,946, 364/1,223, 283/910, 243/724, 10,392/30,138). The intervals (x-axis) are left exclusive and right inclusive. “Exonic only” refers to the 1kb windows created from directly concatenating coding exons into 1kb sequences. Error bars indicate standard errors of the proportions. b, The exonic-only regions (N=27,875; purple) present a significantly higher Gnocchi score than regions that are exclusively non-coding (N=1,843,559; blue). Dashed lines indicate the medians. c, The proportion of highly constrained windows (Gnocchi≥4) as a function of the proportion of exonic windows being added to the dataset of non-coding windows. d, Gnocchi score percentiles of non-coding versus exonic windows. About 0.05% (100–99.95%) and 3.12% (100–96.88%) of the non-coding windows exhibit similar constraint to the 90th and 50th of exonic regions, respectively.
Extended Data Fig. 3:
Estimation of constraint for aggregated regulatory annotations. a,b, Gnocchi scores of aggregated promoter (dark purple), enhancer (light purple), microRNA (miRNA; dark blue), and long non-coding RNA (lncRNA; light blue) annotations are compared against those of exonic (a) and non-coding (b) regions at a 1kb scale. The Gnocchi score percentiles of each annotation (y-axis) are benchmarked by the score deciles of exonic or non-coding regions (10–100 percentiles; x-axis); the grey dashed vertical line indicates the median (50th percentile).
Extended Data Fig. 4:
Applications of Gnocchi for characterizing non-coding regions in addition to existing functional annotations. a, Use of Gnocchi for prioritizing non-coding regions with or without a regulatory annotation (N=464,504 and 1,379,055, respectively). Constrained non-coding regions are enriched for GWAS variants, independent of the candidate cis-regulatory element (cCRE) annotation from ENCODE. Error bars indicate 95% confidence intervals of the odds ratios. b, Use of Gnocchi in statistical fine-mapping. The increase in posterior inclusion probability (PIP) when incorporating Gnocchi score as a functional prior into previous fine-mapping results (that used a uniform prior; denoted as PIPGnocchi and PIPunif, respectively) is shown for 164 new likely causal associations with a PIPGnocchi ≥0.8 as a function of PIPGnocchi.
Extended Data Fig. 5:
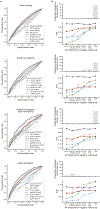
Comparison of Gnocchi and other predictive metrics in prioritizing non-coding variants. a, Receiver operating characteristic (ROC) curves of Gnocchi and other seven metrics in classifying putative functional non-coding variants (“positive” variant set) – left to right: 9,229 GWAS Catalog variants, 2,191 GWAS fine-mapping variants, a subset of 140 high-confidence fine-mapped variants, and 1,026 likely pathogenic variants – against “negative” variant set randomly drew from the population with a similar allele frequency (AF). AF>5% and allele count (AC)=1 were applied respectively for matching the three GWAS variant sets and the likely pathogenic variant set, based on their AF distributions in TOPMed (shown in b). b, AUCs of the classification with a varying AF threshold for the negative variant set. As most GWAS variants are common and most likely pathogenic variants are very rare (not seen in the population), AF>5% and AC=1 were applied respectively in the primary analyses shown in a.
Extended Data Fig. 6:
Comparison of constraint scores built from different mutational models and genomic windows. Gnocchi (presented in this study) outperforms the scores rebuilt from mutational models that only consider local sequence context – trinucleotide (trimer-only) or heptanucleotide (heptamer-only) – without adjustment on mutation rate by regional genomic features, and the performance is robust to the artificial break of genomic windows when computed at a 1kb sliding by 100bp scale.
Extended Data Fig. 7:
Pairwise correlations between different constraint/conservation metrics. The Spearman’s rank correlation between each pair of the eight metrics was computed based on the mean value of each score on 1kb windows across the genome.
Extended Data Fig. 8:
Power of constraint detection. a,b, The sample size required for well-powered non-coding constraint detection. The percentage of non-coding regions powered to detect constraint (Gnocchi≥4) at a 1kb (a) and 100bp (b) scale under varying levels of selection (depletion of variation) is shown as a function of log-scaled sample size. Lighter color indicates milder deletion of variation (weaker selection), which requires a larger sample size to detect constraint; the grey dashed vertical line indicates the current sample size of 76,156 genomes. Dotted curves (left to right) benchmark the 95th, 90th, and 50th percentile of depletion of variation observed in coding exons of similar size. The number of samples required to obtain an 80% detection power is labeled at corresponding benchmarks. c, AUCs of Gnocchi scores computed on different window sizes in identifying putative functional non-coding variants. 1kb (used in this study) presents the optimal window size with high performance while maintaining reasonable resolution. d, AUCs of Gnocchi scores computed from different subsets of gnomAD in identifying putative functional non-coding variants. While with an equal sample size, the downsampled dataset with diverse ancestries presents higher performance than the Non-Finnish European (NFE)-only dataset.
Fig. 1:
Fig. 1:
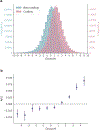
Distribution of Gnocchi scores across the genome. a, Histograms of Gnocchi scores for 1,984,900 1kb windows across the human autosomes. Windows overlapping coding regions (N=141,341 with ≥ 1bp coding sequence; red) overall exhibit a higher Gnocchi score (stronger negative selection) than windows that are exclusively non-coding (N=1,843,559; blue); dashed lines indicate the medians. b, The correlation between Gnocchi score and the adjusted proportion of singletons (APS) score developed for structural variation (SV) constraint. A collection of 116,184 autosomal SVs were assessed using Gnocchi by assigning each SV the highest Gnocchi score among all overlapping 1kb windows, which shows a significant positive correlation with the SV constraint metric APS. Error bars indicate 100-fold bootstrapped 95% confidence intervals of the mean values.
Fig. 2:
Fig. 2:
Correlation between Gnocchi and functional non-coding annotations. a,b, Distributions of candidate regulatory elements (a) and GWAS variants (b) along the spectrum of Gnocchi in non-coding regions. Enrichment was evaluated by comparing the proportion of non-coding 1kb windows, binned by Gnocchi, that overlap with a given functional annotation to the genome-wide average. Error bars indicate 95% confidence intervals of the odds ratios. cCRE, candidate cis-regulatory element: N=34,803 with a promoter-like signature (PLS), N=141,830 with a proximal enhancer-like signature (pELS), N=667,599 with a distal enhancer-like signature (dELS), N=56,766 bound by CTCF without a regulatory signature (CTCF-only); Super enhancers: N=331,601; FANTOM enhancers: N=63,285; GWAS Catalog: N=111,308 variants with an association P ≤5.0×10⁻⁸, N=9,229 with an independent replication; GWAS fine-mapping: N=2,191 variants fine-mapped with a posterior inclusion probability of causality≥0.9. See Methods for details on data collection. c, Enrichment of fine-mapped variants in constrained non-coding regions (Gnocchi≥4). Credible set (CS)-trat pairs with a significant enrichment are shown, ordered by the lower bound of 95% confidence interval; only lower bounds are shown for presentation purposes. d, The distribution of variants fine-mapped for coronary artery disease (CAD) in constrained regions (Gnocchi≥4) of PLG. Each bar shows the Gnocchi score of a 1kb window (gaps indicate windows removed by quality filters); windows containing fine-mapped variants are colored by purple, and the number of variants in each window is annotated on top of the bar correspondingly. Ten variants are located within PLG introns, four are mapped to the antisense gene of PLG (ENSG00000287558), and 14 reside in the downstream intergenic regions.
Fig. 3:
Fig. 3:
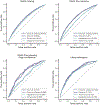
Performance of Gnocchi and other predictive metrics in prioritizing non-coding variants. a,b, Receiver operating characteristic (ROC) curves of Gnocchi and other seven metrics in classifying putative functional non-coding variants – 2,191 GWAS fine-mapping variants (a) and 1,026 likely pathogenic variants (b) – against background variants in the population. The performance of each metric was measured and ranked by the area under curve (AUC) statistic. c,d, The relative contribution of different metrics in classifying GWAS variants (b) and likely pathogenic variants (c). The eight metrics were modeled as eight independent predictors for the classification, and the relative contribution of one predictor over another was evaluated by estimating their additional R2contributions across all subset models.
Fig. 4:
Fig. 4:
Contribution of non-coding constraint in evaluating copy number variants (CNVs). a, Proportions of constrained CNVs (Gnocchi≥4) identified in individuals with developmental delay (DD cases) versus healthy controls. Constrained CNVs are more common in DD cases than controls (7,239/17,004=42.6% versus 10,403/83,526=12.5%) and are most frequent for CNVs previously implicated as pathogenic (18/19=94.7% by DD and 3,433/4,014=85.5% by ClinVar). Error bars indicate standard errors of the proportions. b, Contribution of non-coding constraint to predicting CNVs in DD cases versus controls. Non-coding constraint remains a significant predictor for the case/control status of CNVs after adjusting for gene constraint (LOEUF score), gene number, and size of CNVs (Ncase=17,004, Ncontrol=83,526; purple), as well as being tested in the subset of non-coding CNVs (Ncase=8,702, Ncontrol=66,795; blue). Error bars indicate 95% confidence intervals of the log odds ratios. c, CNVs at the IHH locus associated with synpolydactyly and craniosynostosis. The four implicated duplications (grey horizontal bars) span a ~102kb sequence upstream of IHH. Each vertical bar shows the Gnocchi score of a 1kb window within the locus, with the highest score overlapping the IHH gene (red) and the highest non-coding score overlapping the major IHH enhancers (purple); gaps indicate windows removed by quality filters. d, Non-coding CNVs with the highest Gnocchi score identified in DD cases. The highest-scored window is located within the potential “critical region” (purple vertical bars) shared by 12 DD deletions (red horizontal bars; grey indicates two deletions observed in controls). The critical region overall, has a significantly higher Gnocchi score than the other regions affected by DD or control deletions, as shown in the kernel density estimate (KDE) plot on the right.
Fig. 5:
Fig. 5:
Correlation of constraint between non-coding regulatory elements and protein-coding genes. a, The proportion of non-coding 1kb windows overlapping with enhancers that were predicted to regulate specific genes, as a function of their Gnocchi scores. More constrained non-coding regions are more frequently linked to a gene (left to right: N=2,022/62,894, 2,743/62,653, 7,475/134,279, 20,383/252,354, 43,414/376,829, 66,343/417,743, 65,343/313,110, 38,785/152,787, 15,417/51,439, 6,663/19,471). Error bars indicate standard errors of the proportions. b, Comparison of the Gnocchi scores of enhancers linked to constrained and unconstrained genes. Enhancers of established sets of constrained genes (four blue boxes: N=189 haploinsufficient genes, N=2,454 essential genes, N=1,771 autosomal dominant disease genes, N=1,920 LOEUF-predicted constrained genes) are more constrained than enhancers of presumably less constrained genes (two grey boxes: N=356 olfactory receptor genes, N=189 LOEUF-predicted unconstrained genes). Enhancers of genes that are underpowered for gene constraint detection (“LOEUF underpowered”, N=1,117) present a higher constraint than those powered yet unconstrained genes (“LOUEF unconstrained”). The box plots show the distribution of Gnocchi scores of enhancers linked to different gene sets, denoting the median, quartiles and range (excepting outliers). c, Improvement of incorporating enhancer constraint into LOEUF in prioritizing underpowered genes. ROC curves and AUCs show the performance of two logistic regression models using LOEUF (blue) and LOEUF+enhancer Gnocchi score (purple) as independent predictive variables to classify constrained and unconstrained genes, tested on a set of 77 underpowered genes. d, Contribution of enhancer constraint to predicting gene expression in specific tissue types. The x-axis shows the linear regression coefficient of tissue-specific enhancer Gnocchi score predicting the expression level of target genes in matched tissue types (NHSC&B-cell=11,970, NBrain=11,555, NHeart=10,759, NPancreas=10,572, NBlood&T-cell=10,403, NMuscle=10,380, NAdipose=9,316, NLiver=8,838, NSpleen=8,308, NOvary=7,926, NLung=7,499), conditioning on gene constraint (LOEUF score). Error bars indicate 95% confidence intervals of the coefficient estimates.

References

    1. Short PJ et al. De novo mutations in regulatory elements in neurodevelopmental disorders. Nature 555, 611–616, doi:10.1038/nature25983 (2018). - DOI - PMC - PubMed
    1. Satterstrom FK et al. Large-Scale Exome Sequencing Study Implicates Both Developmental and Functional Changes in the Neurobiology of Autism. Cell 180, 568–584 e523, doi:10.1016/j.cell.2019.12.036 (2020). - DOI - PMC - PubMed
    1. Singh T et al. The contribution of rare variants to risk of schizophrenia in individuals with and without intellectual disability. Nat Genet 49, 1167–1173, doi:10.1038/ng.3903 (2017). - DOI - PMC - PubMed
    1. Ganna A et al. Quantifying the Impact of Rare and Ultra-rare Coding Variation across the Phenotypic Spectrum. Am J Hum Genet 102, 1204–1211, doi:10.1016/j.ajhg.2018.05.002 (2018). - DOI - PMC - PubMed
    1. Karczewski KJ et al. The mutational constraint spectrum quantified from variation in 141,456 humans. Nature 581, 434–443, doi:10.1038/s41586-020-2308-7 (2020). - DOI - PMC - PubMed

LinkOut - more resources