Comparative Study
. 2024 Nov;635(8039):668-678.
doi: 10.1038/s41586-023-06806-x. Epub 2023 Dec 6.

A human embryonic limb cell atlas resolved in space and time

Affiliations
Comparative Study

A human embryonic limb cell atlas resolved in space and time

Bao Zhang et al. Nature. 2024 Nov.

Abstract

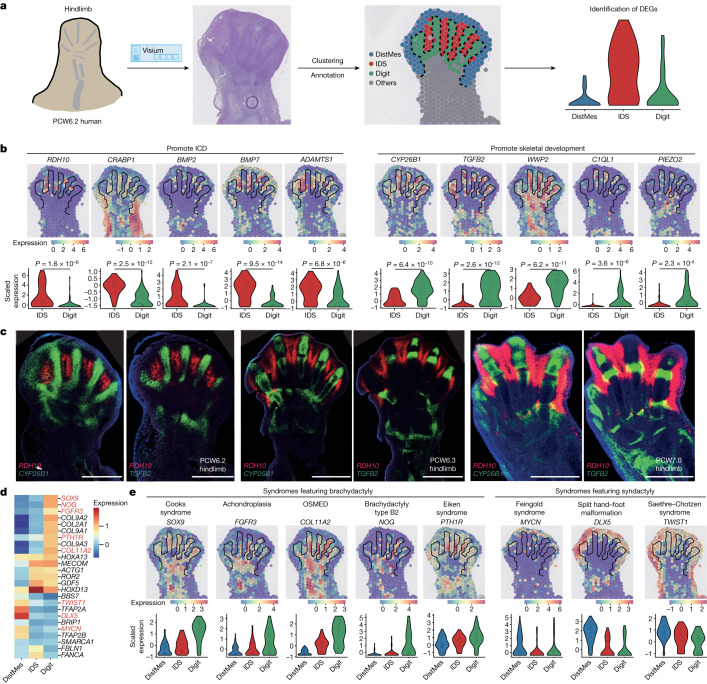
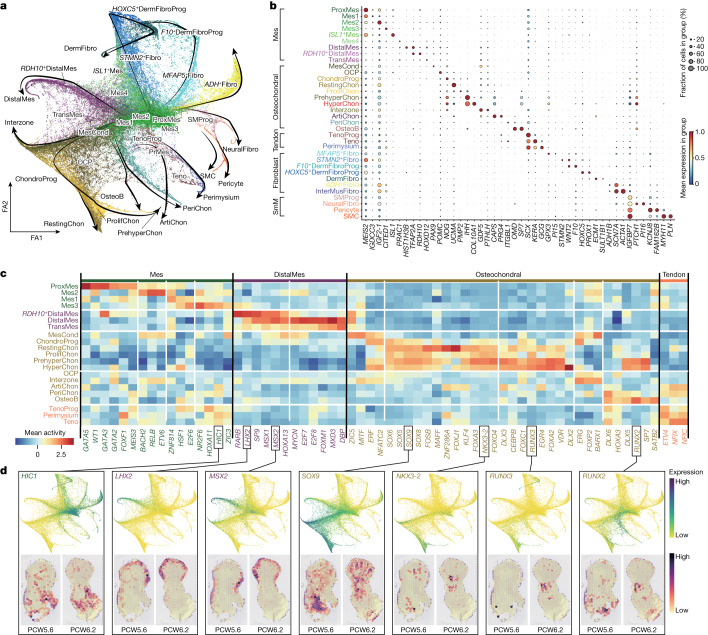
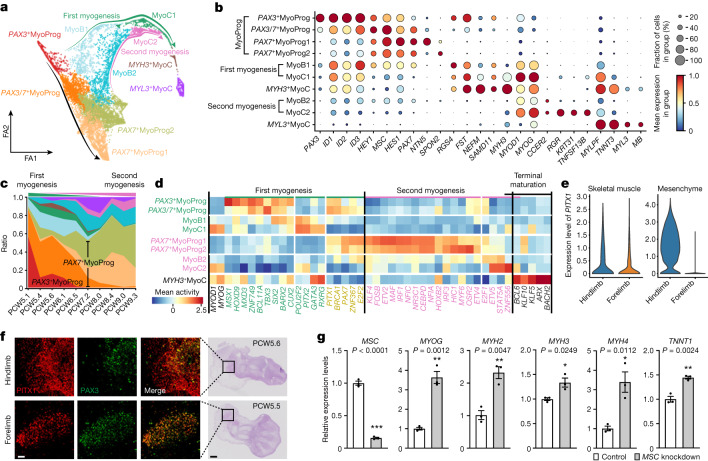
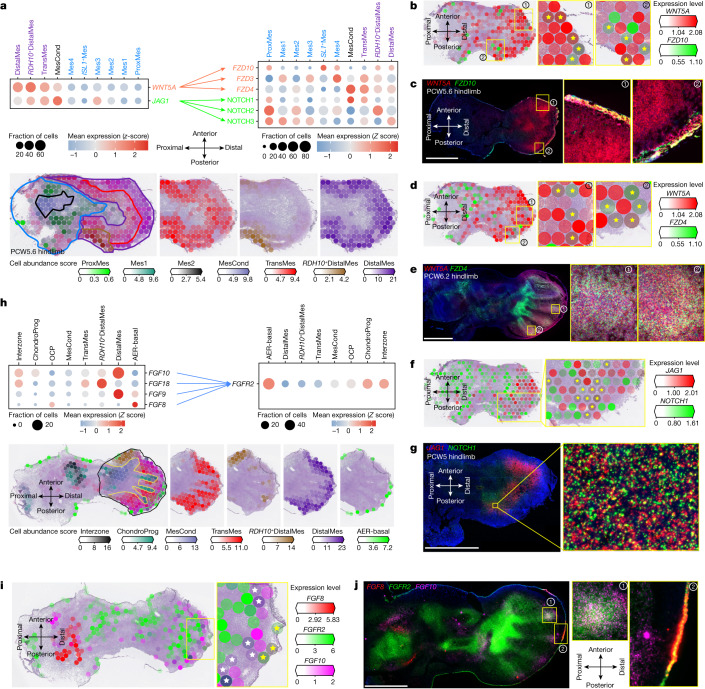
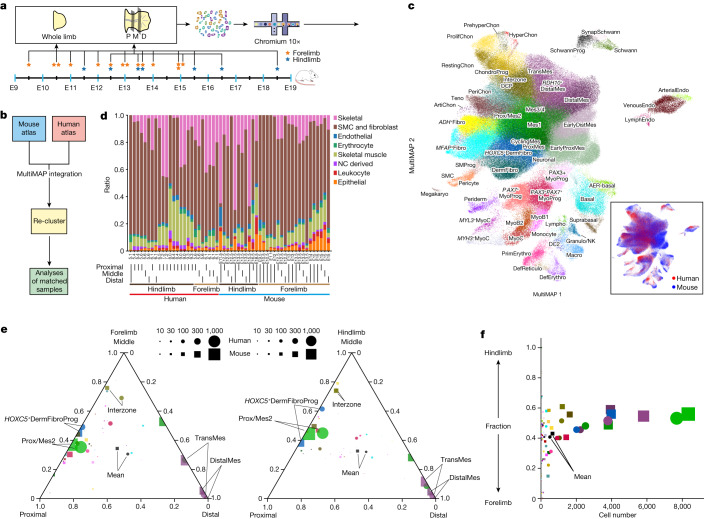
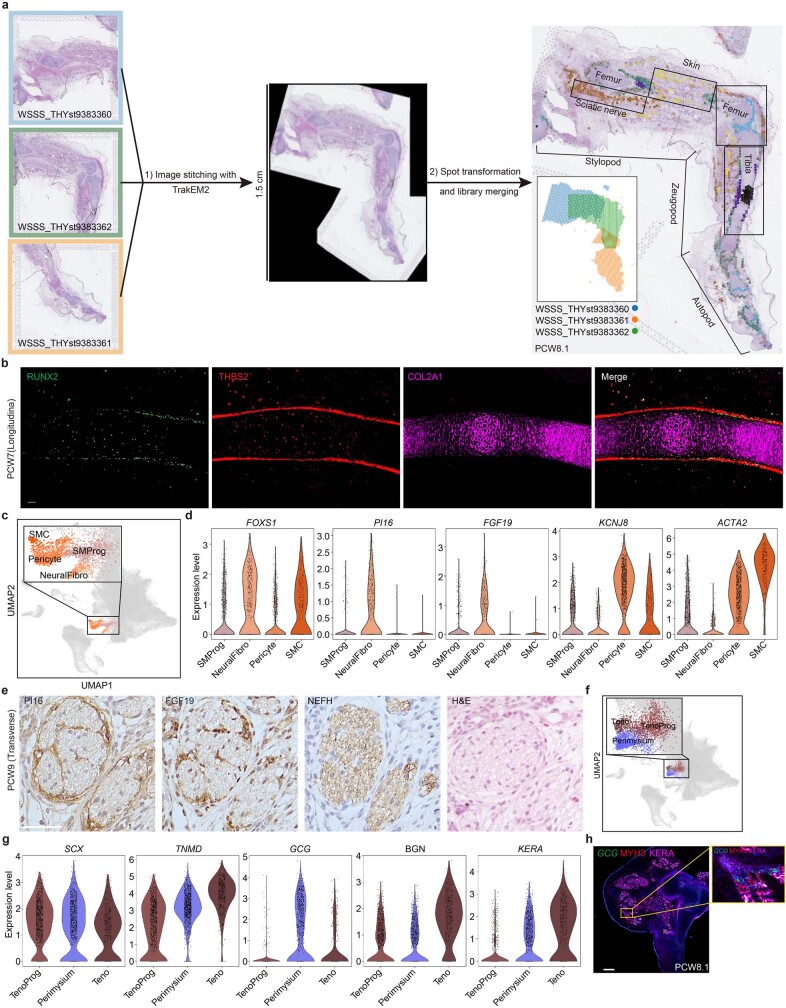
Human limbs emerge during the fourth post-conception week as mesenchymal buds, which develop into fully formed limbs over the subsequent months1. This process is orchestrated by numerous temporally and spatially restricted gene expression programmes, making congenital alterations in phenotype common2. Decades of work with model organisms have defined the fundamental mechanisms underlying vertebrate limb development, but an in-depth characterization of this process in humans has yet to be performed. Here we detail human embryonic limb development across space and time using single-cell and spatial transcriptomics. We demonstrate extensive diversification of cells from a few multipotent progenitors to myriad differentiated cell states, including several novel cell populations. We uncover two waves of human muscle development, each characterized by different cell states regulated by separate gene expression programmes, and identify musculin (MSC) as a key transcriptional repressor maintaining muscle stem cell identity. Through assembly of multiple anatomically continuous spatial transcriptomic samples using VisiumStitcher, we map cells across a sagittal section of a whole fetal hindlimb. We reveal a clear anatomical segregation between genes linked to brachydactyly and polysyndactyly, and uncover transcriptionally and spatially distinct populations of the mesenchyme in the autopod. Finally, we perform single-cell RNA sequencing on mouse embryonic limbs to facilitate cross-species developmental comparison, finding substantial homology between the two species.


Conflict of interest statement

Competing interests: In the past 3 years, S.A.T. has consulted for or been a member of scientific advisory boards at Qiagen, Sanofi, GlaxoSmithKline and ForeSite Labs. She is a consultant and equity holder for TransitionBio and EnsoCell. J.C.M has been an employee of Genentech, Inc. since September 2022. The remaining authors declare no competing interests.

Figures

Fig. 1
Fig. 1. A single-cell temporal–spatial atlas of the human embryonic limb.
a, Overview of samples and the experimental scheme. The stars indicate timepoints. D, distal; M, middle; P, proximal. b, Uniform manifold approximation and projection (UMAP) visualization of 125,955 human embryonic limb cells with cluster labels (see Supplementary Information). c,d, Spatially resolved heatmaps across tissue sections from the PCW6.2 (c) and PCW8.1 (d) human hindlimbs assembled from three slides showing population abundance and corresponding marker genes. Source Data
Fig. 2
Fig. 2. Spatial expression pattern of genes involved in digit formation and phenotype.
a, Scheme to identify genes involved in digit formation and interdigital cell death (ICD). DEG, differentially expressed gene; DistMes, distal mesenchyme; IDS, interdigital space. b,e, Spatial expression (normalized and log-transformed) of genes promoting ICD (b, left panel) and digital tissue survival (b, right panel) and genes associated with digit malformation (e) in the PCW6.2 human hindlimb, and their distributions in IDS and digit regions (P values were determined by Wilcoxon rank sum test). OSMED, otospondylomegaepiphyseal dysplasia. c, RNA-ISH of RDH10, CYP26B1 and TGFB2 in the human hindlimb. Scale bars, 1 mm. d, Heatmap showing the expression (Z scores) of genes associated with digit malformation. Source Data
Fig. 3
Fig. 3. Cell lineage diversification and transcription factor specificity of LPM during human embryonic limb development.
a, Force-directed graph layout of cells associated with the LPM, coloured by cell clusters. The black arrows indicate differentiation directions. Cluster abbreviations are the same as in Fig. 1. FA, force atlas. b, Dot plot showing selected marker genes for each cell cluster. The colour bar indicates the average expression level in linearly scaled values. c, Heatmap illustrating the vertically normalized mean activity of selected genes encoding transcription factors for each cell cluster. d, Force-directed graph (top) and Visium heatmaps (bottom) from the human hindlimb showing the expression of genes encoding transcription factors (normalized and log-transformed). Source Data
Fig. 4
Fig. 4. Cell trajectory and transcription factors of embryonic and fetal limb myogenesis.
a, Force-directed graph layout of cells associated with the myogenesis, coloured by cell clusters. The green and pink arrows indicate the direction of first and second myogenesis, separately. MyoB, myoblast; MyoC, myocyte; MyoProg, myogenic progenitor. b, Dot plot showing expression pattern of selected marker genes. The colour bar indicates the average expression level in linearly scaled values. c, Fraction of cell type per timepoint. d, Heatmap illustrating the vertically normalized mean activity of filtered genes encoding transcription factors for each cell cluster. e, Violin plot showing the expression level of PITX1 in human forelimb and hindlimb at PCW5.6. f, Immunofluorescence co-staining (scale bar, 50 μm) of PITX1 and PAX3 on hindlimb (top panels) and forelimb (bottom panels) sections (scale bar, 200 μm). Hindlimb, n = 4; forelimb, n = 2. g, RT–qPCR analysis of the fold-enrichment myocyte genes upon knockdown of MSC in human primary embryonic myoblasts. Data are presented as mean ± s.e.m. P values are from two-sided Student’s t-tests. n = 2 embryos and 3 independent experiments with similar results. Source Data
Fig. 5
Fig. 5. Spatially resolved cell–cell communication.
a, Dot plots showing expression (Z score) of ligands and cognate receptors in cell clusters (top), and heatmaps showing predicted cell-type abundance (bottom). b,d,f, Visium heatmaps of the hindlimb at PCW5.6 showing expression (normalized and log-transformed) of WNT5A (b,d), JAG1 (f) and their cognate receptors FZD10 (b), FZD4 (d) and NOTCH1 (f). The yellow stars indicate both the ligand and its receptor expressed. c,e,g, RNA-ISH expression of WNT5A (c,e), JAG1 (g) and their cognate receptors FZD10 (c), FZD4 (e) and NOTCH1 (g) in situ. Scale bars, 1 mm. h, Dot plots of FGFR2 expression and its ligands (top), and Visium heatmaps of a PCW6.2 human hindlimb showing spatially resolved selected mesenchymal cell cluster (separated by colour) signatures (bottom). i, Visium heatmaps of a PCW6.2 human hindlimb showing expression of FGF8, FGF10 and FGFR2. The yellow stars indicate that both FGF8 and FGFR2 are expressed. The white stars denote that both FGF10 and FGFR2 are expressed. j, RNA-ISH of FGF8, FGF10 and FGFR2 expression in the PCW6.2 hindlimb. Source Data
Fig. 6
Fig. 6. Comparison of a single-cell atlas between human and mouse limb.
a, Overview of mouse sampling and the experimental scheme. The stars indicate timepoints. b, Overview of the analysis pipeline to integrate human and mouse scRNA-seq data. c, MultiMAP layout of integrated cells, coloured by integrated cell-type annotation or species (bottom right). Cluster abbreviations are the same as in Fig. 1. d, Broad cell-type proportions of each scRNA-seq library, with dissection region, location and species labelled at the bottom. NC, neural crest. e,f, Triangular diagrams (e) showing the cell-type proportion biases towards the proximal, middle or distal region of the human and mouse forelimb (left) and hindlimb (right), and a scatter plot (f) showing the fraction of hindlimb representation of each cell type. Each cell type or mean is represented by a circle (human) and a square (mouse), with size (square of diameter) denoting the average number of cells per segment (proximal, middle or distal). Source Data
Extended Data Fig. 1
Extended Data Fig. 1. Data quality and preprocessing of human scRNA-seq and spatial visium data.
a, Bar plot and violin plot showing the sample size and per-cell quality of each library, separately, coloured by stage. b, Dot plot showing the expression level of marker genes for each cell cluster. The colour bar indicates the linearly scaled mean of expression level. Cluster abbreviations same as Fig. 1. c, Bar plot and violin plot showing the number of voxels and per-voxel quality of each 10x Visium library, separately, coloured by stage (n = 1 library per bar/violin). d, Scatter plot showing the reconstruction accuracy of cell2location. Source Data
Extended Data Fig. 2
Extended Data Fig. 2. The heterogeneity of epidermis and fibroblast.
a, Uniform manifold approximation and projection (UMAP) visualization of AER-basal, basal and periderm cells. b, Violin plot showing the normalised and log-transformed expression level of WNT6, CYP26A1, SP8, ETV4 and FGF8 in AER-basal, basal and periderm cells. c, UMAP (left panel) and violin plot (right panel) showing the normalised and log-transformed expression level of FGF8 in the human limb. ProxMes, proximal mesenchyme; TenoProg, tendon progenitor; MyoProg, myogenic progenitor; MyoB, myoblast; MyoC, Myocyte. d, Heatmap across tissue section from PCW6.2 (post conception week 6 plus 2 days) human hindlimb showing FGF8 expression. e, RNA-ISH of tissue sections from human hind limb showing the expression pattern of FGF8. Scale bar, 500 μm. f, h, Dot plot showing the expression level of marker genes for selected fibroblast (Fibro) clusters (f) and muscle interstitial fibroblast (InterMusFibro) (h). The colour bar indicates the linearly scaled values of expression level. DermFibro, dermal Fibro; DermFibroProg, DermFibro progenitor. g, i, Heatmaps across tissue sections from PCW8.1 human hindlimb showing inferred abundance of each fibroblast cluster (g) and InterMusFibro (i). j, Immunofluorescence staining of MYH3 and ALDH1A3 on the skeletal muscle tissue (as also shown by H&E staining) from a PCW9 longitudinal section. n = 2. Scale bar, 50 μm. Source Data
Extended Data Fig. 3
Extended Data Fig. 3. Dynamic changes in cell clusters of the human embryonic limb over developmental time.
a, Fraction of cell cluster per time point, coloured by cell clusters and grouped by cell compartment. Cluster abbreviations same as Fig. 1. b, Uniform manifold approximation and projection (UMAP) visualisation of cells per post conception week (PCW), coloured by cell cluster in a. Source Data
Extended Data Fig. 4
Extended Data Fig. 4. The heterogeneity of Mesenchyme.
a, Uniform manifold approximation and projection (UMAP) plot showing the cell clusters of Chondrogenic progenitor (ChondroProg), mesenchymal condensate cell (MesCond), transitional mesenchyme (TransMes) and distal mesenchyme (DistalMes) (left panel) as well as the expression level of SP9, LHX2, MSX1, IRX1 and SOX9. The colour bar indicates the normalised and log-transformed expression values. b, Heatmaps across tissue sections from human hindlimb at stage of PCW5.6 (post conception week 5 plus 6 days) and PCW6.2 showing the spatial expression pattern of SP9, LHX2, MSX1, IRX1 and SOX9. The colour bar indicates the normalised log-transformed expression values. c, d, RNA-ISH of tissue sections from human hindlimb showing the spatial expression pattern of SP9, LHX2 and MSX1 (c), as well as MSX1, IRX1 and SOX9 (d) at different stage. Scale bar, 1 mm. e, Heatmaps across tissue sections from human hindlimb at stage of PCW5.6 showing the cell cycle of G1, G2M and S phase. f, Dot plot showing the expression level of marker genes for different cell clusters of mesenchyme. The colour bar indicates the linearly scaled mean of expression level. ProxMes, proximal Mes. g, h, RNA-ISH of tissue sections from human hindlimb showing the spatial expression pattern of IRX1, SP9 and RDH10 (g), as well as MEIS2, WT1, CITED1 and ISL1 (h) n = 2-4 for RNA-ISH. Scale bar, 1 mm. Source Data
Extended Data Fig. 5
Extended Data Fig. 5. Identification of novel cell types at spatial and single-cell level.
a, The VisiumStitcher workflow for merging the 10x Visium spatial data of the human limb. b, Immunofuorescence staining of RUNX2, THBS2 and COL2A1 on the longitudinal section of the tibia from a PCW7 embryo. n = 3. Scale bar, 50 μm. c, Uniform manifold approximation and projection (UMAP) visualization of smooth muscle progenitor (SMProg), neural fibroblasts (NeuralFibro), pericyte and smooth muscle (SMC). d, Violin plot showing the expression level of FOXS1, PI16, FGF19, KCNJ8 and ACTA2 in SMProg, NeuralFibro, pericyte and SMC, using normalised and log-transformed values. e, Immunohistochemical staining of PI16 and FGF19 showing the NeuralFibro in the sciatic nerve at PCW9. The neurofilament was stained with NEFH antibody. A neighbouring section stained with H&E solution is also shown. n = 4. Scale bar, 50 μm. f, UMAP visualization of tendon progenitor (TenoProg), tenocytes (Teno) and perimysium cells. g, Violin plot showing the expression level of SCX, TNMD, GCG, BGN and KERA in TenoProg, Perimysium, and Teno. The expression level of genes is the normalised and log-transformed values. h, RNA-ISH (GCG) combined with immunohistochemistry (MYH3 and KERA) of tissue sections from human hind limb showing the spatial expression pattern of GCG, MYH3 and KERA. n = 2. Scale bar, 1 mm. Source Data
Extended Data Fig. 6
Extended Data Fig. 6. Spatial expression patterns of genes that determine human limb axis formation and morphogenesis.
a, Overview of analysis workflow to identify genes specific to spatial location. b-e, Heatmaps across tissue section from the human hindlimb at stage of PCW5.6 showing spatial expression pattern of genes specific to proximal (b), distal (c), anterior (d) or posterior (e) regions. The expression level of genes is the normalised and log-transformed values. f, Heatmaps across tissue section from human hindlimb at stage of PCW5.6 showing spatial expression pattern of homeobox (HOX) A (top panel) and D (bottom panel) family genes. g, h, Heatmaps across tissue sections from the human hindlimb at stage PCW6.2 showing inferred abundance of macrophage (g) and endothelial cells (vein endothelial cells (VeinEndo) and arterial endothelial cells (ArterialEndo), h) as well as expression of maker genes. Anter, anterior; Post, posterior; Prox, proximal; Dist, distal. The expression level of genes is the normalised and logarithmic value of raw counts. i, Spatially resolved heatmaps across tissue section from the human hindlimb at stage of PCW6.2 showing spatial expression pattern of digit-associated genes in normalized and log-transformed values. Source Data
Extended Data Fig. 7
Extended Data Fig. 7. The transcriptional regulation of LPM differentiation in the human limb.
a, Heatmap illustrating the vertically normalised mean activity of selected transcription factors for each cell type from soft connective lineage of LPM. b, Force-directed graphs (top panel) and heatmaps across tissue section from the human hindlimb at PCW5.6 and PCW6.2 (bottom panel) showing the expression pattern of representative transcription factors in normalised and log-transformed values. c, Stacked bar chart showing the fraction of cell cluster per time point, coloured by cell type and grouped by tissue type. PCW, post conception week. SmM, smooth muscle group; other abbreviations as per Fig. 1. d, Dot plot showing the expression level of marker genes of osteochondral cell clusters. The colour bar indicates the mean normalised expression level. e, Force-directed graph of cells per time point, coloured by cell type in a. f, Uniform manifold approximation and projection (UMAP) visualization of the chondrocyte lineage with arrows representing inferred differentiation directions (See Methods). g, Stacked bar chart showing the fraction of phase of cell cycle per osteochondral cell cluster. h, Force directed graph showing the expression level of SCX and SOX9. The colour bar indicates the normalised and log-transformed expression values. i, Scatter plots showing the expression level of SCX and SOX9 expression in all LPM-derived cells in normalised and log-transformed values. The percentages of double positive cells are given. j, Heatmap across tissue section from the human hindlimb at PCW6.2 showing SCX and SOX9 expression in normalised and log-transformed values. The voxels marked with yellow asterisks express both SCX and SOX9. k, RNA-ISH of tissue sections from the human hindlimb showing the expression of SCX and SOX9 in situ. Source Data
Extended Data Fig. 8
Extended Data Fig. 8. The transcriptional regulation of myogenesis in human and mouse.
a, Dot plot showing expression level of transcription factors per cell cluster in humans, coloured by group (green, first myogenesis; pink, second myogenesis; yellow, both). The colour bar indicates the linearly scaled mean of expression level. MyoProg, myogenic progenitor; MyoB, myoblast; MyoC, myocyte. b, Force-directed graph showing muscle populations per time point. c, Force-directed graph showing the expression of PITX1 between forelimb (left panel) and hindlimb (right panel) in cells derived from mesenchyme and skeletal muscle lineage. The expression level of genes is the normalised and logarithmic value of raw counts. d, Force-directed graph of human and mouse skeletal muscle cells, coloured by cell clusters. e, Stacked bar chart showing the fraction of mouse cell clusters per time point, followed by the colour code of mouse cell clusters in d. f, Scatter plots of PAX3 and PAX7 expression (normalised and log-transformed) in mouse and human skeletal muscle cells. The percentages of double positive cells are given. g, Force-directed graph of mouse cells per time point, coloured by cell cluster in d. h, Dotplots of selected genes expressed in humans and mice. The colour bar indicates linearly scaled average expression levels. Source Data
Extended Data Fig. 9
Extended Data Fig. 9. Comparing human and mouse embryonic limbs.
a, Violin plots of sample quality for all the scRNA-seq data in the integrated atlas, coloured by library ID and group by dataset at the bottom. b, c, The integrated mouse scRNA-seq data projected on a shared UMAP plane, coloured by cell clusters (b) or metadata (c). d, Cell-cluster proportions of each scRNA-seq library with dissection region, location and species labelled at the bottom. e, Genes enriched in proximal or distal segments in human and mouse. f, Genes enriched in the forelimb or hindlimb in human and mouse. Source Data
Extended Data Fig. 10
Extended Data Fig. 10. The LPM lineage in human and mouse.
a, Force-directed graph of human and mouse LPM-derived cells, coloured by cell clusters. b, Stacked bar chart showing the fraction of mouse cell clusters per time point, followed by the colour code of mouse cell clusters in a. c, Force-directed graph of mouse cells per time point, coloured by cell cluster in a. d, Dotplot of selected genes expressed in human and mouse. The colour bar indicates the linearly scaled average expression levels. e, UMAP plot showing the expression of Fgf8 in mouse limb cell atlas. The expression level of gene on the left is the normalised and logarithmic value of raw counts. f, Violin plot showing the normalised and log-transformed expression level of Fgf8 in cell clusters of mouse. Source Data

References

    1. Zuniga, A. Next generation limb development and evolution: old questions, new perspectives. Development142, 3810–3820 (2015). - PubMed
    1. Wilkie, A. O. M. Why study human limb malformations? J. Anat.202, 27–35 (2003). - PMC - PubMed
    1. Chevallier, A., Kieny, M. & Mauger, A. Limb-somite relationship: origin of the limb musculature. J. Embryol. Exp. Morphol.41, 245–258 (1977). - PubMed
    1. Tabin, C. & Wolpert, L. Rethinking the proximodistal axis of the vertebrate limb in the molecular era. Genes Dev.21, 1433–1442 (2007). - PubMed
    1. McQueen, C. & Towers, M. Establishing the pattern of the vertebrate limb. Development147, dev177956 (2020). - PubMed

Publication types

MeSH terms

Substances