. 2024 Jan;625(7994):377-384.
doi: 10.1038/s41586-023-06816-9. Epub 2023 Dec 6.

Dictionary of immune responses to cytokines at single-cell resolution

Affiliations

Dictionary of immune responses to cytokines at single-cell resolution

Ang Cui et al. Nature. 2024 Jan.

Abstract

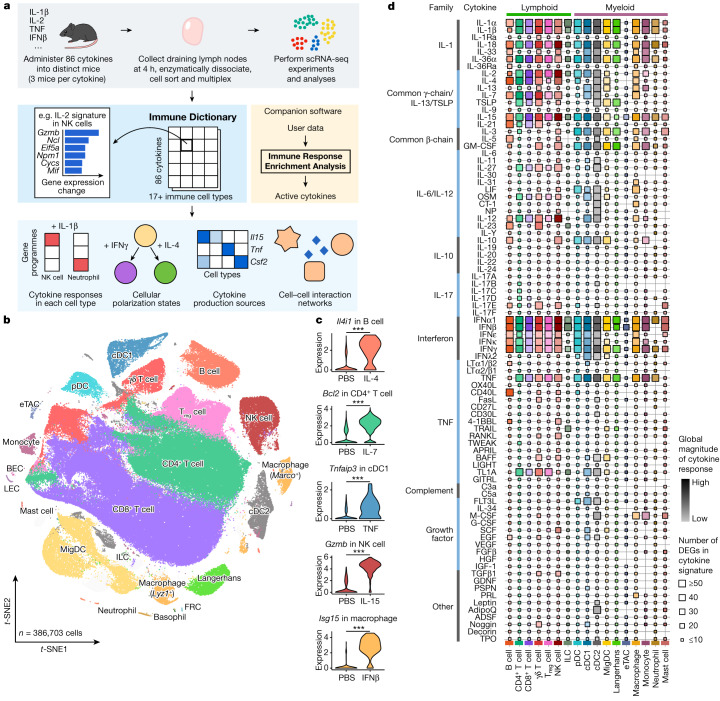
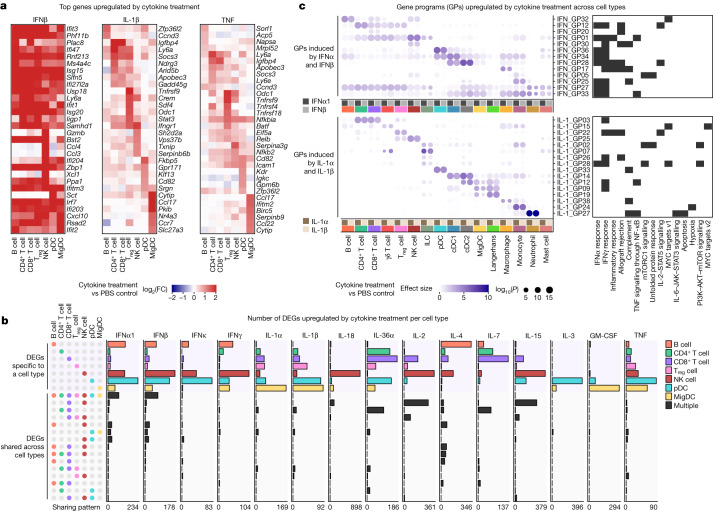
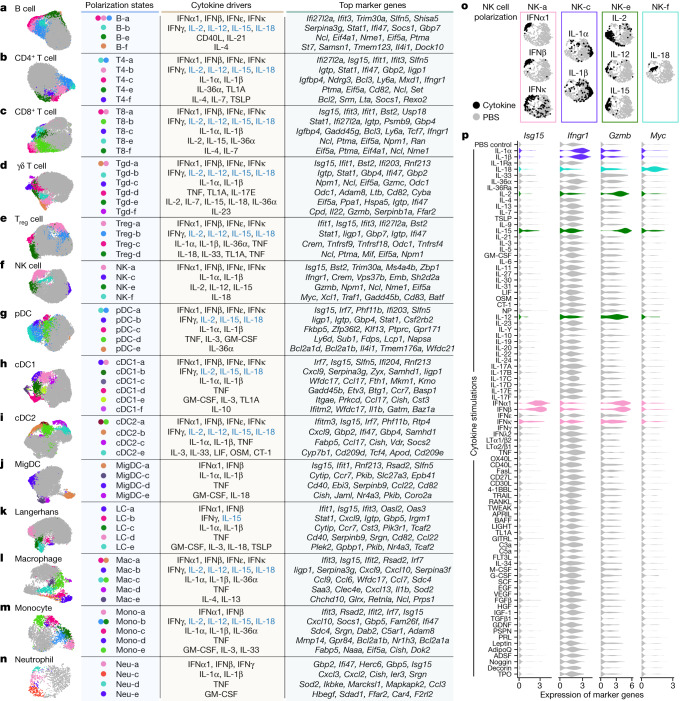
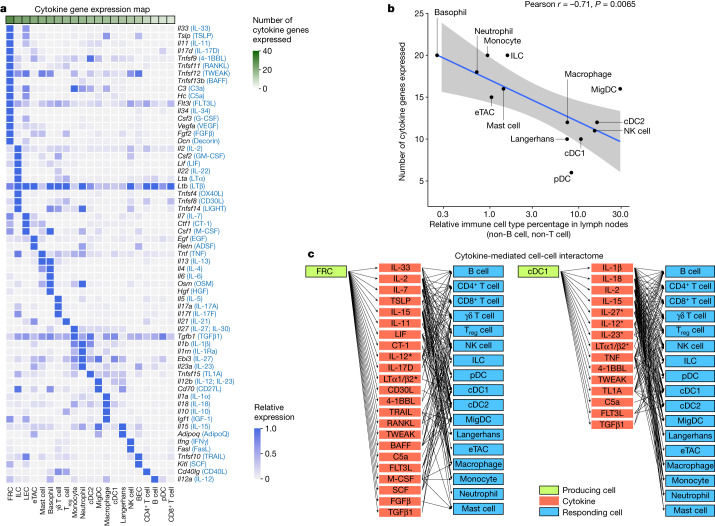
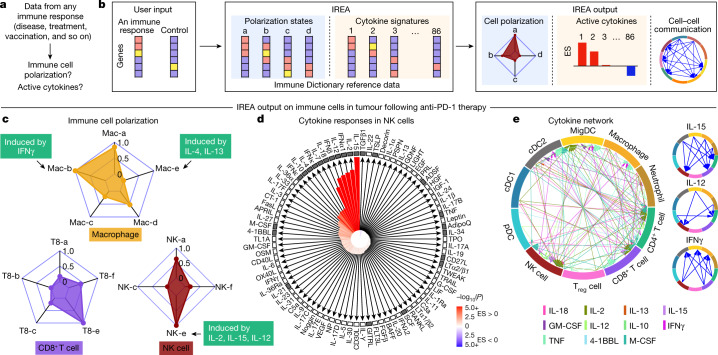
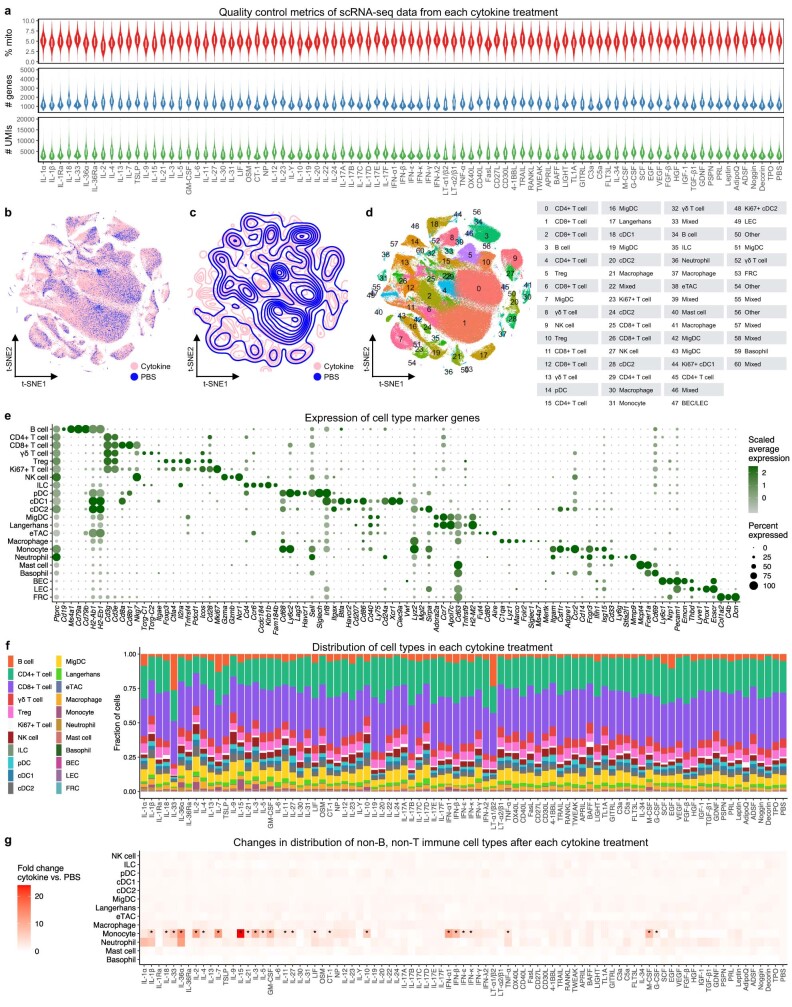
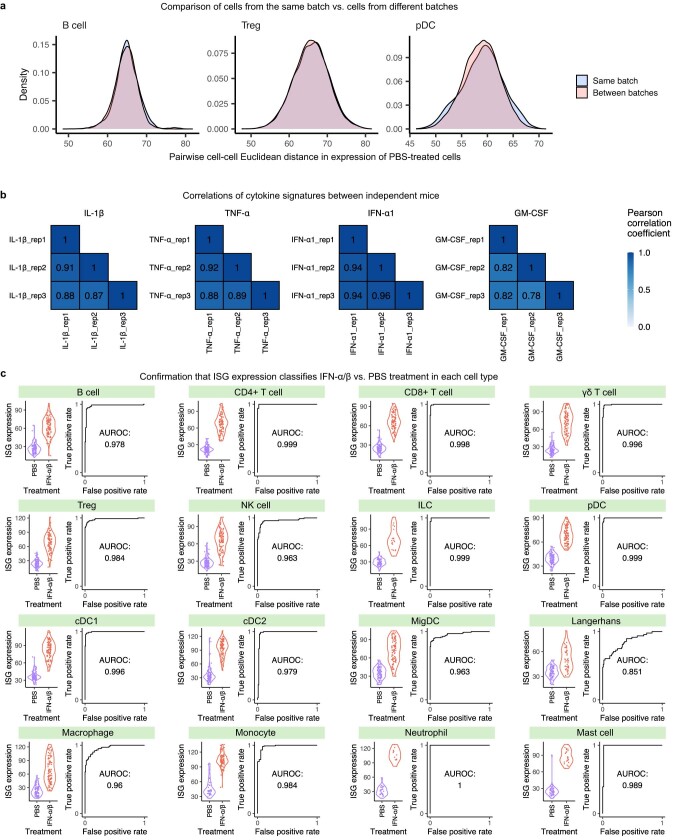
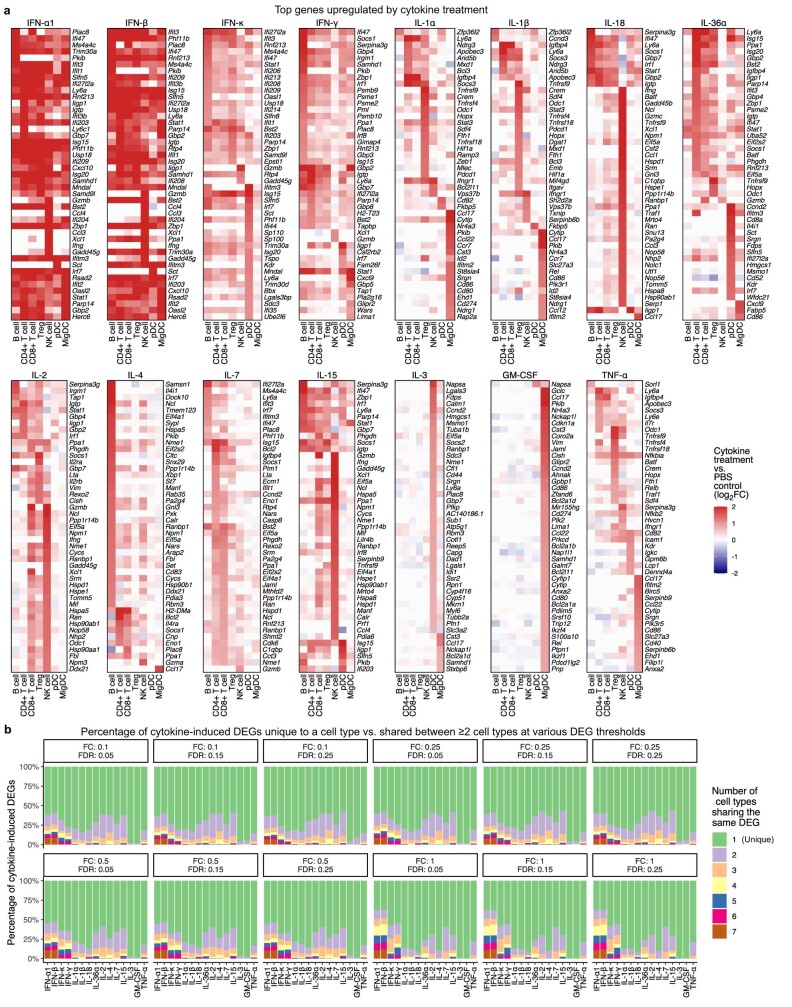
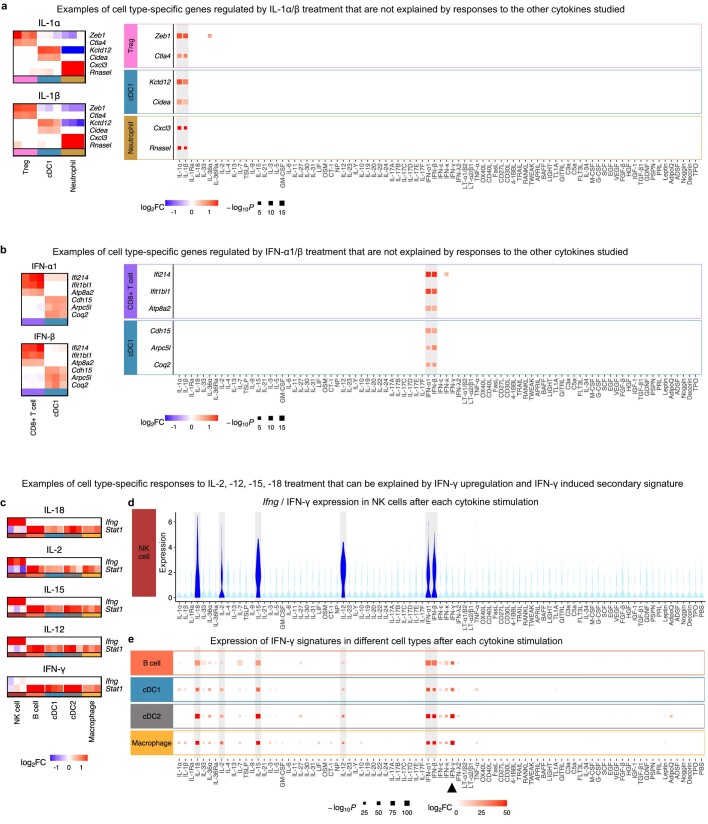
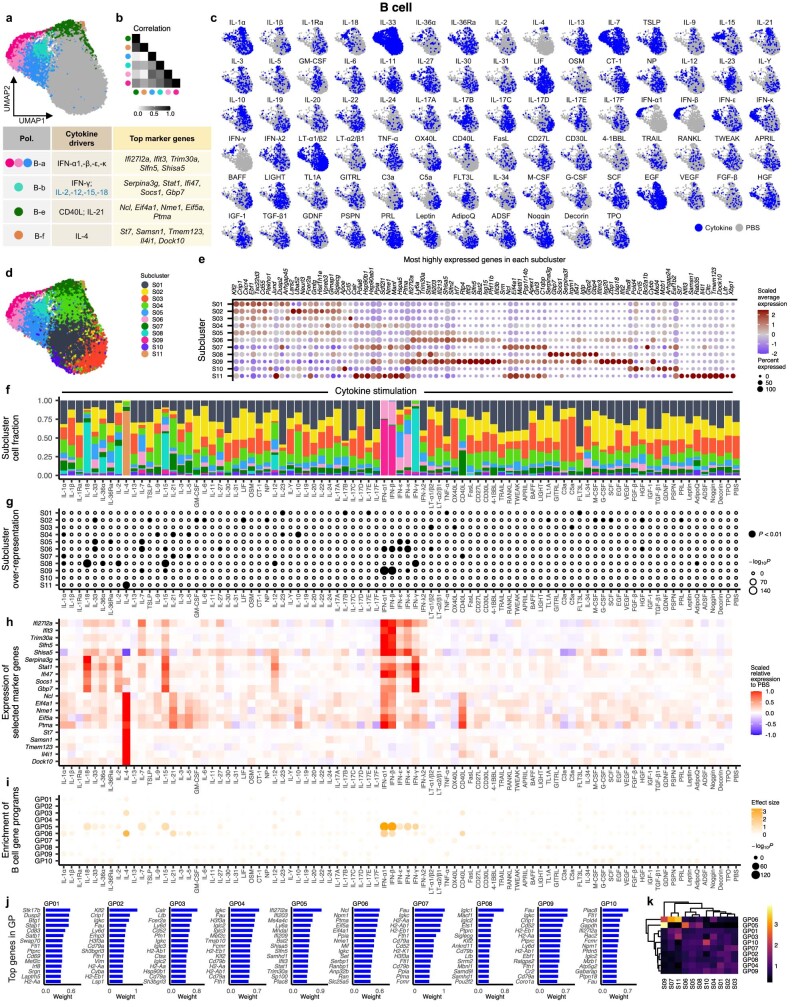
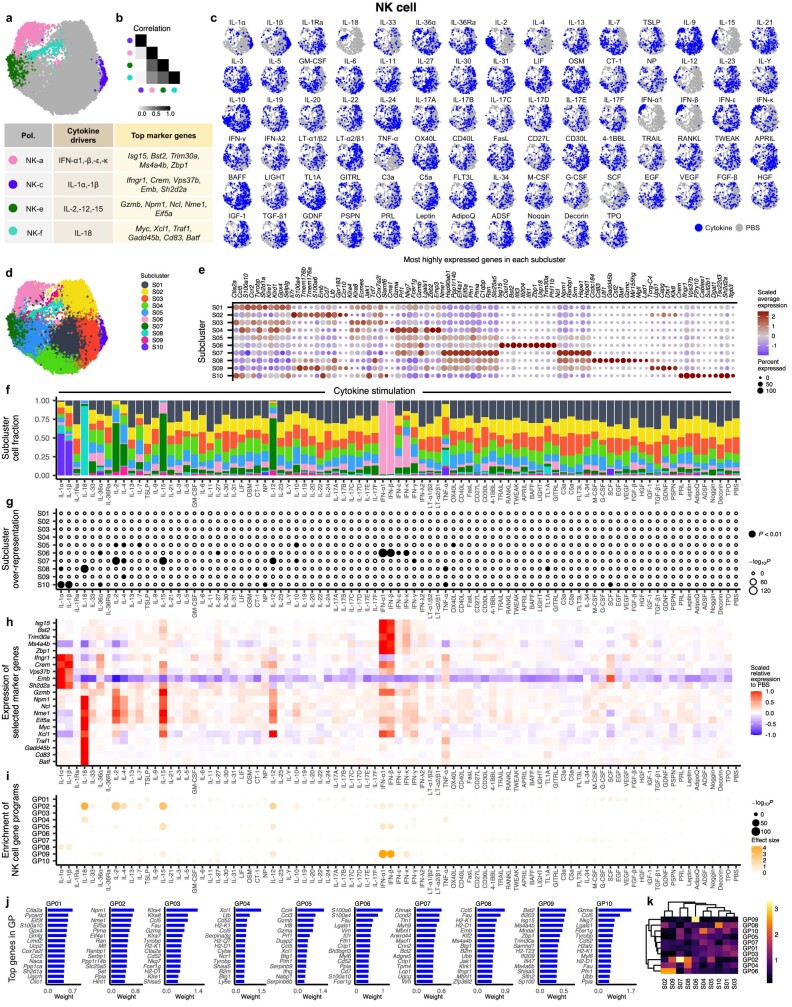
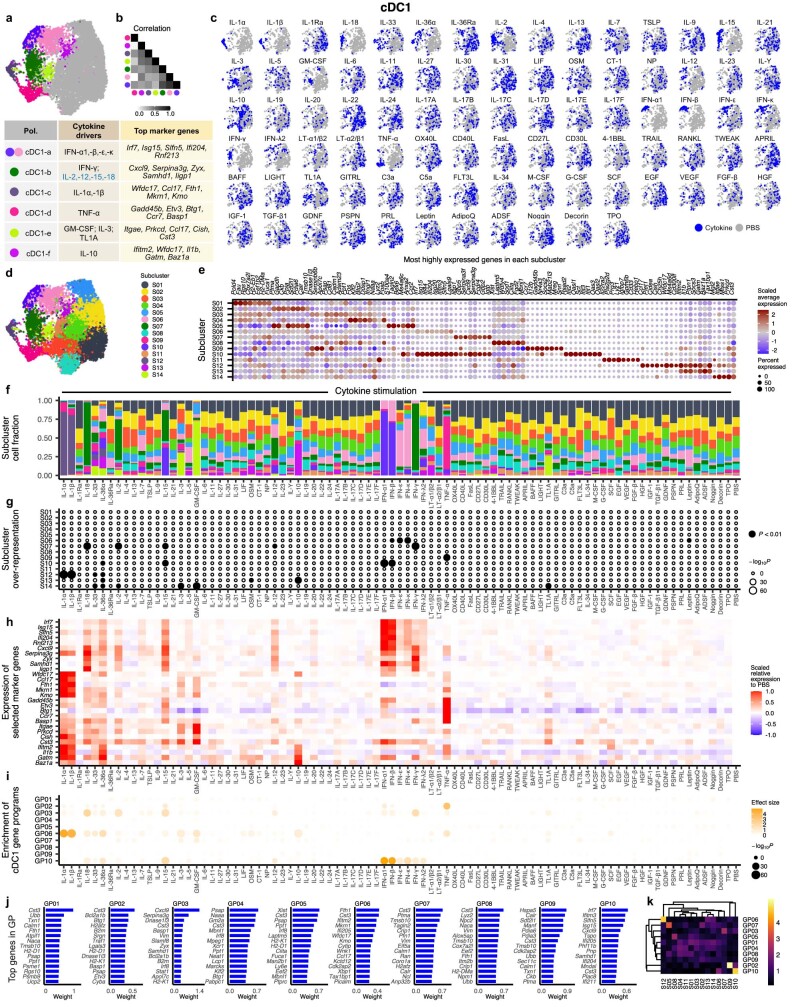
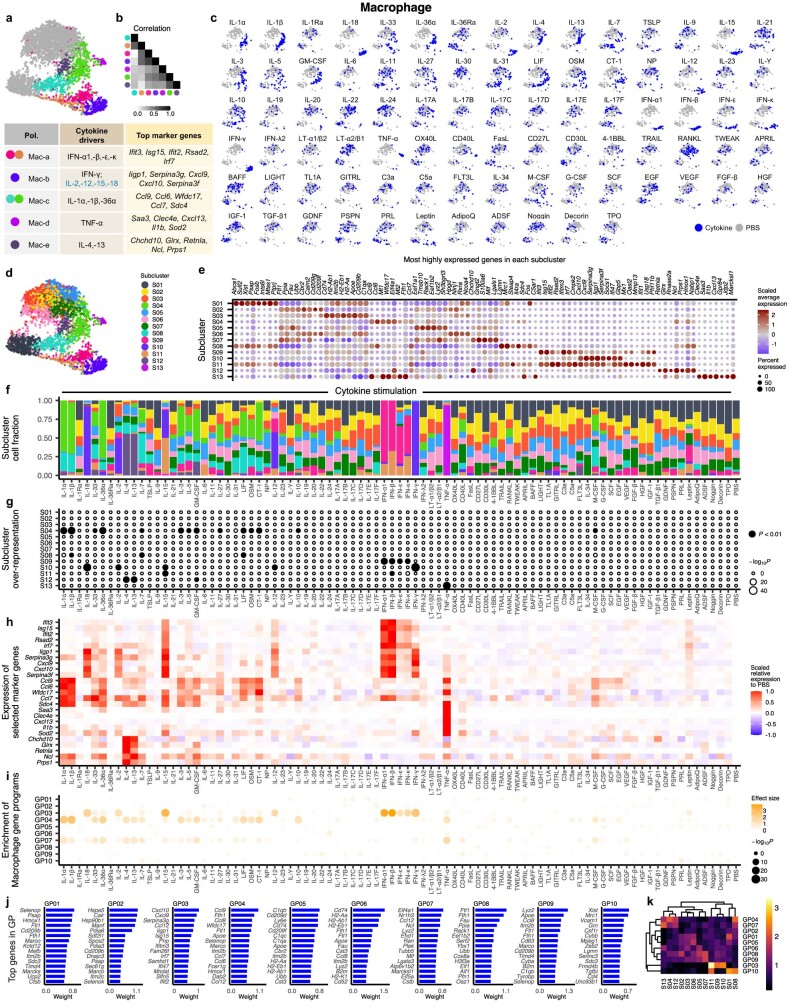
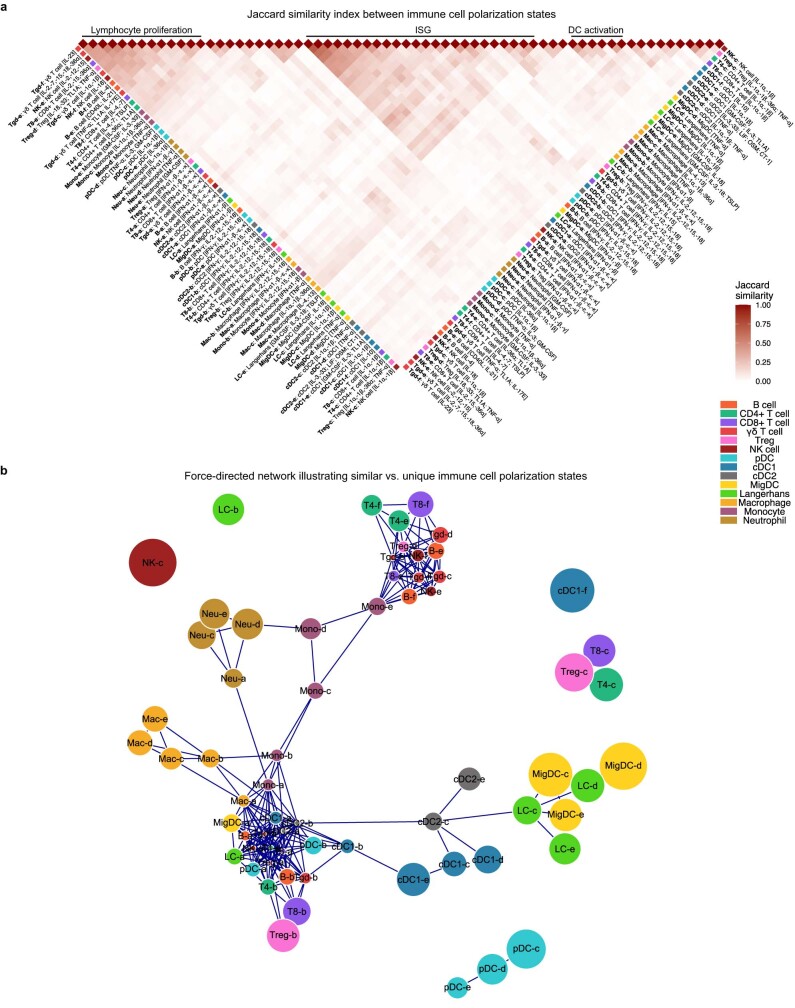
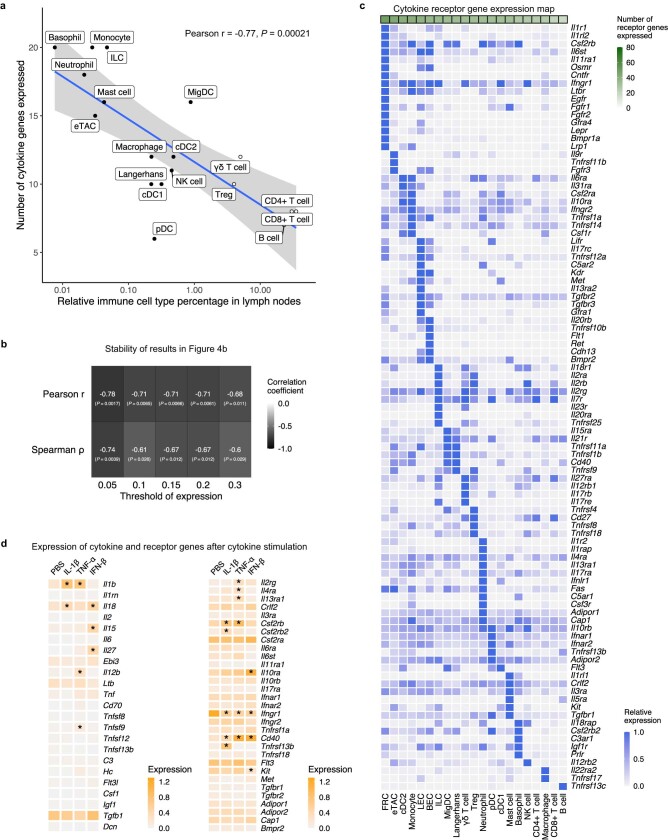
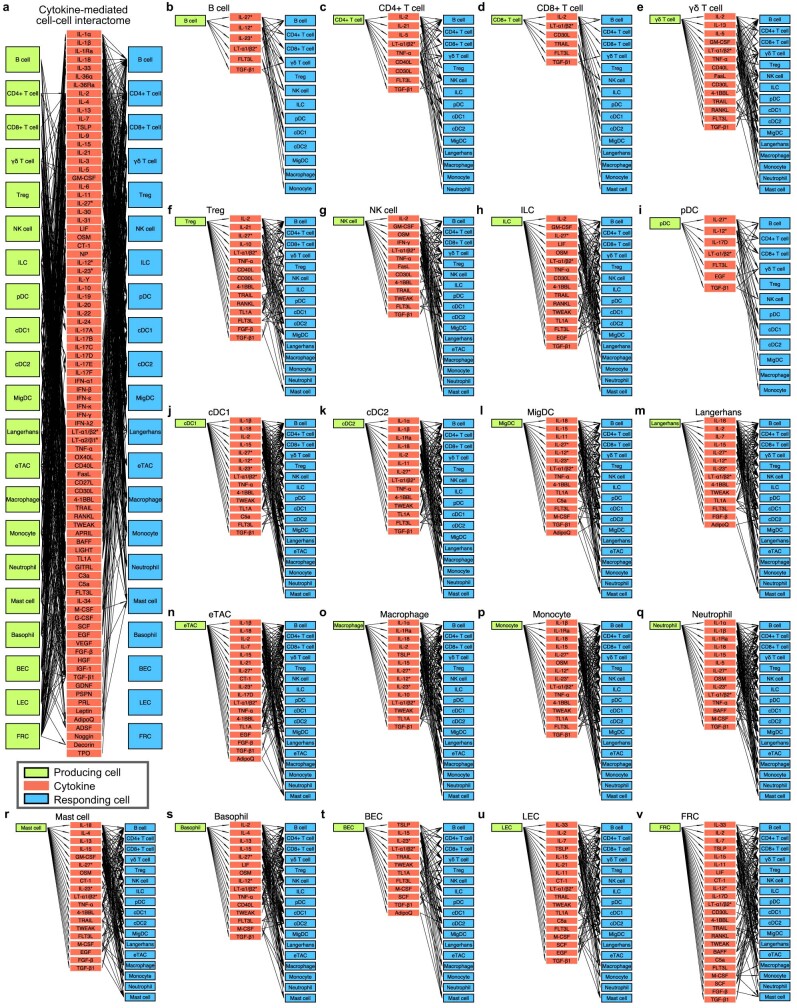
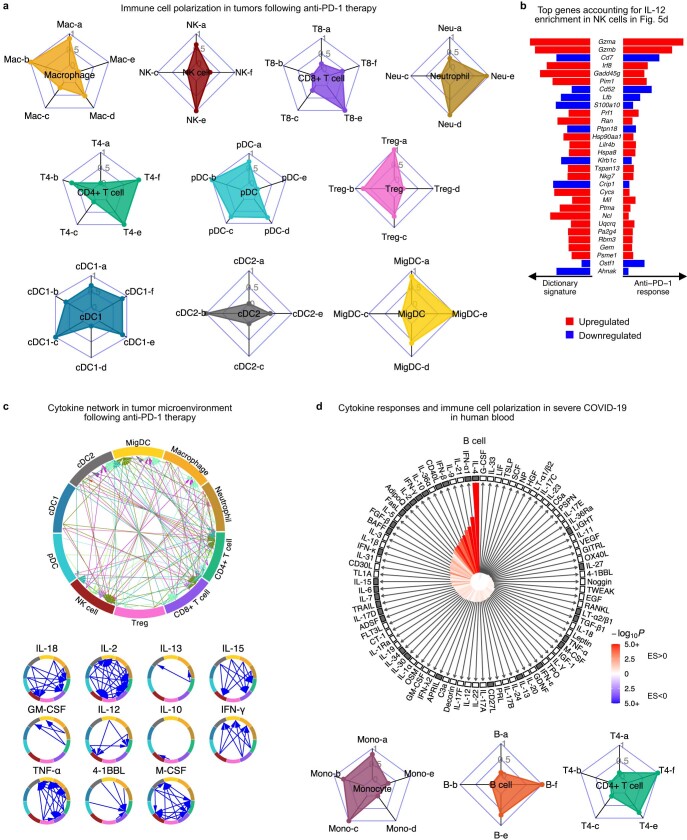
Cytokines mediate cell-cell communication in the immune system and represent important therapeutic targets1-3. A myriad of studies have highlighted their central role in immune function4-13, yet we lack a global view of the cellular responses of each immune cell type to each cytokine. To address this gap, we created the Immune Dictionary, a compendium of single-cell transcriptomic profiles of more than 17 immune cell types in response to each of 86 cytokines (>1,400 cytokine-cell type combinations) in mouse lymph nodes in vivo. A cytokine-centric view of the dictionary revealed that most cytokines induce highly cell-type-specific responses. For example, the inflammatory cytokine interleukin-1β induces distinct gene programmes in almost every cell type. A cell-type-centric view of the dictionary identified more than 66 cytokine-driven cellular polarization states across immune cell types, including previously uncharacterized states such as an interleukin-18-induced polyfunctional natural killer cell state. Based on this dictionary, we developed companion software, Immune Response Enrichment Analysis, for assessing cytokine activities and immune cell polarization from gene expression data, and applied it to reveal cytokine networks in tumours following immune checkpoint blockade therapy. Our dictionary generates new hypotheses for cytokine functions, illuminates pleiotropic effects of cytokines, expands our knowledge of activation states of each immune cell type, and provides a framework to deduce the roles of specific cytokines and cell-cell communication networks in any immune response.


Conflict of interest statement

N.H. and C.J.W. hold equity in BioNTech. N.H. is an advisor for Related Sciences/Danger Bio, Repertoire Immune Medicines and CytoReason. A.C. was a consultant for Foresite Capital and Altimmune for unrelated work. D.B.K is a scientific advisor for Immunitrack and Breakbio. DBK owns equity in Affimed N.V., Agenus, Armata Pharmaceuticals, Breakbio, BioMarin Pharmaceutical, Celldex Therapeutics, Editas Medicine, Gilead Sciences, Immunitybio and Lexicon Pharmaceuticals. BeiGene, a Chinese biotechnology company, supports unrelated research at the Translational Immunogenomics Lab. The remaining authors declare no competing interests. N.H. and A.C. have filed patent applications related to this work.

Figures

Fig. 1
Fig. 1. Generation of a scRNA-seq dictionary of gene expression signatures in more than 17 immune cell types in response to each of 86 cytokines in vivo.
a, Schematic of the experimental and computational workflow. First row, data generation procedures; second row, illustration of the Immune Dictionary and its companion software IREA; third row, analyses of the Immune Dictionary. b, t-distributed stochastic neighbour embedding (t-SNE) map of all cells collected from lymph nodes after cytokine stimulation or without stimulation (PBS controls) coloured by cell-type identity. Cells were sorted to rebalance frequencies of major cell types. c, Violin plots of expression levels of well-established cytokine-responsive genes following PBS or cytokine treatment. ***False discovery rate (FDR)-adjusted P < 0.001, two-sided Wilcoxon rank-sum test. d, Quantitative representation of overall transcriptomic response levels in each cell type 4 h after cytokine stimulation compared with PBS controls. Each cell type is analysed independently and is represented by a distinct colour, following the colour codes in b and c. Colour saturation indicates the magnitude of the response. Size indicates the number of genes with significant differential expression (absolute log2(fold change (FC)) > 0.25 and FDR-adjusted P < 0.05, two-sided Wilcoxon rank-sum test) in each cytokine signature. Source data
Fig. 2
Fig. 2. Cytokines induce cell-type-specific transcriptomic responses.
a, Heatmaps of the top DEGs per cell type in response to IFNβ, IL-1β and TNF relative to PBS controls. Colour gradient represents log2(FC) (capped at twofold) in comparison with PBS treatment for the respective cell type. b, Number of DEGs (log2(FC) > 0.3 and FDR-adjusted P < 0.05, two-sided Wilcoxon rank-sum test) following each cytokine treatment, grouped by sharing pattern, either specifically overexpressed by one cell type (top) or shared by two or more cell types (bottom). Cell-type combinations with the most shared genes (>16 DEGs in any given treatment) are shown. A maximum of 100 cells per cytokine treatment for each of the 7 representative cell types were sampled to ensure comparability across cell types for this analysis. The x axes span from 0 to the highest DEG counts. c, Upregulated GPs following IFNα1 and IFNβ (top) or IL-1α and IL-1β (bottom) treatment with respect to PBS control. GPs that are significantly upregulated between cytokine and PBS treatment (effect size > 1 and FDR-adjusted P < 0.01, two-sided Wilcoxon rank-sum test) in any cell type are shown. Significant GPs (FDR < 0.05) for each cell type are represented as circles, with the circle size indicating significance and the colour representing the effect size (capped at 10). Representative enriched biological processes (FDR-adjusted P < 0.05; black tiles) for the top-weighted genes in each GP are shown. Source data
Fig. 3
Fig. 3. Cytokines drive diverse polarization states in each cell type.
an, Uniform manifold approximation and projection (UMAP) plots of cells shown for each cell type. a, B cell. b, CD4+ T cell. c, CD8+ T cell. d, γδ T cell. e, Treg cell. f, NK cell. g, pDC. h, cDC1. i, cDC2. j, MigDC. k, Langerhans cell. l, Marco+ macrophage. m, Monocyte, n, Neutrophil. Coloured circles in the UMAP plots and next to state names correspond to polarization states. Cells coloured grey do not map to polarization states described. Cell polarization state name, single cytokine drivers and top marker genes are shown in the table for each cell type. Cytokine drivers coloured blue are probably indirect inducers. Top marker genes are defined as highly upregulated genes in the polarization state relative to all other cells of the same cell type. Colours in different panels are unrelated. o,p, Additional views of f using NK cells as an example to illustrate polarization-state analyses. o, UMAP plots coloured by cytokine or PBS treatment for major cytokine drivers of polarization states shown in f. p, Violin plots of expression levels of selected marker genes after cytokine or PBS treatment. Colours correspond to the polarization states that the cytokines are most strongly associated. This figure is a summary of the complete landscape for each cell type in Extended Data Figs. 5–8 and Supplementary Figs. 2–11. Source data
Fig. 4
Fig. 4. Cytokine production map by cell type.
a, Heatmap of row-normalized gene expression of the 86 cytokines studied. Protein names encoded by the genes are in parentheses. b, Scatter plot showing the abundance of each cell type (log10 scaled) in lymph nodes in PBS-treated controls compared with the number of cytokine genes expressed (calculated from an equal number of cells per cell type; threshold of detection = 0.1). Smoothed conditional means and 95% confidence intervals from a fitted linear model are shown. Pearson correlation coefficient and its associated P value obtained from two-sided t-test are shown. a included all cells in the study, whereas b sampled an equal number of cells per cell type to ensure comparability across cell types. c, Cytokine-mediated cell–cell interactome shown for FRC and cDC1 cells (complete interactome presented in Extended Data Fig. 11). Asterisks indicate multimeric cytokines. Source data
Fig. 5
Fig. 5. IREA enables the inference of cytokine activities, immune cell polarization and cell–cell communications based on transcriptomic data.
a, Problem statement for cytokine response inference, b, Illustration of the IREA software input and output. Colours in the heatmaps represent different expression values. User input can be gene sets or transcriptome matrices. Blue backgrounds represent cell polarization analysis; orange backgrounds represent cytokine response analysis. ce, Examples of IREA analysis output on scRNA-seq data collected from cells in the tumour microenvironment following anti-PD-1 treatment relative to control antibody treatment. c, IREA radar plots showing enrichment of macrophage, NK cell and CD8+ T cell polarization states described in Fig. 3. Cytokine drivers of selected polarization states are indicated by arrows. d, IREA cytokine enrichment plot showing the enrichment score (ES) for each of the 86 cytokine responses in NK cells following anti-PD-1 treatment. Bar length represents the ES, shading represents the FDR-adjusted P value (two-sided Wilcoxon rank-sum test), with darker colours representing more significant enrichment (red, enriched in anti-PD-1 treatment, blue, enriched in untreated control). Cytokines with receptors expressed are indicated by black filled boxes. e, Inferred cell–cell communication network mediated by cytokines. For ease of identification, cytokines are plotted from left to right in each segment in the same order as the legend. For clarity, individual cytokine plots following the same visualization scheme are shown on the right and in Extended Data Fig. 12c. Source data
Extended Data Fig. 1
Extended Data Fig. 1. scRNA-seq data summary and quality metrics.
a, Violin plots showing the distributions of percentage of mitochondrial gene content (top), number of genes detected (middle), and number of unique molecular identifiers (UMIs) detected (bottom) per cell post-quality control across cytokine or PBS treatment conditions. The interquartile range is shown as a white box inside each violin plot. n = 386,703 independent cells over 272 independent mice (3 mice per cytokine and 14 mice for PBS control). b, Two-dimensional t-SNE visualization of all cells (following the coordinates in Fig. 1b), colored by any cytokine treatment (pink) or PBS control (blue). c, Contour plot of the t-SNE map in b. d, t-SNE visualization of all cells, colored by level-1 Louvain clusters identified from global clustering. The dominant cell type associated with each cluster is indicated in the accompanying table. Each cluster is further divided into level-2 clusters to refine cell type identification (Supplementary Table 2). e, Dot plot showing the scaled average expression of cell type marker genes and percentage of cells expressing the genes in each annotated cell type. f, Cell type composition in each treatment. g, Changes in the fraction of non-B, non-T immune cell types after cytokine treatment relative to PBS controls. * denotes P-value < 0.05, one-sided Wilcoxon rank-sum test with FDR adjustment. Only CD3– and CD19– immune cells are shown as these cell types are not influenced by the cell sorting strategy used. Source data
Extended Data Fig. 2
Extended Data Fig. 2. Additional scRNA-seq data quality metrics.
a, Distributions of Euclidean distances between individual PBS-treated cells based on their transcriptomic profiles, colored by whether cells compared are from the same sample processing batch or across different sample processing batches. b, Pearson correlation coefficients between cytokine-induced gene expression signatures obtained from different animal replicates, using cDC1 as a representative example. c, As a positive control for the ability of each lymph node cell type to access the injected cytokines, IFN-α/β responses in each cell type are shown. At the single-cell level, ISG scores can accurately classify IFN-α/β-treated cells vs. PBS-treated cells based on areas under receiver operating characteristics (AUROC) curves in each cell type, confirming that the vast majority of the cells can access the injected cytokines. ISG expression in each cell is shown as individual dots and violin plots on the left side, and the classification accuracy is shown as ROC curves on the right side. Source data
Extended Data Fig. 3
Extended Data Fig. 3. Cell type-specific gene expression changes induced by IFN-α1, IFN-β, IFN-κ, IFN-γ, IL-1α, IL-1β, IL-18, IL-36α, IL-2, IL-4, IL-7, IL-15, IL-3, GM-CSF, and TNF-α.
a, Gene expression heatmaps illustrating top genes upregulated by cytokine treatment compared to PBS treatment in any of the cell types shown. All genes shown have at least log2FC > 0.3 and FDR < 0.05 in one or more cell types. Color gradient indicates average log2FC relative to PBS treatment of the same cell type. Genes expressed in fewer than 10% of cells in both cytokine and PBS treatment conditions are denoted as no change. b, Percentage of upregulated DEGs exclusive to a single cell type (green) or shared among two or more cell types (other colors) after cytokine treatment at various DEG cutoff thresholds. Each box shows a different log2FC and FDR threshold for defining DEGs. This is an extension of the analysis in Fig. 2b, showing consistency of the cell type-specific effects irrespective of DEG cutoffs. Source data
Extended Data Fig. 4
Extended Data Fig. 4. Cell type-specific responses to a cytokine can be exclusive to the cytokine or can be attributed to secondary effects from induced cytokines.
a-b, Examples of cell type-specific responses to a cytokine that are not observed in the responses to the other cytokines studied. a, Examples of cell type-specific gene regulation in response to IL-1α/β and exclusively to IL-1α/β. Left, Heatmaps showing differential expression of IL-1α/β-regulated genes relative to PBS treatment per cell type, highlighting cell type-specific responses to the same cytokines. Three independent mice for each cytokine treatment are shown in adjacent columns. Right, for the IL-1α/β-induced cell type-specific DEGs in the heatmaps, the plots show whether they can be induced by any other of the 86 cytokine stimulations. Color of square, log2 fold change in each cytokine treatment relative to PBS; size of square, –log10 transformed FDR-adjusted P-value obtained from two-sided Wilcoxon rank-sum test. Results with FDR < 0.05 and log2FC > 0.5 are shown. IL-1α/β treatments are highlighted in gray. Cell types in columns on the left and rows on the right follow the same color code. Note that both IL-36α and IL-1α/β are proinflammatory cytokines in the IL-1 cytokine family. b, Examples of cell type-specific gene regulation in response to IFN-α1/β and exclusively to IFN-α1/β; following the same visualization as in a. Note that both IFN-κ and IFN-α1/β are type I interferons and share receptors. c-e, Examples of cell type-specific responses to a cytokine that can be attributed to secondary effects from induced cytokines. c, Heatmaps showing DEGs in response to IL-2, IL-12, IL−15, IL−18 relative to PBS treatment, highlighting different responses to the same cytokine in NK cells vs. other cell types. Heatmap for IFN-γ treatment is included as a comparison. Stat1 is known to be regulated by IFN-γ signaling. d, Violin plot showing Ifng gene expression in NK cells after each of the 86 cytokine treatments or PBS treatment. Samples with a high expression (>0.8 normalized expression units) are colored dark blue. e, Induction of IFN-γ signatures across cell types after each cytokine treatment. The IFN-γ signature is obtained for each cell type from the IFN-γ treatment. Expression of the signature is obtained from summing normalized expression units of all genes in the signature for each cell type. Significant (FDR < 0.01) responses are shown as squares, with color gradient representing average log2FC in each cytokine treatment relative to PBS (capped at 50), and size representing –log10 transformed FDR-adjusted P-value obtained from two-sided Wilcoxon rank-sum test. Cytokines inducing a high expression of Ifng are highlighted in gray in d and e. d and e are vertically aligned to illustrate that the cytokine treatments inducing an upregulation of Ifng in NK cells display a strong IFN-γ signature in other cell types. Source data
Extended Data Fig. 5
Extended Data Fig. 5. B cell responses to cytokines: polarization states, subclusters, marker gene expression, and gene programs.
a, Top, UMAP visualization of B cells for all cytokines, colored by polarization states; bottom, table with cell type polarization states (left column), single cytokine drivers (middle column), and top marker genes (right column); reproduced from Fig. 3 for ease of reference. b, Pairwise Pearson correlation coefficients between polarization states. c, UMAP visualization of B cells shown independently for each cytokine treatment, colored by cytokine treatment (blue) or PBS treatment control (gray). d, UMAP visualization of B cells for all cytokine or PBS treatment; cells colored for B cell Louvain subclusters. e, Top overexpressed genes in each Louvain subcluster in d; color, column-scaled average expression; size of circle, percentage of cells in the subcluster expressing each gene. f-i, B cell responses to each cytokine stimulation. f, Fraction of cells per subcluster in each cytokine treatment. Colors represent subclusters defined in d. g, Enrichment of each subcluster in each cytokine treatment; size of circle, Bonferroni-adjusted P-value of hypergeometric test relative to PBS; black fills, P < 0.01. h, Row-normalized relative expression of representative marker genes of each polarization state in cytokine-treated vs. PBS-treated cells. i, Enrichment of B cell gene programs obtained from NMF analysis of all B cells in cytokine-treated cells relative to PBS-treated cells; size of circle, FDR-adjusted P-value from two-sided Wilcoxon rank-sum test; shade, effect size representing the mean difference in gene program weight. j, Top weighted genes in each gene program in i. k, Average gene program weight in each subcluster. Rows and columns were hierarchically clustered using the complete-linkage method on Euclidean distances. Source data
Extended Data Fig. 6
Extended Data Fig. 6. NK cell responses to cytokines: polarization states, subclusters, marker gene expression, and gene programs.
a, Top, UMAP visualization of NK cells for all cytokines, colored by polarization states; bottom, table with cell type polarization states (left column), single cytokine drivers (middle column), and top marker genes (right column); reproduced from Fig. 3 for ease of reference. b, Pairwise Pearson correlation coefficients between polarization states. c, UMAP visualization of NK cells shown independently for each cytokine treatment, colored by cytokine treatment (blue) or PBS treatment control (gray). d, UMAP visualization of NK cells for all cytokine or PBS treatment; cells colored for NK cell Louvain subclusters. e, Top overexpressed genes in each Louvain subcluster in d; color, column-scaled average expression; size of circle, percentage of cells in the subcluster expressing each gene. f-i, NK cell responses to each cytokine stimulation. f, Fraction of cells per subcluster in each cytokine treatment. Colors represent subclusters defined in d. g, Enrichment of each subcluster in each cytokine treatment; size of circle, Bonferroni-adjusted P-value of hypergeometric test relative to PBS; black fills, P < 0.01. h, Row-normalized relative expression of representative marker genes of each polarization state in cytokine-treated vs. PBS-treated cells. i, Enrichment of NK cell gene programs obtained from NMF analysis of all NK cells in cytokine-treated cells relative to PBS-treated cells; size of circle, FDR-adjusted P-value from two-sided Wilcoxon rank-sum test; shade, effect size representing the mean difference in gene program weight. j, Top weighted genes in each gene program in i. k, Average gene program weight in each subcluster. Rows and columns were hierarchically clustered using the complete-linkage method on Euclidean distances. Source data
Extended Data Fig. 7
Extended Data Fig. 7. cDC1 responses to cytokines: polarization states, subclusters, marker gene expression, and gene programs.
a, Top, UMAP visualization of cDC1 cells for all cytokines, colored by polarization states; bottom, table with cell type polarization states (left column), single cytokine drivers (middle column), and top marker genes (right column); reproduced from Fig. 3 for ease of reference. b, Pairwise Pearson correlation coefficients between polarization states. c, UMAP visualization of cDC1 cells shown independently for each cytokine treatment, colored by cytokine treatment (blue) or PBS treatment control (gray). d, UMAP visualization of cDC1 cells for all cytokine or PBS treatment; cells colored for cDC1 Louvain subclusters. e, Top overexpressed genes in each Louvain subcluster in d; color, column-scaled average expression; size of circle, percentage of cells in the subcluster expressing each gene. f-i, cDC1 responses to each cytokine stimulation. f, Fraction of cells per subcluster in each cytokine treatment. Colors represent subclusters defined in d. g, Enrichment of each subcluster in each cytokine treatment; size of circle, Bonferroni-adjusted P-value of hypergeometric test relative to PBS; black fills, P < 0.01. h, Row-normalized relative expression of representative marker genes of each polarization state in cytokine-treated vs. PBS-treated cells. i, Enrichment of cDC1 gene programs obtained from NMF analysis of all cDC1 cells in cytokine-treated cells relative to PBS-treated cells; size of circle, FDR-adjusted P-value from two-sided Wilcoxon rank-sum test; shade, effect size representing the mean difference in gene program weight. j, Top weighted genes in each gene program in i. k, Average gene program weight in each subcluster. Rows and columns were hierarchically clustered using the complete-linkage method on Euclidean distances. Source data
Extended Data Fig. 8
Extended Data Fig. 8. Macrophage (Marco+) responses to cytokines: polarization states, subclusters, marker gene expression, and gene programs.
a, Top, UMAP visualization of Macro+ macrophages for all cytokines, colored by polarization states; bottom, table with cell type polarization states (left column), single cytokine drivers (middle column), and top marker genes (right column); reproduced from Fig. 3 for ease of reference. b, Pairwise Pearson correlation coefficients between polarization states. c, UMAP visualization of macrophages shown independently for each cytokine treatment, colored by cytokine treatment (blue) or PBS treatment control (gray). d, UMAP visualization of macrophages for all cytokine or PBS treatment; cells colored for macrophage Louvain subclusters. e, Top overexpressed genes in each Louvain subcluster in d; color, column-scaled average expression; size of circle, percentage of cells in the subcluster expressing each gene. f-i, Macrophage responses to each cytokine stimulation. f, Fraction of cells per subcluster in each cytokine treatment. Colors represent subclusters defined in d. g, Enrichment of each subcluster in each cytokine treatment; size of circle, Bonferroni-adjusted P-value of hypergeometric test relative to PBS; black fills, P < 0.01. h, Row-normalized relative expression of representative marker genes of each polarization state in cytokine-treated vs. PBS-treated cells. i, Enrichment of macrophage gene programs obtained from NMF analysis of all macrophages in cytokine-treated cells relative to PBS-treated cells; size of circle, FDR-adjusted P-value from two-sided Wilcoxon rank-sum test; shade, effect size representing the mean difference in gene program weight. j, Top weighted genes in each gene program in i. k, Average gene program weight in each subcluster. Rows and columns were hierarchically clustered using the complete-linkage method on Euclidean distances. Source data
Extended Data Fig. 9
Extended Data Fig. 9. A comparative global view of the 66 major polarization states across immune cell types.
a, Heatmap showing pairwise Jaccard similarity index between immune cell polarization states defined in Fig. 3, Extended Data Figs. 5–8, and Supplementary Figs. 2–11. Jaccard similarity index is defined based on genes with >0.5 log2 fold difference in each polarization state compared to PBS-treatment of the same cell type. Cell types are marked by colors on the edges of the heatmap. Cytokine drivers are indicated in square brackets. Groups of similar polarization states are annotated above the heatmap. b, Force-directed graph visualization of Jaccard similarity index between immune cell polarization states to highlight unique polarization states. Vertices represent polarization states. A line connects a pair of vertices that have Jaccard similarity index > 0.15. Unconnected states are randomly positioned in the force-directed graph. A larger circle represents a more unique polarization state, based on a lower median Jaccard similarity index with other polarization states. Cell types are marked by colors indicated in a. Source data
Extended Data Fig. 10
Extended Data Fig. 10. A map of cytokine receptor expression by cell type and additional information on the cytokine production map.
a, Correlation between cell type abundance and number of distinct cytokine genes expressed; added B cells and T cells (hollow circles) to Fig. 4b. B cell and T cell abundances are estimates integrated from literature, all other cell types are obtained from PBS-treated conditions in lymph nodes from our dictionary. Smoothed conditional means and 95% confidence intervals from a fitted linear model are shown. b, Robustness analysis for Fig. 4b; showing correlations between the abundance of each cell type and the numbers of distinct cytokine genes expressed in the cell type under various cutoff thresholds for a cytokine gene to be considered expressed. Both Pearson and Spearman correlation coefficients are shown. c, A map of cytokine receptor expression by cell type. The map includes signaling receptors, decoy receptors, as well as receptors that form complexes with cytokines. The values are normalized to the maximum expression in each row. d, Expression of cytokine (left) or receptor (right) genes in cDC1s following PBS or cytokine treatment. * represents FDR-adjusted P < 0.05 for significant change in expression relative to PBS control. Source data
Extended Data Fig. 11
Extended Data Fig. 11. A draft network of cytokine-mediated cell-cell interactome.
a, An interactome network showing cell-cell communication potential based on cytokine expression and the impact of cytokine on each cell type. Lime box, source nodes or cell types secreting cytokines; red box, cytokines mediating the communication; blue box, sink nodes or cell types responding to cytokines. A path is established between source and sink cell types through a cytokine if the source cell type produces the cytokine (normalized expression > 0.1) and the sink cell type shows a significant response to the cytokine (>10 DEGs in the cytokine signatures). Asterisks indicate heteromeric cytokines or cytokine complexes. Rare cell types, including basophils, BECs, LECs, and FRCs, were not analyzed for the response, but were aggregated across treatment conditions to generate the production map. b-v, The interactome using same conventions as in a plotted separately by source node for ease of visualization, shown for b, B cell; c, CD4+ T cell; d, CD8+ T cell; e, γδ T cell; f, Treg; g, NK cell; h, ILC; i, pDC; j, cDC1; k, cDC2; l, MigDC; m, Langerhans cell; n, eTAC; o, macrophage; p, monocyte; q, neutrophil; r, mast cell; s, basophil; t, BEC; u, LEC; v, FRC. j and v are reproduced from Fig. 4c. Source data
Extended Data Fig. 12
Extended Data Fig. 12. IREA software output on mouse tumor samples following anti-PD-1 treatment and on human blood samples in severe COVID-19.
a-c, Additional IREA analyses on mouse tumor samples following anti-PD-1 treatment relative to the control. a, IREA radar plots showing enrichments of immune cell polarization states described in Fig. 3. b, To improve the interpretability of the enrichment scores in Fig. 5d, top genes contributing to the IL-12 enrichment in NK cells are shown. Bar length represents gene expression fold change; left: changes in gene expression in NK cells in response to IL-12 in the Immune Dictionary; right: changes in gene expression in NK cells after anti-PD-1 treatment in the tumor dataset (red: upregulated relative to control; blue: downregulated relative to control). c, Inferred cell-cell communication network mediated by cytokines. The plot on the top is reproduced from Fig. 5e for ease of reference. Individual cytokine plots following the same visualization scheme are shown below. d, IREA analysis on peripheral blood cells collected from severe COVID-19 patients relative to healthy volunteers. Top, IREA compass plot showing enrichment scores for each of the 86 cytokines in B cells. Bar length represents enrichment score, shade represents FDR adjusted P-value (two-sided Wilcoxon rank-sum test), with darker colors representing more significant enrichment (red: enriched in ventilated COVID-19 patients, blue: enriched in healthy control). Cytokines with receptors expressed are indicated by black filled boxes. Bottom, IREA radar plots showing enrichments of immune cell polarization states in monocytes, B cells, and CD4+ T cells. The reference polarization states are described in Fig. 3. Source data

References

    1. Arai KI, et al. Cytokines: coordinators of immune and inflammatory responses. Annu. Rev. Biochem. 1990;59:783–836. doi: 10.1146/annurev.bi.59.070190.004031. - DOI - PubMed
    1. Briukhovetska D, et al. Interleukins in cancer: from biology to therapy. Nat. Rev. Cancer. 2021;21:481–499. doi: 10.1038/s41568-021-00363-z. - DOI - PMC - PubMed
    1. Ye, Q., Wang, B. & Mao, J. The pathogenesis and treatment of the ‘cytokine storm’ in COVID-19. J. Infect.10.1016/j.jinf.2020.03.037 (2020). - PMC - PubMed
    1. Sims JE, Smith DE. The IL-1 family: regulators of immunity. Nat. Rev. Immunol. 2010;10:89–102. doi: 10.1038/nri2691. - DOI - PubMed
    1. Rochman Y, Spolski R, Leonard WJ. New insights into the regulation of T cells by γc family cytokines. Nat. Rev. Immunol. 2009;9:480–490. doi: 10.1038/nri2580. - DOI - PMC - PubMed

MeSH terms