. 2023 Dec 6;23(1):618.
doi: 10.1186/s12870-023-04611-2.

Transcriptomics reveals a core transcriptional network of K-type cytoplasmic male sterility microspore abortion in wheat (Triticum aestivum L.)

Affiliations

Transcriptomics reveals a core transcriptional network of K-type cytoplasmic male sterility microspore abortion in wheat (Triticum aestivum L.)

Baolin Wu et al. BMC Plant Biol. .

Abstract

Background: Cytoplasmic male sterility (CMS) plays a crucial role in hybrid production. K-type CMS, a cytoplasmic male sterile line of wheat with the cytoplasms of Aegilops kotschyi, is widely used due to its excellent characteristics of agronomic performance, easy maintenance and easy restoration. However, the mechanism of its pollen abortion is not yet clear.

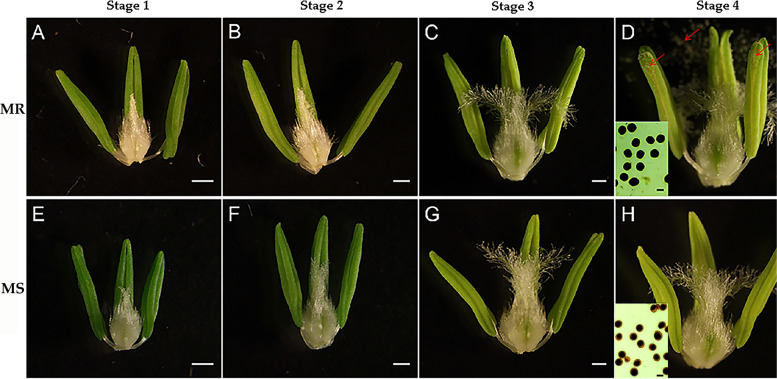
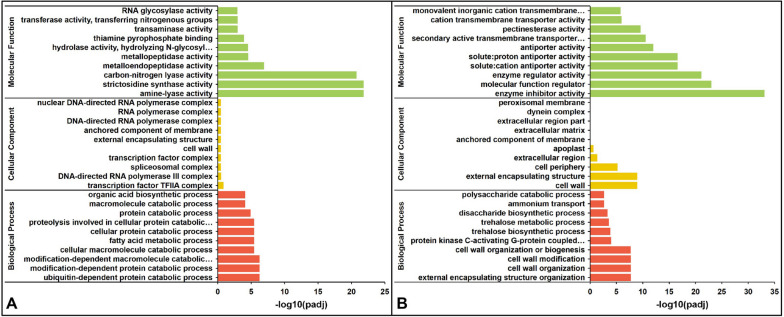
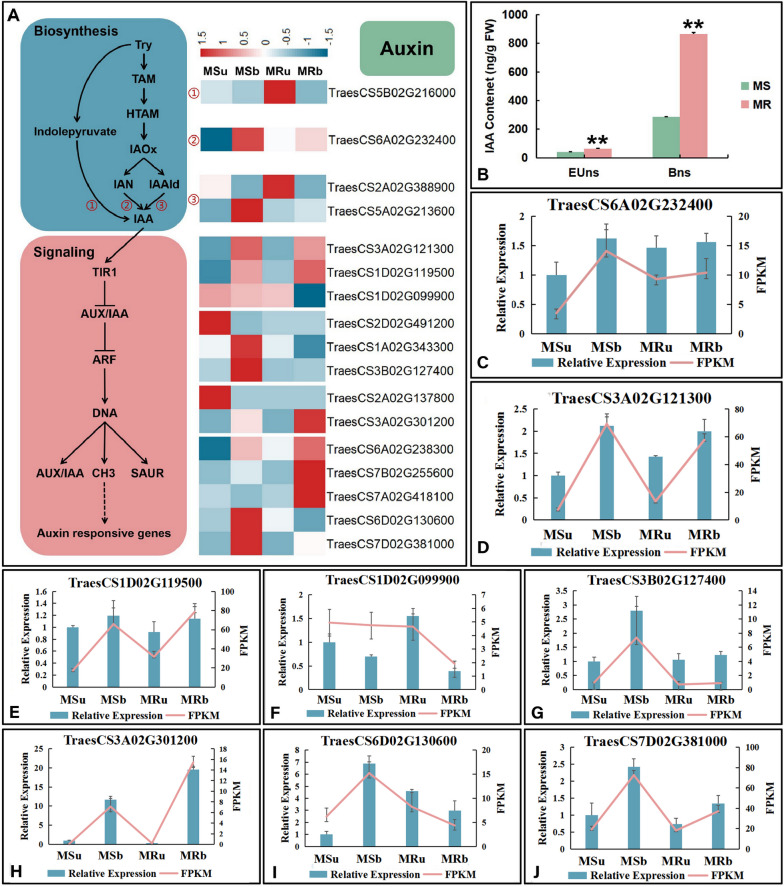
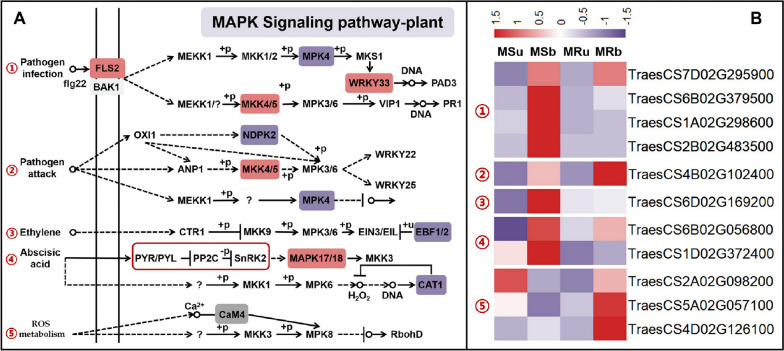
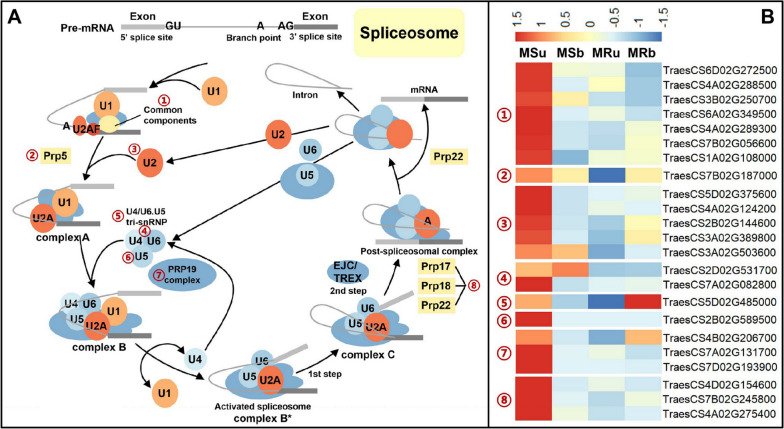
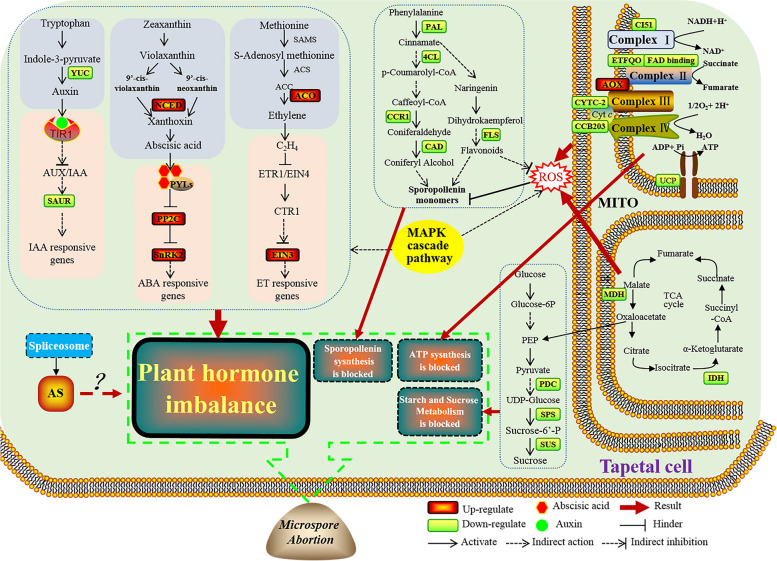
Results: In this study, wheat K-type CMS MS(KOTS)-90-110 (MS line) and it's fertile near-isogenic line MR (KOTS)-90-110 (MR line) were investigated. Cytological analysis indicated that the anthers of MS line microspore nucleus failed to divide normally into two sperm nucleus and lacked starch in mature pollen grains, and the key abortive period was the uninucleate stage to dinuclear stage. Then, we compared the transcriptome of MS line and MR line anthers at these two stages. 11,360 and 5182 differentially expressed genes (DEGs) were identified between the MS and MR lines in the early uninucleate and binucleate stages, respectively. Based on GO enrichment and KEGG pathways analysis, it was evident that significant transcriptomic differences were "plant hormone signal transduction", "MAPK signaling pathway" and "spliceosome". We identified 17 and 10 DEGs associated with the IAA and ABA signal transduction pathways, respectively. DEGs related to IAA signal transduction pathway were downregulated in the early uninucleate stage of MS line. The expression level of DEGs related to ABA pathway was significantly upregulated in MS line at the binucleate stage compared to MR line. The determination of plant hormone content and qRT-PCR further confirmed that hormone imbalance in MS lines. Meanwhile, 1 and 2 DEGs involved in ABA and Ethylene metabolism were also identified in the MAPK cascade pathway, respectively; the significant up regulation of spliceosome related genes in MS line may be another important factor leading to pollen abortion.

Conclusions: We proposed a transcriptome-mediated pollen abortion network for K-type CMS in wheat. The main idea is hormone imbalance may be the primary factor, MAPK cascade pathway and alternative splicing (AS) may also play important regulatory roles in this process. These findings provided intriguing insights for the molecular mechanism of microspore abortion in K-type CMS, and also give useful clues to identify the crucial genes of CMS in wheat.

Keywords: Cytoplasmic male sterility; MAPK pathway; Plant hormone; Spliceosome; Transcriptome sequencing; Wheat.


Conflict of interest statement

The authors declare no competing interests.

Figures

Fig. 1
Fig. 1
Phenotypes of anthers and pistils in the male-sterile (MS) line and its near-isogenic male fertile (MR) line. stage 1: early uninucleate stage (A, E); stage 2: late uninucleate stage (B, F); stage 3:binucleate stage(C, G); stage 4:trinucleate stage (D, H). the 2% I2-KI staining pollen grains (D, H, bottom left). Red arrows indicate mature pollen grains (D). Scale bars: 0.5 mm in (A- H), 50 µm in the bottom left of(D, H)
Fig. 2
Fig. 2
Cytological and morphological observations of microspores in the male-sterile (MS) line and its near-isogenic male fertile (MR) line. stage 2: uninucleate stage (A, E); stage 3:binucleate stage (B, F); stage 4:trinucleate stage (C, G). Scale bars: 50 µm in (A - G),20 µm in (D, H)
Fig. 3
Fig. 3
Analysis of DEGs in the male-sterile (MS) line and its near-isogenic male fertile (MR) line. A Number of differentially expressed genes (DEG) detected in different fertility materials and different development stages. B PCA clustering based on transcriptome data. C Venn diagrams of DEGs in MSu vs MRu and MSb vs MRb. D Venn diagrams of DEGs in MSu vs MSb and MRu vs MRb
Fig. 4
Fig. 4
GO function enrichment of DEGs between the MS line and the MR line. Gene ontology (GO) analysis of DEGs in (A) MSu vs MRu and (B) MSb vs MRb.The top 20 enriched GO terms ranked by p-values are shown. MS: male sterile line; MR: near-isogenic male fertile line; u: early uninucleate stage; b: binucleate stage
Fig. 5
Fig. 5
The top 20 significantly enriched pathwaysbased on KEGG between the MS line and the MR line. KEGG analysis of DEGs in (A) MSu vs MRu and (B) MSb vs MRb. MS: male sterile line; MR: near-isogenic male fertile line; u: early uninucleate stage; b: binucleate stage
Fig. 6
Fig. 6
Expression levels of DEGs of the auxin metabolism pathway. A Expression patterns of DEGs of the IAA biosynthesis and signaling pathway. B the contents of IAA. The significance of differences was assessed using the Student’s t-test. *p < 0.05, ** p < 0.01. C-J qRT-PCR analysis of the expression patterns of randomly selected IAA-related DEGs. Data are presented as the means ± SD of three technical replicates and three independent biological replicates
Fig. 7
Fig. 7
Expression levels of DEGs of the abscisic acid metabolism pathway. A Expression patterns of DEGs of the ABA biosynthesis and signaling pathway. B the contents of ABA. The significance of differences was assessed using the Student’s t-test. *p < 0.05, ** p < 0.01. C-J qRT-PCR analysis of the expression patterns of randomly selected ABA-related DEGs. Data are presented as the means ± SD of three technical replicates and three independent biological replicates
Fig. 8
Fig. 8
The expression levels of differentially expressed genes involved in MAPK signal transduction. A Schematic of MAPK signal transduction in the anther of wheat. B Heatmap representation of differentially expressed genes involved in the MAPK signal transduction in MS line and MR line
Fig. 9
Fig. 9
The expression levels of differentially expressed genes involved in alternative splicing. A The schematic diagram of alternative splicing and the structure of spliceosome. B Heatmap representation of differentially expressed genes involved in spliceosome in MS line and MR line
Fig. 10
Fig. 10
Functional classifcation of the DEGs of the anthers between MS line and MR line via MapMan analysis. A, B Metabolism overview. C, D Regulation overview. A, C MSu vs MRu and (B, D) MSb vs MRb. Each square represents a single differentially expressed gene. The log2 (foldchange) (log2FC) was loaded into MAPMAN to generate the color scale varying from -2 to 2. Dark red color indicates higher expression in MS line compared with MR line, and dark blue color signifies more expression in MR line compared with MS line
Fig. 11
Fig. 11
Possible transcriptome-mediated male sterility network in K-type CMS wheat. MITO, mitochondria; ROS, reactive oxygen species; CI51, NADH dehydrogenase; ETFQO, electron transfer flavoprotein alpha; FAD binding, FAD binding domain; CYTC-2, cytochrome c-2; CCB203, cytochrome c biogenesis orf203; AOX, alternative oxidase; UCP, uncoupling protein; IDH, isocitrate dehydrogenase; MDH, malate dehydrogenase; PDC, pyruvate decarboxylase; SPS, sucrose-phosphate synthase; SUS, sucrose synthase; FLS, flavonol synthases; PAL, phenylalanine ammonia-lyase; 4CL, 4-coumarate: CoA ligase; CCR1, cinnamoyl-CoA reductase 1; CAD, cinnamyl alcohol dehydrogenase; ACO, ACC oxidase; EIN3, ethylene insensitive 3; NCED, 9-cis epoxycarotenoid dioxygenases; PP2C, the type 2C protein phosphatases; SnRK2, sucrose non-fermenting-1-related protein kinase 2; YUC, key enzyme for auxin synthesis; SAUR, small auxin-up RNA. We used the software of Adobe Illustrator CS5 (Adobe, America) to draw this figure by ourselves

Similar articles

Cited by

References

    1. Wu H, Shi N, An X, Liu C, Fu H, Cao L, et al. Candidate genes for yellow leaf color in common wheat (Triticum aestivum L.) and major related metabolic pathways according to transcriptome profiling. Int J Mol Sci. 2018;19:1594. doi: 10.3390/ijms19061594. - DOI - PMC - PubMed
    1. Simmonds J, Scott P, Brinton J, Mestre TC, Bush M, Del Blanco A, et al. A splice acceptor site mutation in TaGW2-A1 increases thousand grain weight in tetraploid and hexaploid wheat through wider and longer grains. TAG Theor Appl Genet. 2016;129:1099–1112. doi: 10.1007/s00122-016-2686-2. - DOI - PMC - PubMed
    1. Tucker EJ, Baumann U, Kouidri A, Suchecki R, Baes M, Garcia M, et al. Molecular identification of the wheat male fertility gene Ms1 and its prospects for hybrid breeding. Nat Commun. 2017;8:869. doi: 10.1038/s41467-017-00945-2. - DOI - PMC - PubMed
    1. Zhang L, Wang C, Yu Y, Zhang Y, Song Y, Li Z, et al. Cyclin-dependent kinase inhibitor gene TaICK1 acts as a potential contributor to wheat male sterility induced by a chemical hybridizing agent. Int J Mol Sci. 2020;21:2468. doi: 10.3390/ijms21072468. - DOI - PMC - PubMed
    1. Wu B, Xia Y, Zhang G, Wang J, Ma S, Song Y, et al. The transcription factors TaTDRL and TaMYB103 synergistically activate the expression of TAA1a in wheat, which positively regulates the development of microspore in arabidopsis. Int J Mol Sci. 2022;23:7996. doi: 10.3390/ijms23147996. - DOI - PMC - PubMed