. 2023 Dec 6;23(1):311.
doi: 10.1186/s12935-023-03166-4.

Single-cell histone chaperones patterns guide intercellular communication of tumor microenvironment that contribute to breast cancer metastases

Affiliations

Single-cell histone chaperones patterns guide intercellular communication of tumor microenvironment that contribute to breast cancer metastases

Jindong Xie et al. Cancer Cell Int. .

Abstract

Background: Histone chaperones (HCs) are crucial for governing genome stability and gene expression in multiple cancers. However, the functioning of HCs in the tumor microenvironment (TME) is still not clearly understood.

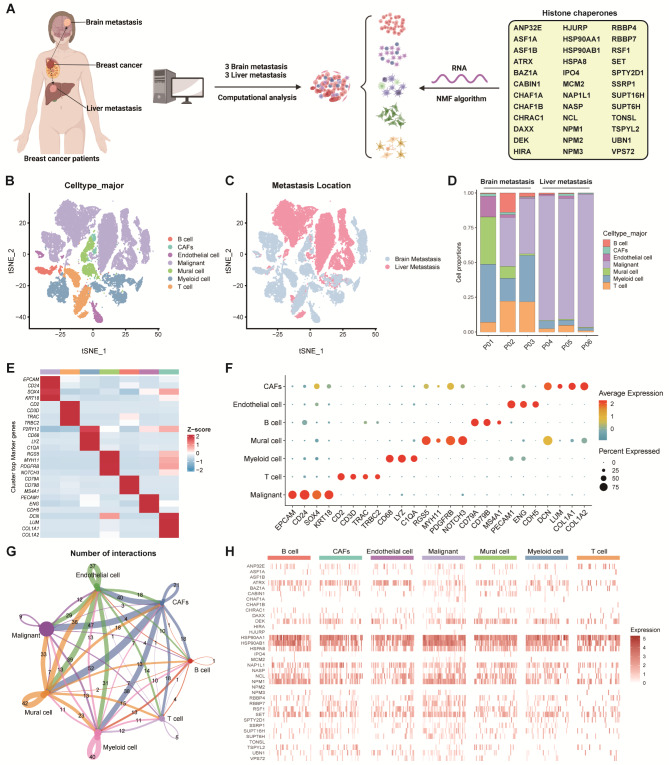
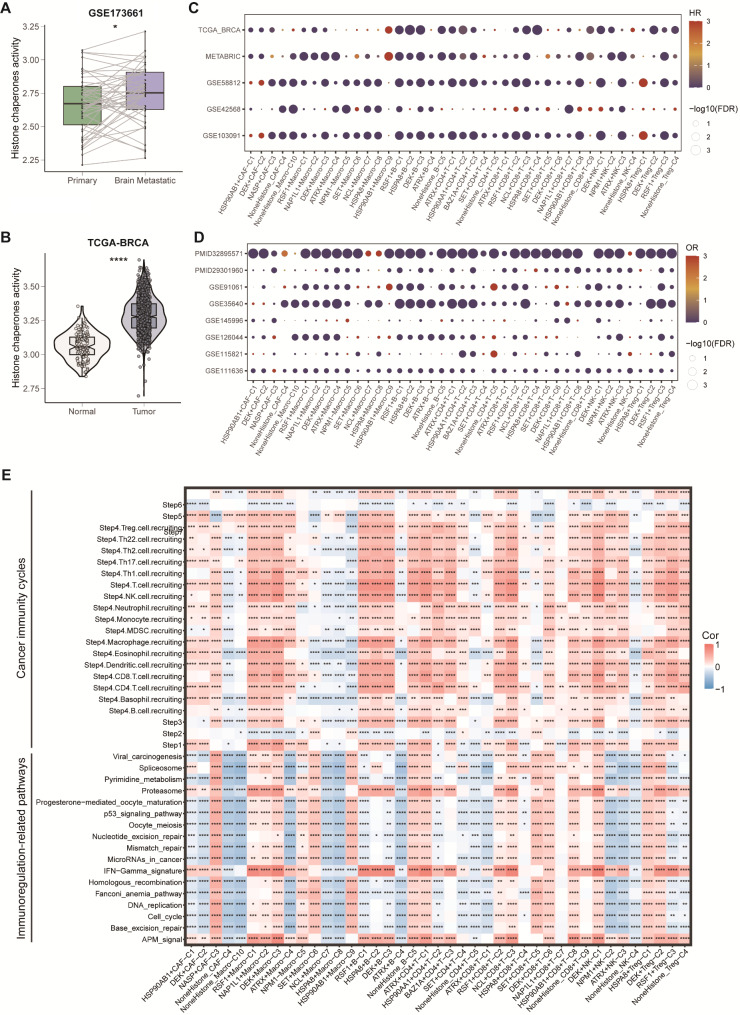
Methods: Self-tested single-cell RNA-seq data derived from 6 breast cancer (BC) patients with brain and liver metastases were reanalyzed by nonnegative matrix factorization (NMF) algorithm for 36 HCs. TME subclusters were observed with BC and immunotherapy public cohorts to assess their prognosis and immune response. The biological effect of HSPA8, one of the HCs, was verified by transwell assay and wound-healing assays.

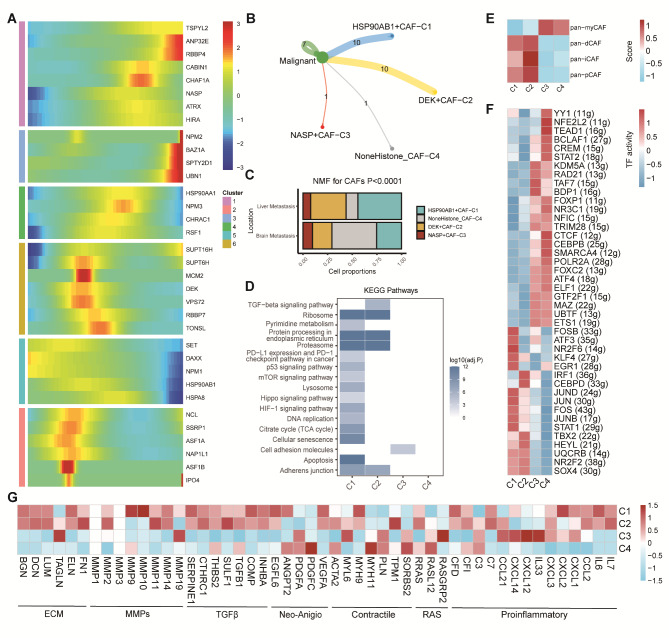
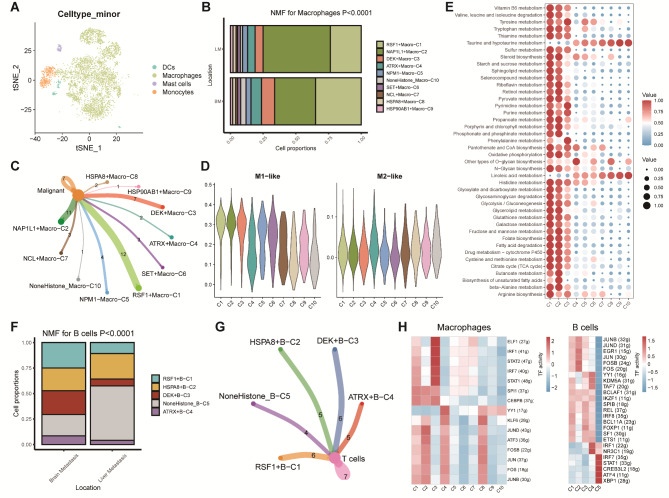
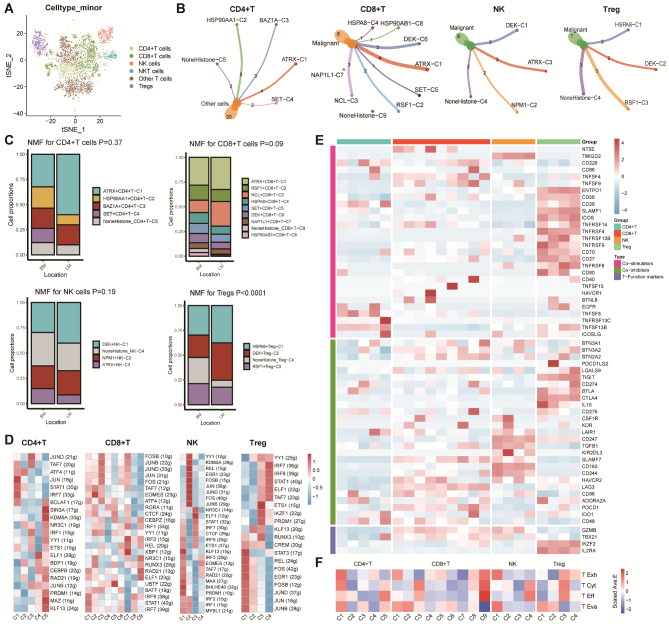
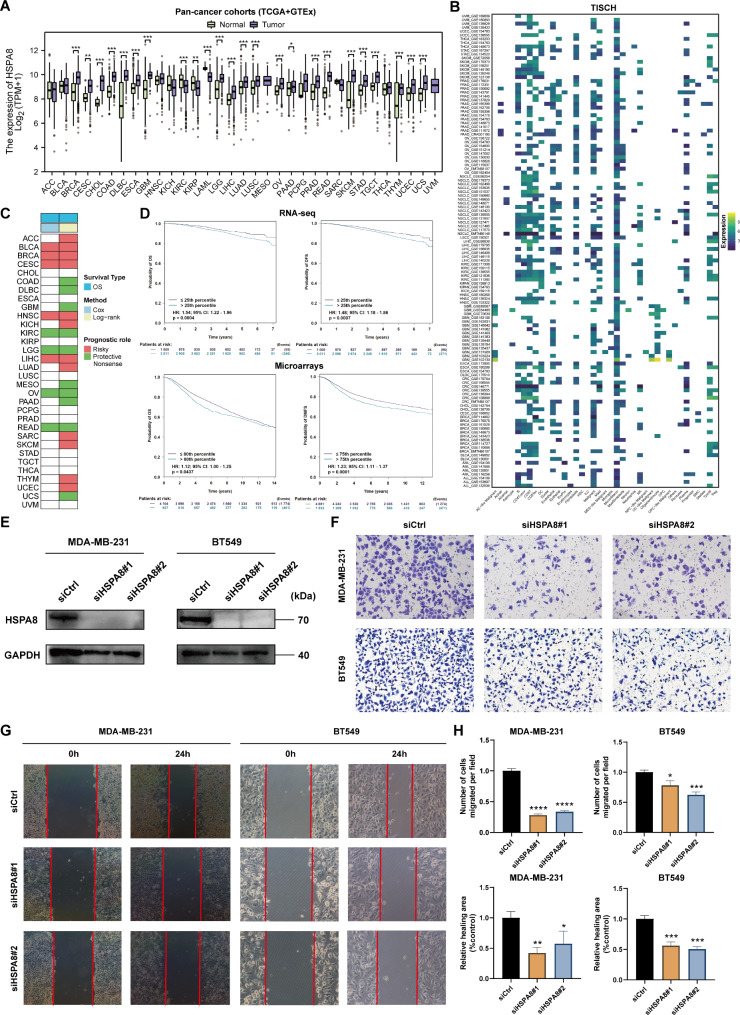
Results: Cells including fibroblasts, macrophages, B cells, and T cells, were classified into various subclusters based on marker genes. Additionally, it showed that HCs might be strongly associated with biological and clinical features of BC metastases, along with the pseudotime trajectory of each TME cell type. Besides, the results of bulk-seq analysis revealed that TME cell subclusters mediated by HCs distinguished significant prognostic value for BC patients and were relevant to patients' immunotherapy responses, especially for B cells and macrophages. In particular, CellChat analysis exhibited that HCs-related TME cell subclusters revealed extensive and diverse interactions with malignant cells. Finally, transwell and wound-healing assays exhibited that HSPA8 deficiency inhibited BC cell migration and invasion.

Conclusions: Collectively, our study first dissected HCs-guided intercellular communication of TME that contribute to BC metastases.

Keywords: Breast cancer; Histone chaperones; Prognosis; Single-cell; Tumor microenvironment.


Conflict of interest statement

The authors declare no competing interests.

Figures

Fig. 1
Fig. 1
Overview of HCs in the scRNA-seq data for BC. (A) The overall design of the present study. (B) t-SNE plot of single cells profiled in our previous study colored by major cell type. (C) t‐SNE plot of single cells profiled in our previous study colored by metastasis location. (D) The composition of each cell type from brain metastasis and liver metastasis patients. (E) Heatmap distribution of top marker genes in each cell type. (F) Bubble plot of the average and percent expression of top marker genes in each cell type. (G) Cell–Cell communications among cell types by Cellchat analysis. (H) Heatmap of the expression of HCs in each cell type
Fig. 2
Fig. 2
HCs modified the features of CAFs. (A) Trajectory analysis revealed the role of HCs in CAFs. (B) Cell–Cell communications from HCs-mediated CAFs to malignant cells. (C) Bar plot for 4 HCs-mediated CAFs clusters between brain metastasis and liver metastasis patients. (D) Heatmap showing the activated KEGG pathways in HCs‑mediated CAFs. (E) Different HCs-mediated CAFs clusters were correlated with the previous signatures. (F) Heatmap showing the significantly different TFs among HCs-mediated CAFs. (G) Heatmap showing the different average expression of common signaling pathway genes in the HCs-mediated CAFs, including collagens, ECM, MMPs, TGFβ, Neo-Angio, Contractile, RAS and Proinflammatory
Fig. 3
Fig. 3
NMF clusters of HCs for macrophages and B cells. (A) t-SNE plot of myeloid cells. (B) Bar plot for 10 HCs-mediated macrophages clusters between brain metastasis and liver metastasis patients. (C) Cell–Cell communications between main HCs-mediated macrophage cells to malignant cells by Cellchat analysis. (D) Violin plots of M1 and M2 macrophage-related signatures scores among HCs-mediated macrophages clusters. (E) Heatmap showing significantly different metabolic signaling pathways among HCs-mediated macrophages clusters. (F) Bar plot for 5 HCs-mediated B cells clusters between brain metastasis and liver metastasis patients. (G) Cell–Cell communications between main HCs-mediated B cells to T cells by Cellchat analysis. (H) Heatmap showing the significantly different TFs among HCs-mediated macrophages and B cell clusters
Fig. 4
Fig. 4
NMF clusters of HCs for T/NK cells. (A) t-SNE plot of T/NK cells by six cell types, including CD4 + T cells, CD8 + T cells, Tregs, NK cells, NKT cells, and other T cells. (B) Cell–Cell communications from main HCs-mediated T/NK cells to other cells by Cellchat analysis. (C) Bar plot of main HCs-mediated T/NK cells clusters between brain metastasis and liver metastasis patients. (D) Heatmap showing significantly different TFs among HCs-mediated clusters in CD4 + T cells, CD8 + T cells, NK cells, and Tregs. (E, F) Heatmap showing significantly different features among T clusters in CD4 + T cells, CD8 + T cells, NK cells, and Tregs, including immune stimulators, inhibitors and T cell function marker genes, as well as four T function signatures (T exhaustion score, T cytotoxic score, T effector score, and T evasion score)
Fig. 5
Fig. 5
Overall of the prognosis, immunotherapy response and immunity pathways correlations of HCs-mediated cells types in the public bulk RNA-seq cohorts. (A) Box plot of HCs activity between primary and paired brain metastatic tissues in GSE173661 cohort (* p < 0.05). (B) Violin plot of HCs activity between normal and tumor tissues in the TCGA-BRCA cohort (**** p < 0.0001). (C) Bubble plot of OS analyses (data from 5 BC cohorts). (D) Bubble plot of immunotherapy response analyses (data from 8 immunotherapy cohorts with response rate) (E) Heatmap showing significant correlations between cancer immunity cycles and immunoregulation-related pathways with all HCs-mediated cluster scores (* p < 0.05, ** p < 0.01, *** p < 0.001, **** p < 0.0001)
Fig. 6
Fig. 6
HSPA8 deficiency inhibits tumor cell migration and invasion. (A) Boxplots of the HSPA8 expression between tumor and normal tissues in the TCGA pan-cancer cohorts (* p < 0.05, ** p < 0.01, *** p < 0.001). (B) Heatmap of the HSPA8 expression among different cell types in TISCH database. (C) Heatmap of the prognostic value of HSPA8 in the TCGA pan-cancer cohorts. (D) Survival analyses of HSPA8 using K-M analyses in BC RNA-seq and microarray datasets from bc-GenExMiner database. (E) Western blot assays showing the efficacy of siRNAs targeting HSPA8 in BC cell lines. (F) Transwell migration assays were performed to measure the migration abilities of HSPA8 in BC cell lines. (G) Wound healing assays were performed to measure the migration abilities of HSPA8 in BC cell lines. (H) Boxplots of the number of cells migrated per field and relative healing area (% control) in BC cell lines (* p < 0.05, ** p < 0.01, *** p < 0.001, **** p < 0.0001). ACC, adrenocortical carcinoma; BLCA, bladder urothelial carcinoma; BRCA, breast invasive carcinoma; CESC, cervical squamous cell carcinoma and endocervical adenocarcinoma; CHOL, cholangiocarcinoma; COAD, colon adenocarcinoma; DLBC, lymphoid neoplasm diffuse large B-cell lymphoma; ESCA, esophageal carcinoma; GBM, glioblastoma multiforme; HNSC, head and neck squamous cell carcinoma; KICH, kidney chromophobe; KIRC, kidney renal clear cell carcinoma; KIRP, kidney renal papillary cell carcinoma; LAML, acute myeloid leukemia; LGG, brain lower grade glioma; LIHC, liver hepatocellular carcinoma; LUAD, lung adenocarcinoma; LUSC, lung squamous cell carcinoma; MESO, mesothelioma; OV, ovarian serous cystadenocarcinoma; PAAD, pancreatic adenocarcinoma; PCPG, pheochromocytoma and paraganglioma; PRAD, prostate adenocarcinoma; READ, rectum adenocarcinoma; SARC, sarcoma; SKCM, skin cutaneous melanoma; STAD, stomach adenocarcinoma; TGCT, testicular germ cell tumors; THCA, thyroid carcinoma; THYM, thymoma; UCEC, uterine corpus endometrial carcinoma; UCS, uterine carcinosarcoma; UVM, ocular melanomas. ALL, acute lymphoblastic leukemia; AML, acute myeloid leukemia; KIPAN, pan-kidney cancer; LSCC, laryngeal squamous cell carcinoma; OS, osteosarcoma

Similar articles

Cited by

References

    1. Sung H, Ferlay J, Siegel RL, Laversanne M, Soerjomataram I, Jemal A, et al. Global Cancer statistics 2020: GLOBOCAN estimates of incidence and Mortality Worldwide for 36 cancers in 185 countries. CA Cancer J Clin. 2021;71(3):209–49. doi: 10.3322/caac.21660. - DOI - PubMed
    1. Hammond CM, Stromme CB, Huang H, Patel DJ, Groth A. Histone chaperone networks shaping chromatin function. Nat Rev Mol Cell Biol. 2017;18(3):141–58. doi: 10.1038/nrm.2016.159. - DOI - PMC - PubMed
    1. Watanabe R, Kanno SI, Mohammadi Roushandeh A, Ui A, Yasui A. Nucleosome remodelling, DNA repair and transcriptional regulation build negative feedback loops in cancer and cellular ageing. Philos Trans R Soc Lond B Biol Sci. 2017;372(1731). - PMC - PubMed
    1. Nandy D, Rajam SM, Dutta D. A three layered histone epigenetics in Breast cancer Metastasis. Cell Biosci. 2020;10:52. doi: 10.1186/s13578-020-00415-1. - DOI - PMC - PubMed
    1. Montes de Oca R, Gurard-Levin ZA, Berger F, Rehman H, Martel E, Corpet A, et al. The histone chaperone HJURP is a new Independent prognostic marker for luminal A breast carcinoma. Mol Oncol. 2015;9(3):657–74. doi: 10.1016/j.molonc.2014.11.002. - DOI - PMC - PubMed

LinkOut - more resources