. 2023 Dec 6;42(1):333.
doi: 10.1186/s13046-023-02897-6.

Immune checkpoints are predominantly co-expressed by clonally expanded CD4+FoxP3+ intratumoral T-cells in primary human cancers

Affiliations

Immune checkpoints are predominantly co-expressed by clonally expanded CD4+FoxP3+ intratumoral T-cells in primary human cancers

Delphine Bredel et al. J Exp Clin Cancer Res. .

Abstract

Background: In addition to anti-PD(L)1, anti-CTLA-4 and anti-LAG-3, novel immune checkpoint proteins (ICP)-targeted antibodies have recently failed to demonstrate significant efficacy in clinical trials. In these trials, patients were enrolled without screening for drug target expression. Although these novel ICP-targeted antibodies were expected to stimulate anti-tumor CD8 + T-cells, the rationale for their target expression in human tumors relied on pre-clinical IHC stainings and transcriptomic data, which are poorly sensitive and specific techniques for assessing membrane protein expression on immune cell subsets. Our aim was to describe ICP expression on intratumoral T-cells from primary solid tumors to better design upcoming neoadjuvant cancer immunotherapy trials.

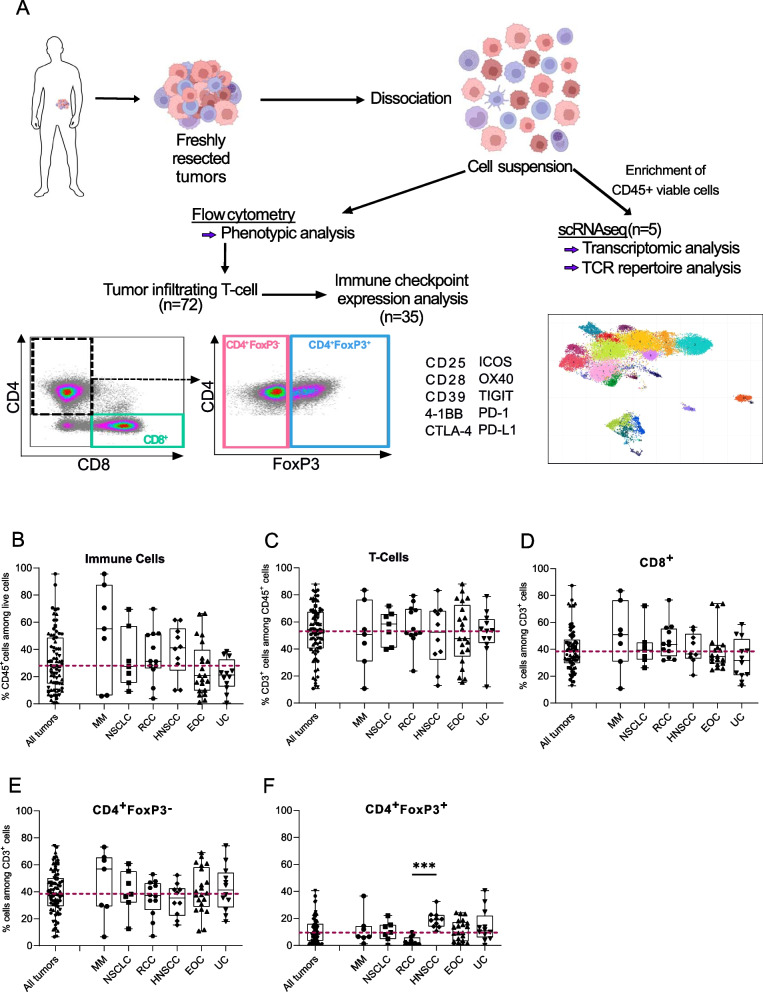
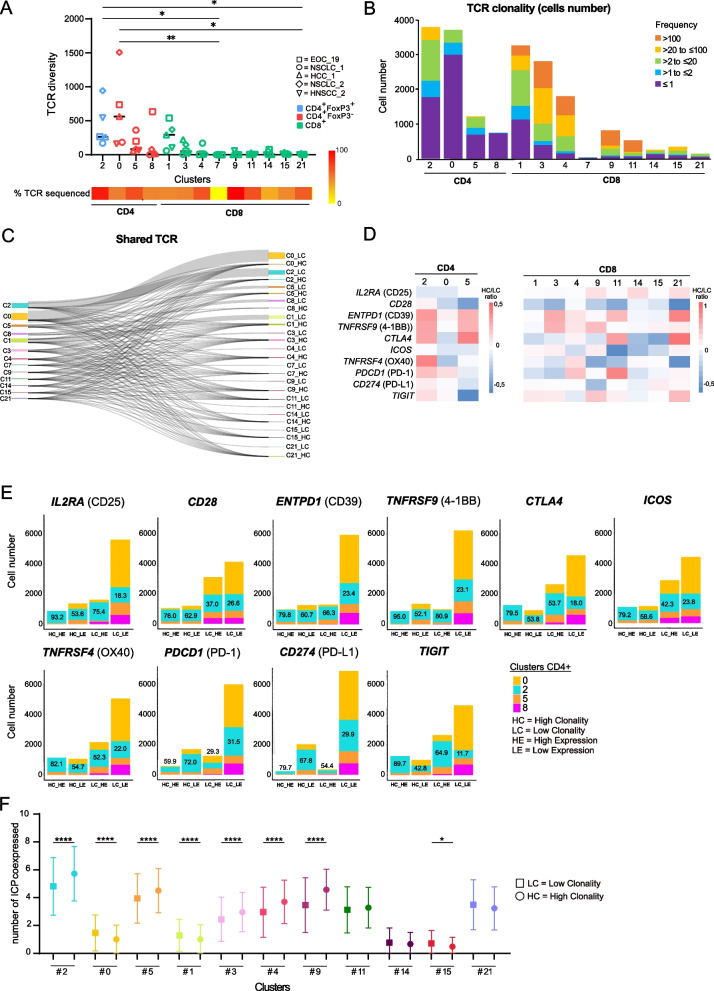
Methods: We prospectively performed multiparameter flow cytometry and single-cell RNA sequencing (scRNA-Seq) paired with TCR sequencing on freshly resected human primary tumors of various histological types to precisely determine ICP expression levels within T-cell subsets.

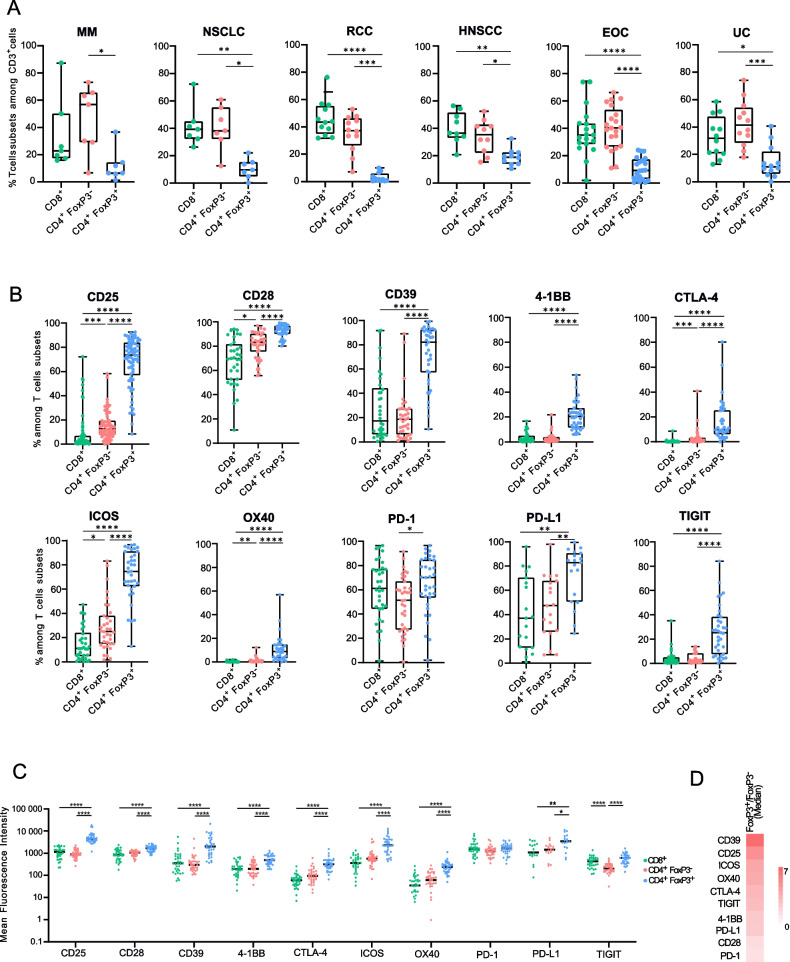
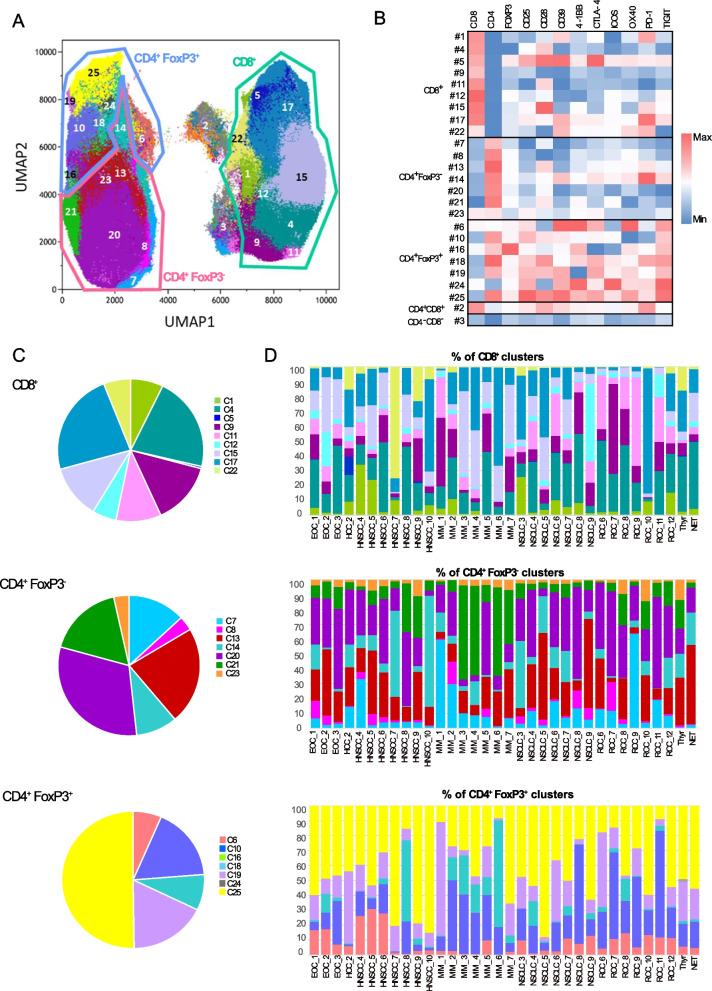
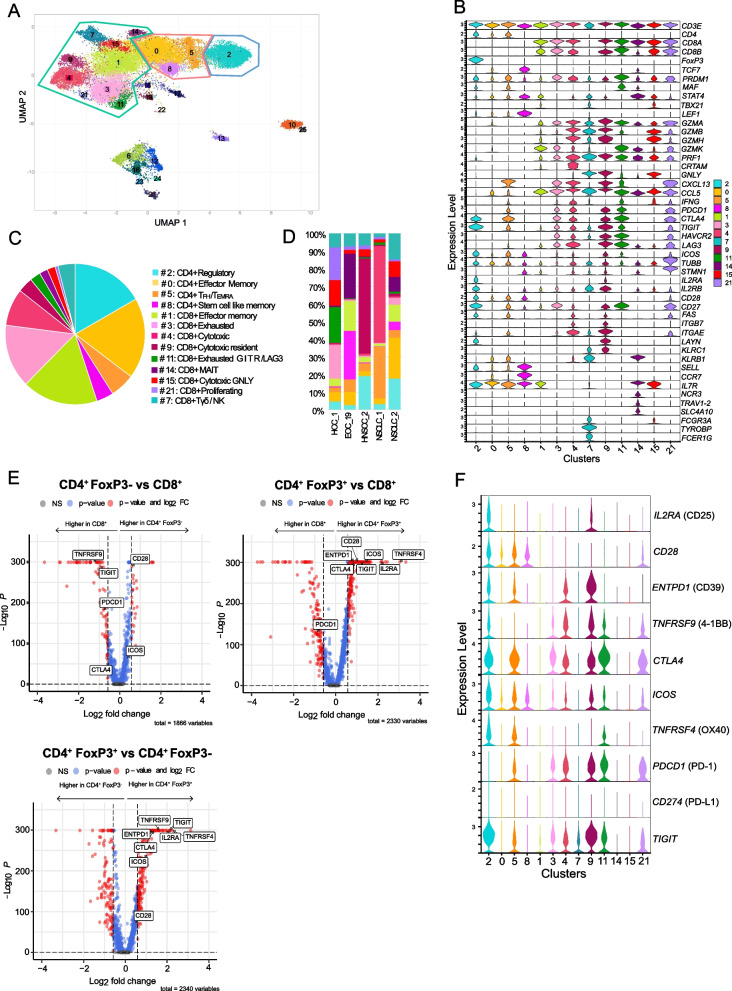
Results: Within a given tumor type, we found high inter-individual variability for tumor infiltrating CD45 + cells and for T-cells subsets. The proportions of CD8+ T-cells (~ 40%), CD4+ FoxP3- T-cells (~ 40%) and CD4+ FoxP3+ T-cells (~ 10%) were consistent across patients and indications. Intriguingly, both stimulatory (CD25, CD28, 4-1BB, ICOS, OX40) and inhibitory (PD-1, CTLA-4, PD-L1, CD39 and TIGIT) checkpoint proteins were predominantly co-expressed by intratumoral CD4+FoxP3+ T-cells. ScRNA-Seq paired with TCR sequencing revealed that T-cells with high clonality and high ICP expressions comprised over 80% of FoxP3+ cells among CD4+ T-cells. Unsupervised clustering of flow cytometry and scRNAseq data identified subsets of CD8+ T-cells and of CD4+ FoxP3- T-cells expressing certain checkpoints, though these expressions were generally lower than in CD4+ FoxP3+ T-cell subsets, both in terms of proportions among total T-cells and ICP expression levels.

Conclusions: Tumor histology alone does not reveal the complete picture of the tumor immune contexture. In clinical trials, assumptions regarding target expression should rely on more sensitive and specific techniques than conventional IHC or transcriptomics. Flow cytometry and scRNAseq accurately characterize ICP expression within immune cell subsets. Much like in hematology, flow cytometry can better describe the immune contexture of solid tumors, offering the opportunity to guide patient treatment according to drug target expression rather than tumor histological type.

Keywords: Cancer; Flow cytometry; Immune checkpoints; Immunology; Immunotherapy; Single-cell RNA-Seq; T-cells; TCR repertoire.


Conflict of interest statement

This project was funded by the Fondation MSD Avenir (https://www.msdavenir.fr/). Gustave Roussy received funding for running industry sponsored clinical trials from companies developing antibodies against most of the immune checkpoints described in this manuscript: Roche/Genentech, Tesaro/GSK, BMS, Pfizer, Novartis, Medimmune/Astra Zeneca, Sanofi, Eli Lilly, Innate Pharma, Merck (MSD), Merck Serono, Symphogen/Servier. AM has been an investigator of clinical trials and/or has provided expertise through consulting and scientific advisory boards for Roche/Genentech, GSK, BMS, Pfizer, Novartis, Medimmune/Astra Zeneca, Sanofi, Eli Lilly, Innate Pharma, Merck (MSD), Merck Serono, Symphogen/Servier.

Figures

Fig. 1
Fig. 1
Proportions of T-cell subsets in the tumor microenvironment are independent of tumor histological types. A Freshly resected tumors from various histologies (n = 72) were collected and dissociated into a cell suspension and stained for T cell subset identification. Immune checkpoints (ICPs) expression was assessed in CD8+, CD4+FoxP3 and CD4+FoxP3+ T cells at the protein level using flow cytometry (n = 35) and at the transcriptomic level using single-cell RNA sequencing, including TCR sequencing (n = 5). Created with BioRender.com. Flow cytometry analysis from 72 fresh tumor specimens. B Percentage of CD45+ among live cells in the different histologies. C Percentage of CD3+ T-cells among CD45+ cells according to the different histologies. Percentage of CD8+ (D), CD4+FoxP3 (E) and CD4+FoxP3+ (F) among CD3+ cells in the different histologies. The red dotted line delineates the median of the whole cohort. Dunn’s multiple comparison test, *p value ≤ 0.05; **p value ≤ 0.01; ***p value ≤ 0.001; ****p value ≤ 0.0001. MM: Metastatic Melanoma; NSCLC: Non-Small Cell Lung Carcinoma; RCC: Renal Cell Carcinoma; HNSCC: Head and Neck Squamous Cell Carcinoma; EOC: Epithelial Ovarian Cancer; UC: Urothelial Carcinoma
Fig. 2
Fig. 2
Intratumoral CD4+FoxP3+ cells make up a small subset but display the highest levels of immune checkpoint protein expression. A Proportions of T cell subsets, i.e., CD8+, CD4+FoxP3 and CD4+FoxP3+ in MM, NSCLC, RCC, HNSCC, EOC, and UC obtained by flow cytometry analysis of 72 freshly resected tumor specimens. B Percentage of immune checkpoint protein (ICP) positive cells in CD8+, CD4+FoxP3 and CD4 + FoxP3 + T cells from 35 tumor specimens. C Mean fluorescence intensity of ICPs in CD8+, CD4+FoxP3 and CD4+FoxP3+ T cells from 35 tumor specimens. Dunn’s multiple comparison test was performed independently for each ICP. D Heat map displaying the ratio of the ICP median MFI of CD4+FoxP3+ cells over CD4+FoxP3.. Dunn’s multiple comparison test, *p value ≤ 0.05; **p value ≤ 0.01; ***p value ≤ 0.001; ****p value ≤ 0.0001. MM: Metastatic Melanoma; NSCLC: Non-Small Cell Lung Carcinoma; RCC: Renal Cell Carcinoma; HNSCC: Head and Neck Squamous Cell Carcinoma; EOC: Epithelial Ovarian Cancer; UC: Urothelial Carcinoma; ICPs: Immune Checkpoints: (CD25, CD28, CD39, 4-1BB, CTLA-4, ICOS, OX40, PD-1, PD-L1, and TIGIT)
Fig. 3
Fig. 3
Unsupervised clustering of T-cell subsets according to the level of membrane protein expression. Unsupervised clustering analysis of flow cytometric dataset using PhenoGraph algorithm (n = 34). A UMAP displaying the 25 clusters defined based on the fluorescence intensity of each marker tested, including ICPs. B Heatmap showing the protein expression patterns in each cluster. Fluorescence intensity of each marker has been normalized independently. C Pie charts representing the relative abundance (mean) of each cluster in the whole cohort, in CD8+, CD4+FoxP3 and CD4+FoxP3.+ T cells (left panels); stacked bar chart displaying the relative abundance of each cluster in each tumor specimen in the 3 T-cell subsets (right panels). ICPs: immune checkpoints: (CD25, CD28, CD39, 4-1BB, CTLA-4, ICOS, OX40, PD-1, PD-L1, and TIGIT)
Fig. 4
Fig. 4
Unsupervised clustering of T-cell subsets according to the level of intracellular gene expression. Single-cell RNA sequencing of five fresh tumor specimens. A UMAP displaying clusters defined based on their gene expression profile. Created with Cerebro (R-studio©). The list of genes expressed by each cluster is provided in Supplementary Data 11. B Stacked violin plot displaying the expression distribution of selected cell markers in the T cell clusters. C Pie chart showing the relative abundance (mean) of each cluster in the whole cohort. D Stacked bar chart showing the relative abundance of each cluster in each tumor specimen. E Volcano plot displaying differential gene expression between CD4+FOXP3 vs CD8+ T-cells (upper left panel); CD4+FOXP3+ vs CD4+FOXP3T cells (bottom panel) and CD4+FOXP3+ vs CD8.+ T cells (upper right panel). Genes are plotted as log2 fold change versus the − log10 of the adjusted p value. Genes in red are significantly differentially expressed with a fold change > 1.5 compared to the reference population. F. Stacked violin plot displaying the expression distribution of ICPs in the T cell clusters. ICPs: immune checkpoints: (CD25, CD28, CD39, 4-1BB, CTLA-4, ICOS, OX40, PD-1, PD-L1, and TIGIT)
Fig. 5
Fig. 5
Immune checkpoints are more expressed by expanded clonotypes of intratumoral CD4+Foxp3+ T-cells. TCR repertoire analysis from the single-cell RNA sequencing dataset of five fresh tumor specimen. A TCR diversity showing the number of clonotypes per patient in each T cell cluster. Dunn’s multiple comparison test, *p value ≤ 0.05; **p value ≤ 0.01. B Stacked bar chart displaying the distribution of clonotype frequency in each cluster. C Sankey diagram showing clonotype sharing between clusters and according to clonality (LC ≤ 2 cells; HC > 2 cells). D Heatmap displaying differential ICP expression (median Log2 fold-change) between LC and HC T cells in each CD4+ (left panel) and CD8+ (right panel) clusters. E Stacked bar chart showing the distribution of T-cells from CD4+ clusters according to the level of ICP expression (above the median expression level (HE) or below the median expression level (LE)) and the expansion status (LC or HC). Median expression level was calculated independently for each sample and for each ICP. F Graph displaying the average number with standard deviation of ICP expressed per cells in LC and HC T cells for each cluster; Mann–Whitney test, *p value ≤ 0.05; **p value ≤ 0.01; ***p value ≤ 0.001; ****p value ≤ 0.0001.TCR: T cell receptor; LC: low clonality; HC: high clonality. ICPs: immune checkpoints: (CD25, CD28, CD39, 4-1BB, CTLA-4, ICOS, OX40, PD-1, PD-L1, and TIGIT)

References

    1. O’Donnell JS, Teng MWL, Smyth MJ. Cancer immunoediting and resistance to T cell-based immunotherapy. Nat Rev Clin Oncol. 2019;16(3):151–167. doi: 10.1038/s41571-018-0142-8. - DOI - PubMed
    1. Pardoll DM. The blockade of immune checkpoints in cancer immunotherapy. Nat Rev Cancer. 2012;12(4):252–64. doi: 10.1038/nrc3239. - DOI - PMC - PubMed
    1. Bendell JC, Bedard P, Bang YJ, LoRusso P, Hodi S, Gordon M, et al. Abstract CT302: Phase Ia/Ib dose-escalation study of the anti-TIGIT antibody tiragolumab as a single agent and in combination with atezolizumab in patients with advanced solid tumors. Cancer Res. 2020;80(16_Supplement):CT302. doi: 10.1158/1538-7445.AM2020-CT302. - DOI
    1. Niu J, Maurice-Dror C, Lee DH, Kim DW, Nagrial A, Voskoboynik M, et al. First-in-human phase 1 study of the anti-TIGIT antibody vibostolimab as monotherapy or with pembrolizumab for advanced solid tumors, including non-small-cell lung cancer☆. Ann Oncol Off J Eur Soc Med Oncol. 2022;33(2):169–80. doi: 10.1016/j.annonc.2021.11.002. - DOI - PubMed
    1. Curti BD, Kovacsovics-Bankowski M, Morris N, Walker E, Chisholm L, Floyd K, et al. OX40 is a potent immune-stimulating target in late-stage cancer patients. Cancer Res. 2013;73(24):7189–98. doi: 10.1158/0008-5472.CAN-12-4174. - DOI - PMC - PubMed

Substances