. 2023 Dec 6;20(1):291.
doi: 10.1186/s12974-023-02974-9.

An engineered Fc fusion protein that targets antigen-specific T cells and autoantibodies mitigates autoimmune disease

Affiliations

An engineered Fc fusion protein that targets antigen-specific T cells and autoantibodies mitigates autoimmune disease

Mathangi Janakiraman et al. J Neuroinflammation. .

Abstract

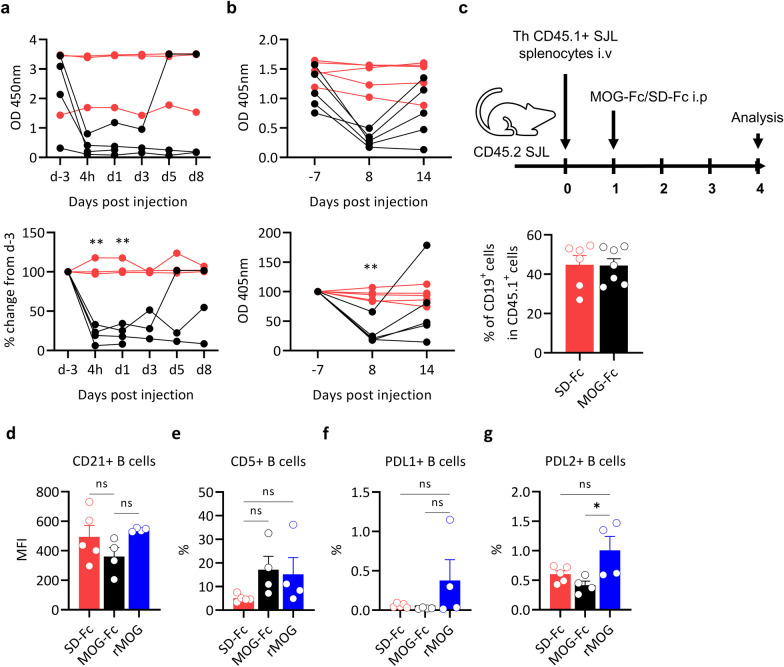
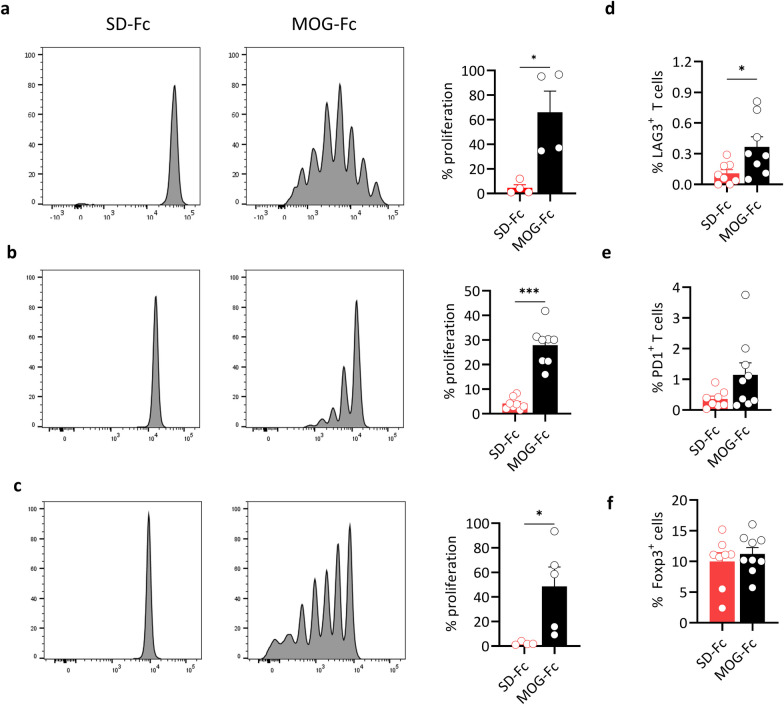
Current effective therapies for autoimmune diseases rely on systemic immunomodulation that broadly affects all T and/or B cell responses. An ideal therapeutic approach would combine autoantigen-specific targeting of both T and B cell effector functions, including efficient removal of pathogenic autoantibodies. Albeit multiple strategies to induce T cell tolerance in an autoantigen-specific manner have been proposed, therapeutic removal of autoantibodies remains a significant challenge. Here, we devised an approach to target both autoantigen-specific T cells and autoantibodies by producing a central nervous system (CNS) autoantigen myelin oligodendrocyte glycoprotein (MOG)-Fc fusion protein. We demonstrate that MOG-Fc fusion protein has significantly higher bioavailability than monomeric MOG and is efficient in clearing anti-MOG autoantibodies from circulation. We also show that MOG-Fc promotes T cell tolerance and protects mice from MOG-induced autoimmune encephalomyelitis. This multipronged targeting approach may be therapeutically advantageous in the treatment of autoimmunity.

Keywords: Autoantibodies; EAE; Fc fusion; Multiple sclerosis; Myelin oligodendrocyte glycoprotein (MOG); T cells; Tolerance.


Conflict of interest statement

The authors declare that they have no competing interests.

Figures

Fig. 1
Fig. 1
Design, production, and characterization of MOG-Fc fusion protein. a Schematic representation of MOG-Fc fusion protein. The extracellular domain of the mouse MOG protein (amino acids 1–118) is depicted in green and the Fc portion of the mouse IgG2c is depicted in blue. The mutations to abolish glycosylation of MOG protein and to disrupt complement and Fc receptor binding sites are indicated within brackets. His-Tag and AviTag sequences were introduced at the C-terminus for purification and detection. b SDS-PAGE (both reducing and non-reducing) of the purified MOG-Fc, SD-Fc proteins, and MOG-specific antibody 8.18C5. c Dose-dependent binding analysis of 8.18C5 and control IgG1. ELISA plates were coated with MOG-Fc or SD-Fc and serially diluted 8.18C5 or IgG1 were added. OD at 450 nm is shown. d Binding of MOG-Fc to serum anti-MOG antibodies. Serum from 2 individual WT SJL/J and RR mice were used (n = 3) for the detection of MOG antibodies by ELISA. OD at 450 nm is shown. e Comparison of the binding efficiencies of MOG-Fc and monomeric MOG to 8.18C5. MOG-Fc or monomeric MOG was coated and detected using serially diluted anti-MOG monoclonal antibody 8.18C5. OD at 450 nm is shown. f Comparison of the binding of MOG-Fc and monomeric MOG to serum anti-MOG antibodies from RR mice. OD at 450 nm is shown. g Detection of MOG-specific B cells by MOG-Fc and monomeric MOG. MOG-Fc and monomeric MOG were biotinylated at their AviTag and tetramerized with a streptavidin-coupled fluorochrome. IgHMOG splenocytes were mixed with wild-type mouse splenocytes at various ratios and used for the staining with tetramerized MOG-Fc or monomeric MOG proteins. Samples were analyzed by flow cytometry and the percentage of MOG binding B cells was shown. **P = 0.0078 (Wilcoxon matched-pairs signed rank test). h Residual MOG-Fc or SD-Fc in WT SJL/J mice after a single injection. 200 µg of MOG-Fc or SD-Fc was injected into the mice (n = 6 per group) and sera were collected after 4 h and on days 1, 3, 5, and 8 post-injections. Residual-MOG ELISA was performed and the OD at 405 nm is shown. All experiments were performed at least twice
Fig. 2
Fig. 2
MOG-Fc depletes anti-MOG antibodies but spares MOG-reactive B cells. a Kinetics of the depletion of anti-MOG antibodies in the serum of RR mice injected with MOG-Fc (n = 4) or SD-Fc (n = 3); RR mice were injected with 200 µg of MOG-Fc or SD-Fc and the sera were collected 3 days before injection, 4 h after injection, and on days 1, 3, 5 and 8 after injection. anti-MOG IgG ELISA was performed and OD at 450 nm (top panel), and percent change compared to day -3 (bottom panel) are shown. Each circle represents one mouse. **P = 0.0021 at 4 h, **P = 0.0012 at day 1 (Sidak’s multiple comparison test). b Depletion of anti-MOG antibodies in the serum of RR mice injected with MOG-Fc (n = 5), SD-Fc (n = 5). RR mice were injected with 200 µg of MOG-Fc or SD-Fc and the sera were collected 7 days before injection and on days 8 and 14 after injection. anti-MOG IgG ELISA was performed and OD 405 nm (top panel), and percent change compared to day -7 (bottom panel) are shown. One representative experiment out of 3 experiments performed is shown. Each circle represents one mouse. **P = 0.0026 (Sidak’s multiple comparison test). c Splenocytes from CD45.1+ IgHMOG SJL/J mice were transferred i.v. to CD45.2+ SJL/J mice which were subsequently injected with 200 µg of MOG-Fc (n = 6) or SD-Fc (n = 6). Experimental setup (top panel) and the frequencies of B cells (bottom panel) among the transferred CD45.1+ cells analyzed by flow cytometry 3 days after MOG-Fc and SD-Fc injection were shown. Each circle represents one mouse. Data from 2 experiments are pooled. Data are represented as mean ± s.e.m. d–g IgHMOG C57BL/6 mice received 200 µg of MOG-Fc (n = 4) or SD-Fc (n = 5) or rMOG (n = 4). After 3 days, lymph node cells were analyzed by flow cytometry. Each circle represents one mouse. The Mean Fluorescence Intensity (MFI) of CD21 (d), frequencies of CD5+ cells (e), frequencies of PDL1+ cells (f), and frequencies of PDL2+ cells (g) in IgHMOG B cells are shown. All data are represented as mean ± s.e.m. All experiments were performed at least twice
Fig. 3
Fig. 3
Effect of MOG-Fc on antigen presentation and T cell functionality. a Proliferation of MOG-specific CD4+ T cells that were cocultured with IgHMOG B cells preloaded with MOG-Fc or SD-Fc (n = 4 per group). Representative flow cytometry plots (left panel) and the percentage of proliferating T cells (right panel) are shown. *P = 0.0286 (Mann–Whitney’s U test). b The proliferation of MOG-specific CD4+ T cells in vivo in the presence of antigen preloaded IgHMOG B cells. WT C57BL/6 mice received (i.v.) IgHMOG B cells preloaded with MOG-Fc (n = 8) or SD-Fc (n = 8), and one day later they received (i.v.) CD4+ T cells from OSE mice. Representative flow cytometry plots (left panel) and the percentage of proliferating T cells (right panel) are shown. Each circle represents one mouse. Data from 2 experiments are pooled. ***P = 0.0002 (Mann–Whitney’s U test). c The proliferation of MOG-specific CD4+ T cells in vivo in the presence of soluble MOG antigen and IgHMOG B cells. WT C57BL/6 mice received (i.v.) OSE splenocytes cells and 2 days later they were injected (i.p.) with 200 µg of MOG-Fc (n = 5) or SD-Fc (n = 5). Representative flow cytometry plots (left panel) and the percentage of proliferating T cells (right panel) are shown. Each circle represents one mouse. Data from 2 experiments are pooled. ***P = 0.0159 (Mann–Whitney’s U test). d–f WT C57BL/6 mice received (i.v.) OSE splenocytes along with 200 µg of MOG-Fc (n = 9) or SD-Fc (n = 8). After 3 days, lymph node cells were analyzed by flow cytometry. Each circle represents an individual mouse. Data from 2 experiments are pooled. d The frequencies of LAG3+ cells as a percentage of MOG-specific CD4+ T cells. *P = 0.0351 (unpaired T-test). e The frequencies of PD1+ cells as a percentage of MOG-specific CD4+ T cells; f the frequencies of Foxp3+ cells as a percentage of total CD4+ T cells. All data are represented as mean ± s.e.m. All experiments were performed at least twice
Fig. 4
Fig. 4
MOG-Fc mitigates EAE in C57BL/6 mice. a–c EAE incidence (a), mean clinical score (b), mean maximal scores (c) after immunization of C57BL/6 mice with MOG 35–55 in CFA (MOG-Fc n = 14, SD-Fc n = 14). Data from 2 experiments are pooled. ****P < 0.0001 (log-rank Mantel–Cox test). d–h The numbers of total (d), IFNγ+ (e), IL-17+ (f), IFNγ+ IL-17+ (g) and Foxp3+ (h) CD4+ T cells in the spinal cords of healthy (asymptomatic) and sick mice treated with MOG-Fc or SD-Fc (MOG-Fc healthy n = 4, MOG-Fc sick n = 2, SD-Fc sick n = 7). Each circle represents an individual mouse. d *P = 0.0359, SD-Fc sick vs MOG-Fc healthy; f *P = 0.0164, SD-Fc sick vs MOG-Fc healthy; h **P = 0.0082, SD-Fc sick vs MOG-Fc sick, *P = 0.0401, MOG-Fc sick vs MOG-Fc healthy. All data are represented as mean ± s.e.m. An unpaired T-test with Welch’s correction was used for group comparisons

References

    1. Li R, Patterson KR, Bar-Or A. Reassessing B cell contributions in multiple sclerosis. Nat Immunol. 2018;19:696. doi: 10.1038/s41590-018-0135-x. - DOI - PubMed
    1. Berer K, Wekerle H, Krishnamoorthy G. B cells in spontaneous autoimmune diseases of the central nervous system. Mol Immunol. 2011;48(11):1332–1337. doi: 10.1016/j.molimm.2010.10.025. - DOI - PubMed
    1. Petersone L, Edner NM, Ovcinnikovs V, Heuts F, Ross EM, Ntavli E, Wang CJ, Walker LSK. T cell/B cell collaboration and autoimmunity: an intimate relationship. Front Immunol. 2018; 9. - PMC - PubMed
    1. Fugger L, Jensen LT, Rossjohn J. Challenges, progress, and prospects of developing therapies to treat autoimmune diseases. Cell. 2020;181(1):63–80. doi: 10.1016/j.cell.2020.03.007. - DOI - PubMed
    1. Serra P, Santamaria P. Antigen-specific therapeutic approaches for autoimmunity. Nat Biotechnol. 2019;37(3):238–251. doi: 10.1038/s41587-019-0015-4. - DOI - PubMed

LinkOut - more resources