

Similarity-based multimodal regression
- PMID: 38058018
- PMCID: PMC11471965
- DOI: 10.1093/biostatistics/kxad033
Similarity-based multimodal regression
Erratum in
-
Correction.Biostatistics. 2024 Dec 31;26(1):kxae029. doi: 10.1093/biostatistics/kxae029. Biostatistics. 2024. PMID: 39186534 Free PMC article. No abstract available.
Abstract
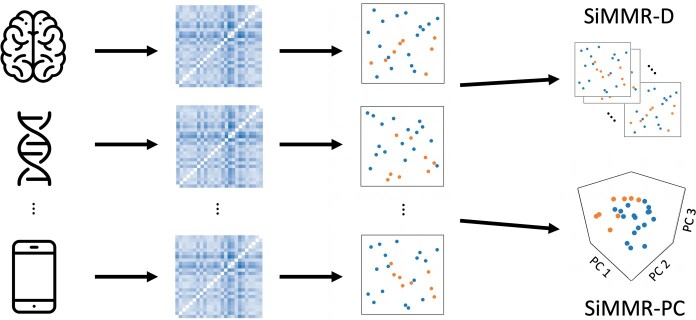
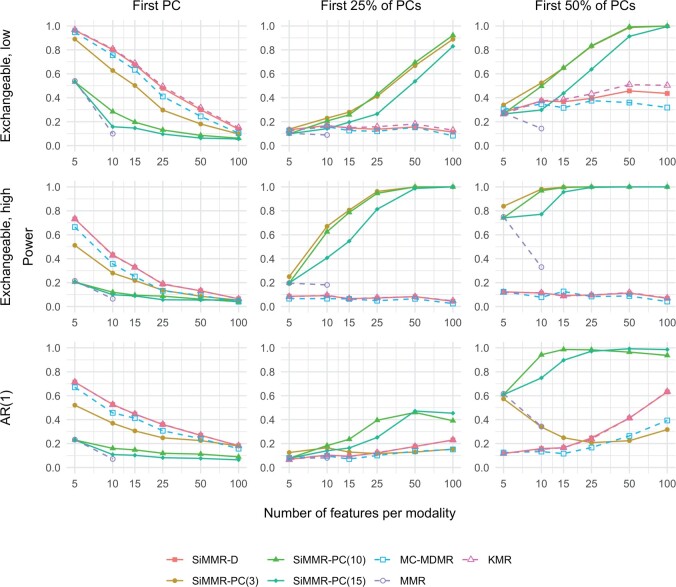
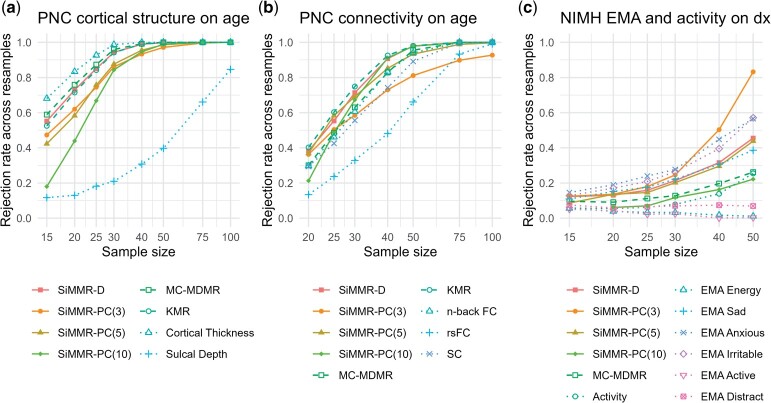
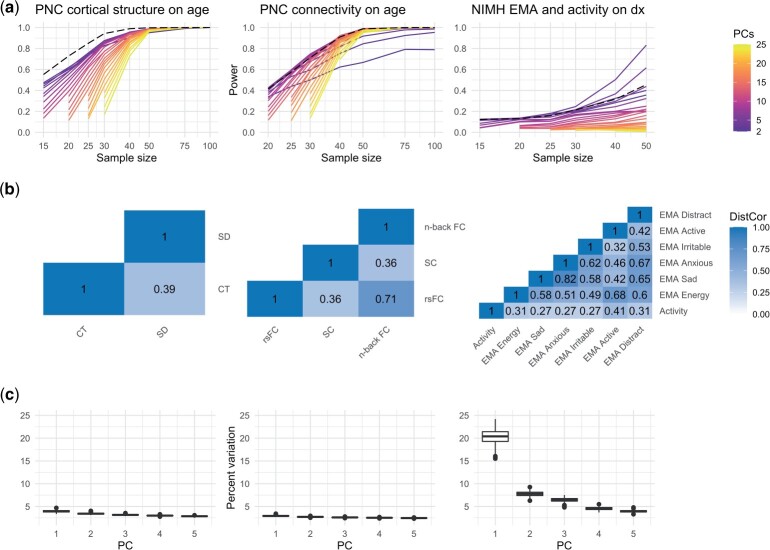
To better understand complex human phenotypes, large-scale studies have increasingly collected multiple data modalities across domains such as imaging, mobile health, and physical activity. The properties of each data type often differ substantially and require either separate analyses or extensive processing to obtain comparable features for a combined analysis. Multimodal data fusion enables certain analyses on matrix-valued and vector-valued data, but it generally cannot integrate modalities of different dimensions and data structures. For a single data modality, multivariate distance matrix regression provides a distance-based framework for regression accommodating a wide range of data types. However, no distance-based method exists to handle multiple complementary types of data. We propose a novel distance-based regression model, which we refer to as Similarity-based Multimodal Regression (SiMMR), that enables simultaneous regression of multiple modalities through their distance profiles. We demonstrate through simulation, imaging studies, and longitudinal mobile health analyses that our proposed method can detect associations between clinical variables and multimodal data of differing properties and dimensionalities, even with modest sample sizes. We perform experiments to evaluate several different test statistics and provide recommendations for applying our method across a broad range of scenarios.
Keywords: distance statistics; mobile health; multimodal; neuroimaging.
Published by Oxford University Press 2023.
Figures
References
-
- Abdi H., O’Toole A. J., Valentin D. and Edelman B. (2005). DISTATIS: the analysis of multiple distance matrices. In: 2005 IEEE Computer Society Conference on Computer Vision and Pattern Recognition (CVPR’05) - Workshops. NY, USA: IEEE, p. 42. doi: 10.1109/CVPR.2005.445. - DOI
-
- Anderson M. J. (2001). A new method for non-parametric multivariate analysis of variance. Austral Ecol. 26(1), 32–46. doi: 10.1111/j.1442-9993.2001.01070.pp.x. - DOI
-
- Baum G. L., Cui Z., Roalf D. R., Ciric R., Betzel R. F., Larsen B., Cieslak M., Cook P. A., Xia C. H., Moore T. M., et al. (2020). Development of structure–function coupling in human brain networks during youth. Proc. Nat. Acad. Sci. USA 117(1), 771–778. doi: 10.1073/pnas.1912034117. - DOI - PMC - PubMed
-
- Cailliez F. (1983). The analytical solution of the additive constant problem. Psychometrika 48(2), 305–308. doi: 10.1007/BF02294026. - DOI
MeSH terms
Grants and funding
LinkOut - more resources
Full Text Sources
