. 2024 Jun 1;109(6):1836-1848.
doi: 10.3324/haematol.2023.284142.

Differences in venous clot structures between hemophilic mice treated with emicizumab versus factor VIII or factor VIIIFc

Affiliations

Differences in venous clot structures between hemophilic mice treated with emicizumab versus factor VIII or factor VIIIFc

Thibaud Sefiane et al. Haematologica. .

Abstract

Recombinant factor VIII (rFVIII), rFVIIIFc and emicizumab are established treatment options in the management of hemophilia A. Each has its unique mode of action, which can influence thrombin generation kinetics and therefore also the kinetics of thrombin substrates. Such differences may potentially result in clots with different structural and physical properties. A starting observation of incomplete wound closure in a patient on emicizumab prophylaxis led us to employ a relevant mouse model in which we noticed that emicizumab-induced clots appeared less stable compared to FVIII-induced clots. We therefore analyzed fibrin formation in vitro and in vivo. In vitro fibrin formation was faster and more abundant in the presence of emicizumab than in the presence of rFVIII/rFVIIIFc. Furthermore, the time-interval between the initiation of fibrin formation and factor XIII activation was twice as long for emicizumab than as for rFVIII/rFVIIIFc. Scanning electron microscopy and immunofluorescent spinning-disk confocal microscopy of in vivo-generated clots confirmed increased fibrin formation in the presence of emicizumab. Unexpectedly, we also detected a different morphology between rFVIII/rFVIIIFcand emicizumab-induced clots. Contrary to the regular fibrin mesh obtained with rFVIII/rFVIIIFc, fibrin fibers appeared to be fused into large patches upon emicizumab treatment. Moreover, fewer red blood cells were detected in regions in which these fibrin patches were present. The presence of highly dense fibrin structures associated with a diffuse fiber structure in emicizumab-induced clots was also observed when using super-resolution imaging. We hypothesize that the modified kinetics of thrombin, fibrin and factor XIIIa generation contribute to differences in structural and physical properties between clots formed in the presence of FVIII or emicizumab.


Figures
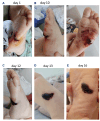
Figure 1.
Figure 1.
Incomplete wound closure. (A) A boy with hemophilia on emicizumab prophylaxis arrived at the hospital with a deep laceration in his foot (day 1). (B) The wound was treated with local application of tranexamic acid and covered with Steristrips. On day 10, the Steri-strips were removed, but the wound was still open, and no wound closure or healing was observed. The patient received treatment with factor VIII on days 10 and 11. (C) On day 12, wound closure was observed and the wound healing process progressed gradually during the following days, as shown by the photographs taken on day 13 (D) and day 16 (E).
Figure 2.
Figure 2.
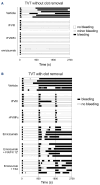
Hemostatic responses after tail-vein transection without and with clot removal. Where the diameter of the tail was 2.3 mm, an incision 0.5 mm deep was made in the left lateral vein. Mice receiving emicizumab also received human FIX and human FX (both at a dose of 100 IU/kg) 5 min before the injury. Both the upper and lower panels depict the bleeding profile of mice receiving vehicle, recombinant FVIII (rVIII), recombinant FVIIIFc (rFVIIIFc) or emicizumab. Plasma concentrations at the start of the procedure were 10 IU/dL for rFVIII and rFVIIIFc and 55 µg/mL for emicizumab. Black represents periods of bleeding, gray periods of minor bleeding, and white periods of non-bleeding. (A) The wound remained unchallenged after transection of the vein. (B) The dotted lines at 900 seconds and 1,800 seconds indicate the timing of clot removal in mice that were not bleeding at those instants. Amounts of blood loss measured in the mice are presented in Online Supplementary Figure S1. Emicizumab + FIX/FX 12’: re-injection of FIX and FX at 12 min in emicizumab-treated mice (i.e., 3 min before the first clot removal). Emicizumab + TXA: emicizumab-treated mice that also received tranexamic acid (10 mg/kg) 5 min before injury; TVT: tail-vein transection.
Figure 3.
Figure 3.
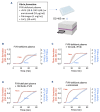
In vitro fibrin formation and fibrinolysis. (A) Schematic representation of in vitro fibrin formation in human FVIII-deficient plasma supplemented with recombinant FVIII (rFVIII) or emicizumab. (B-E) FVIII-deficient plasma (B) was supplemented with rFVIII at a dose of 10 IU/dL (C) or 100 IU/dL (D) or emicizumab at 55 µg/mL (E). In addition, fibrinogen was added (1 mg/mL final concentration) and the reaction was initiated by the addition of CaCl2. No other additives (tissue factor or FXIa) were used. Fibrin formation was detected by monitoring optical density values at 405 nm, while FXIII activity was measured via hydrolysis of the fluorescent A101 substrate (excitation 313 nm; emission 418 nm). Red line: fibrin formation (left Y axis) and blue line: FXIII activity (right Y axis). The mean (solid lines) and standard error (gray area around the solid line) of six to eight measurements are presented. CaCl2: calcium chloride; OD: optical density; AFU: arbitrary fluorescence units.
Figure 4.
Figure 4.
Scanning electron microscopy imaging of in vivo-generated fibrin networks. (A) Experimental approach for the preparation of tissue sections. The black rectangle indicates the region examined using scanning electron microscopy. (B, C) Tail fragments obtained 10 min after tail-vein transection were prepared for scanning electron microscopy using standard pre-fixation with 4% glutaraldehyde and 1% OsO4 and dehydration. Representative images of FVIII-deficient mice treated with recombinant FVIII (B) or emicizumab (C) are shown. Plasma concentrations at the start of the procedure were 10 IU/dL for rFVIII and 55 µg/mL for emicizumab. Scale bars represent 10 microns in the large image, and 5 microns in the amplified images. White boxes indicate regions of numeric zooms. (D-G) ImageJ-plugin software was used to determine fibrin coverage (D), average fibrin diameter (E), number of pores per field (F) and number of intersections per field (G). For each experiment shown in the graphs, two mice were included (round and triangle symbols) and ten fields per mouse were examined. Each symbol represents the result in a single field. The statistical analysis was performed using an unpaired Student t test. rVIII: recombinant factor VIII.
Figure 5.
Figure 5.
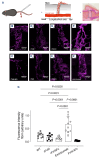
Fibrin content within the injured area. (A) Experimental approach for the preparation of tissue sections. The black rectangle indicates the region examined using spinning disk confocal imaging. (B-F) Sections of tail tissue obtained 10 min after tailvein transection were prepared for immunofluorescence staining using an anti-mouse fibrin antibody. Representative images are shown for wild-type mice (B), untreated FVIII-deficient mice (C); FVIII-deficient mice treated with recombinant FVIII (D1-D2), recombinant FVIIIFc (E1-E2), or emicizumab (F1-F2). Plasma concentrations at the start of the procedure were 10 IU/dL for recombinant FVIII and recombinant FVIIIFc and 55 µg/mL for emicizumab. (G) For each condition, two non-successive tissue sections from five mice (represented by square, round, diamond, up-triangle and down-triangle symbols) were analyzed using ImageJ-soft-ware for the fluorescence intensity (E). Statistical analysis was performed using one-way analysis of variance with Tukey corrections for multiple comparisons. Only statistically significant differences (P<0.05) are indicated. Each symbol represents a separate tissue section from an individual mice, and the mean ± standard deviation are indicated for each condition. WT: wild-type; rFVIII: recombinant factor VIII; rFVIIIFc: recombinant factor VIIIFc; FVIII-KO: factor VIII-knockout.
Figure 6.
Figure 6.
Fibrin structures imaged using stimulated emission depletion microscopy. (A) Experimental approach for the preparation of tissue sections. The black rectangle indicates the region examined using stimulated emission depletion microscopy (STED) microscopy. (B-E) Representative images of wild-type mice (B), FVIII-deficient mice treated with rFVIIIFc (C1-C3), untreated FVIII-deficient mice (D) or FVIII-deficient mice treated with emicizumab (E1-E3). Fibrin was detected using polyclonal goat anti-murine fibrin antibodies, and probed using STAR-RED-labeled donkey anti-goat antibodies. Plasma concentrations at the start of the procedure were 10 IU/dL for rFVIIIFc and 55 µg/mL for emicizumab. (F) For each condition, 30 images from three different mice (10/mouse) were analyzed using ImageJ-software to calculate the presence of dot-like structures. The white arrows in panels C1-C3 indicate examples of dot-like structures. The statistical analysis was performed using one-way analysis of variance with the Dunnet test for multiple comparisons. WT: wild-type; rFIIIFc: recombinant factor VIIIFc; FVIII-KO: factor VIII-knockout.
Figure 7.
Figure 7.
Correlation between in vitro and in vivo fibrin generation. (A) The amount of fibrin generated in vivo (evaluated as fibrin coverage) under different conditions (data presented in Figure 4 and Online Supplementary Figure S3) was plotted against the amount of fibrin generated in vitro (evaluated as maximal [max] absorbance; data presented in Figure 3). (B) The amount of fibrin generated in vivo (evaluated as mean fluorescence intensity [MFI] under different conditions (data presented in Figure 5) was plotted against the amount of fibrin generated in vitro (evaluated as maximal [max] absorbance; data presented in Figure 3). Red symbol: FVIII-KO mice versus FVIII-deficient plasma; orange symbol: FVIII-KO mice receiving 10 IU/dL rFVIII versus FVIII-deficient plasma spiked with 10 IU/dL rFVIII; geen symbol: wild-type mice versus FVIII-deficient plasma spiked with 100 IU/dL rFVIII; blue symbol: FVIII-KO mice receiving emicizumab (55 µg/mL) versus FVIII-deficient plasma spiked with emicizumab (55 µg/mL). WT: wild-type; FVIII: factor VIII; FVIII-KO: factor VIII knockout mice; FVIII-def: factor VIII-deficient.

References

    1. Versteeg HH, Heemskerk JW, Levi M, Reitsma PH. New fundamentals in hemostasis. Physiol Rev. 2013;93(1):327-358. - PubMed
    1. Wolberg AS, Sang Y. Fibrinogen and factor XIII in venous thrombosis and thrombus stability. Arterioscler Thromb Vasc Biol. 2022;42(8):931-941. - PMC - PubMed
    1. Sillen M, Declerck PJ. Thrombin activatable fibrinolysis inhibitor (TAFI): an updated narrative review. Int J Mol Sci. 2021;22(7):3670. - PMC - PubMed
    1. Domingues MM, Macrae FL, Duval C, et al. . Thrombin and fibrinogen gamma’ impact clot structure by marked effects on intrafibrillar structure and protofibril packing. Blood. 2016;127(4):487-495. - PubMed
    1. Lenting PJ, van Mourik JA, Mertens K. The life cycle of coagulation factor VIII in view of its structure and function. Blood. 1998;92(11):3983-3996. - PubMed

Publication types

MeSH terms