. 2023 Nov 15;13(11):5197-5217.
eCollection 2023.

Protocadherin-1 serves as a prognostic biomarker and promotes pancreatic cancer progression by suppressing CD8+ T cell infiltration through CCL5-CCR5 axis

Affiliations

Protocadherin-1 serves as a prognostic biomarker and promotes pancreatic cancer progression by suppressing CD8+ T cell infiltration through CCL5-CCR5 axis

Zhichen Jiang et al. Am J Cancer Res. .

Abstract

Previous studies have shown that Protocadherins (PCDHs) enhance tumor proliferation, invasion, and metastasis; yet their role in pancreatic cancer (PC) progression and the tumor immune microenvironment remains unclear. This study aims to elucidate the role of PCDH1 in different cancer types, with a particular focus on its impact on immune suppression in PC. Utilizing data from TCGA, GTEx, and Gent2 databases, we assessed the expression of PCDH1 across various cancer types. The prognostic value of PCDH1 was demonstrated through Cox regression, Kaplan-Meier analysis, and ROC curve, while its relationship with gene mutations, tumor mutational burden (TMB), immune cell infiltration, and other clinical factors was investigated using Spearman correlation. Furthermore, the effect of PCDH1 on PC malignancy was experimentally validated by a series of in vitro and in vivo assays. Our results show a significant upregulation of PCDH1 in various tumor types, which is associated with poor prognosis, suggesting its potential application as an independent prognostic biomarker. Notably, in PC, PCDH1 exhibited significant associations with gene mutations, TMB, and immune cell infiltration. Clinical validations revealed a correlation between high PCDH1 expression and poor prognosis, coupled with a low level of CD8+ T cell infiltration. Furthermore, both in vitro and in vivo experiments confirmed the role of PCDH1 in promoting PC cell proliferation and migration while inhibiting CD8+ T cell recruitment through its modulation of CCL5-CCR5 axis. In conclusion, PCDH1 regulates the proliferation and migration of PC cells as well as CD8+ T cell infiltration in PC. PCDH1 may serve as a prognostic biomarker in multiple tumor types.

Keywords: CCL5; CCR5; CD8+ T cell; PCDH1; immune; pancreatic cancer.


Conflict of interest statement

None.

Figures

Figure 1
Figure 1
PCDH1 expression across various cancer types. A: PCDH1 expression between tumor tissues and normal tissue from Gent2 database across various cancer types. B: PCDH1 expression between tumor tissues and normal tissue from TCGA database across various cancer types. C: PCDH1 expression between tumor tissues and normal tissue from TCGA and GTEx database across various cancer types (*: P < 0.05; **: P < 0.01; ***: P < 0.001). Abbreviations. TCGA: The Cancer Genome Atlas; GTEx: Genotype-Tissue Expression.
Figure 2
Figure 2
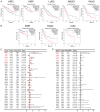
Survival analysis of PCDH1 across various cancer types. A: Kaplan-Meier curves showing OS across various cancer types. Only significant results were shown. B: Kaplan-Meier curves showing DFS across various cancer types. Only significant results were shown. C: Forest map shows the univariate cox regression results of PCDH1 for OS in TCGA. The red cancer is the significant result. D: Forest map shows the univariate cox regression results of PCDH1 for OS in TCGA. The red cancer is the significant result. Abbreviations. OS: Overall survival; DFS: Disease-free survival; TCGA: The Cancer Genome Atlas.
Figure 3
Figure 3
Differential expression and prognostic analysis of PCDH1 in PC. A: The PCDH1 protein level in PAAD was examined using the CPTAC dataset. B: Kaplan-Meier curves showing DFS in PAAD. C: The ROC of PCDH1 predict 1, 3, and 5-year survival in PAAD patients. D: Kaplan-Meier curves showing OS in PC. E: Representative IHC staining for high PCDH1 expression. F: Representative IHC staining for low PCDH1 expression. Abbreviations. PAAD: Pancreatic adenocarcinoma; DFS: Disease-free survival; OS: Overall survival; IHC: Immunohistochemistry; PC: Pancreatic cancer; CPTAC: Clinical Proteomics Tumor Analysis Consortium.
Figure 4
Figure 4
Functional enrichment analysis of PCDH1. A: Heat map of differentially expressed genes in high-low expression group of PCDH1. B: GO enrichment analysis of differentially expressed genes in high and low PCDH1 groups. C: KEGG enrichment analysis of differentially expressed genes in high and low PCDH1 groups. D: PPI analysis of differentially expressed genes in high and low expression group of PCDH1. Abbreviations. GO: Gene Ontology; KEGG: Kyoto Encyclopedia of Genes and Genomes; PPI: Protein-protein interaction.
Figure 5
Figure 5
Relationship between PCDH1 expression and gene mutation, TMB, and DNA methylation. A: Gene mutation in high PCDH1 expression group. B: Gene mutation in low PCDH1 expression group. C: TMB was higher in the group with high PCDH1 expression in PAAD. D: Correlations between PCDH1 expression and TMB in PAAD. E: Kaplan-Meier curves showing OS in PC. F: DNA methylation analysis of PCDH1 in PAAD. Abbreviations. TMB: Tumor mutation burden; OS: Overall survival; PAAD: Pancreatic adenocarcinoma.
Figure 6
Figure 6
PCDH1 promotes the progression of PC cells in vivo and in vitro. A: WB, and qRT-PCR used to reflect PCDH1 expression in different PC cell lines. B: WB, and qRT-PCR used to reflect changes in PCDH1 expression levels after following lentiviral transfection. C: CCK8 assay responding to SW1990, PANC1 proliferation. D: Colony formation assays response to SW1990, PANC1 proliferation. E, F: Wound-healing assay response to SW1990, PANC1 migration ability. G: Representative images depicting the tumors formed in the SW1990-NC/SW1990-SH groups. H: Following 27 consecutive days of tumor volume measurement, mice in the SW1990-NC/SW1990-SH groups were euthanized, and their body weight was recorded. I: Tumor proliferation curves were plotted based on measurements taken over the course of 27 consecutive days in the SW1990-NC/SW1990-SH groups. J: Representative images depicting the tumors formed in the PANC1-NC/PANC1-ORF groups. K: Following 27 consecutive days of tumor volume measurement, mice in the PANC1-NC/PANC1-ORF groups were euthanized, and their body weight was recorded. L: Tumor proliferation curves were plotted based on measurements taken over the course of 27 consecutive days in the PANC1-NC/PANC1-ORF groups. Abbreviations. WB: Western blotting; qRT-PCR: Quantitative real-time PCR.
Figure 7
Figure 7
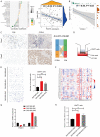
PCDH1 regulates CD8+ T cell infiltration via the CCL5-CCR5 axis. A: Analysis of the TCGA database revealed a negative correlation between PCDH1 expression and CD8+ T cell infiltration. B: At the single-cell level, PCDH1 expression in ductal epithelial cells exhibited a negative correlation with the proportion of CD8+ T cells. C: At the tissue level, PCDH1 expression is negatively correlated with CD8 expression. Case 1 represents a patient exhibiting high CD8 expression and low PCDH1 expression, while Case 2 corresponds to a patient with low CD8 expression and high PCDH1 expression. D: Schematic representation of the CD8+ T cell recruitment assay. E: CM from SW1990-SH1 and SW1990-SH2 cells recruited significantly more CD8+ T cells compared to SW1990-NC cells. F: Analysis of chemokines associated with PCDH1 expression across various cancer types (PAAD results highlighted in red box). G: The downregulation of PCDH1 expression led to a significant increase in CCL5 expression in PC cells. H: Treatment of CD8+ T cells with CM from SW1990-SH1 and SW1990-SH2 cells resulted in higher CCR5 expression levels compared to SW1990-NC cells. Abbreviations. CM: Conditioned medium; CCL5: C-C motif chemokine ligand 5; CCR5: C-C motif chemokine receptor 5; TCGA: The Cancer Genome Atlas; IHC: immunohistochemistry.
Figure 8
Figure 8
Immunological characterization of PCDH1. A: Comparative analysis of immune function between the high and low PCDH1 expression groups. B: Higher neoantigen ratio observed in the PCDH1 high expression group compared to the PCDH1 low expression group. C: Heat map illustrating the correlation between PCDH1 expression and immune checkpoint-related genes. D: Prediction of immunotherapy efficacy in the PCDH1 high and low expression groups. E: Relationship between PCDH1 expression and immune subtypes.

References

    1. Siegel RL, Miller KD, Fuchs HE, Jemal A. Cancer statistics, 2022. CA Cancer J Clin. 2022;72:7–33. - PubMed
    1. Rahib L, Wehner MR, Matrisian LM, Nead KT. Estimated projection of US cancer incidence and death to 2040. JAMA Netw Open. 2021;4:e214708. - PMC - PubMed
    1. Halbrook CJ, Lyssiotis CA, Pasca di Magliano M, Maitra A. Pancreatic cancer: advances and challenges. Cell. 2023;186:1729–1754. - PMC - PubMed
    1. Jiang Z, Wang H, Mou Y, Li L, Jin W. Functions and clinical applications of exosomes in pancreatic cancer. Mol Biol Rep. 2022;49:11037–11048. - PMC - PubMed
    1. Wood LD, Canto MI, Jaffee EM, Simeone DM. Pancreatic cancer: pathogenesis, screening, diagnosis, and treatment. Gastroenterology. 2022;163:386–402. e381. - PMC - PubMed

LinkOut - more resources