. 2023 Dec 6:6:e51844.
doi: 10.2196/51844.

Joint Modeling of Social Determinants and Clinical Factors to Define Subphenotypes in Out-of-Hospital Cardiac Arrest Survival: Cluster Analysis

Affiliations

Joint Modeling of Social Determinants and Clinical Factors to Define Subphenotypes in Out-of-Hospital Cardiac Arrest Survival: Cluster Analysis

Ethan E Abbott et al. JMIR Aging. .

Abstract

Background: Machine learning clustering offers an unbiased approach to better understand the interactions of complex social and clinical variables via integrative subphenotypes, an approach not studied in out-of-hospital cardiac arrest (OHCA).

Objective: We conducted a cluster analysis for a cohort of OHCA survivors to examine the association of clinical and social factors for mortality at 1 year.

Methods: We used a retrospective observational OHCA cohort identified from Medicare claims data, including area-level social determinants of health (SDOH) features and hospital-level data sets. We applied k-means clustering algorithms to identify subphenotypes of beneficiaries who had survived an OHCA and examined associations of outcomes by subphenotype.

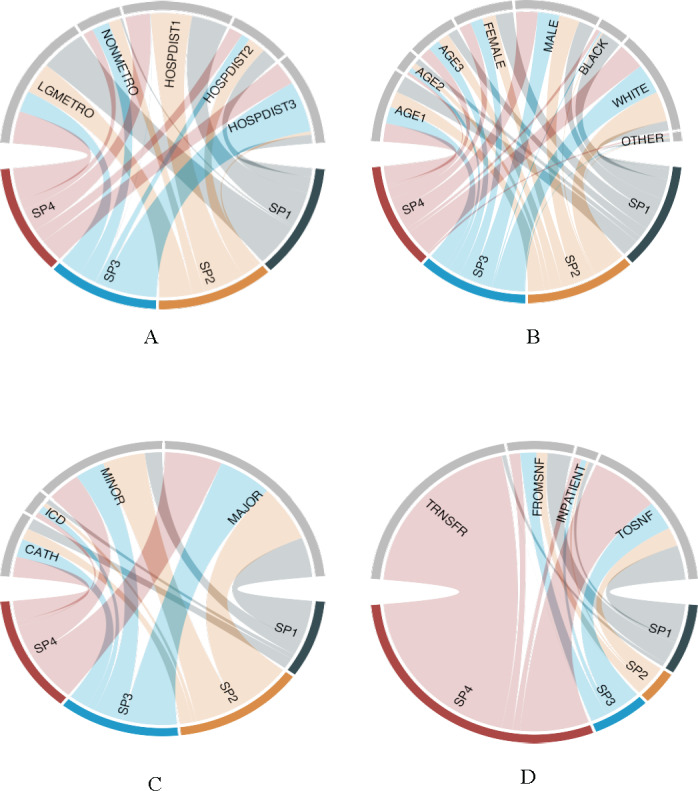
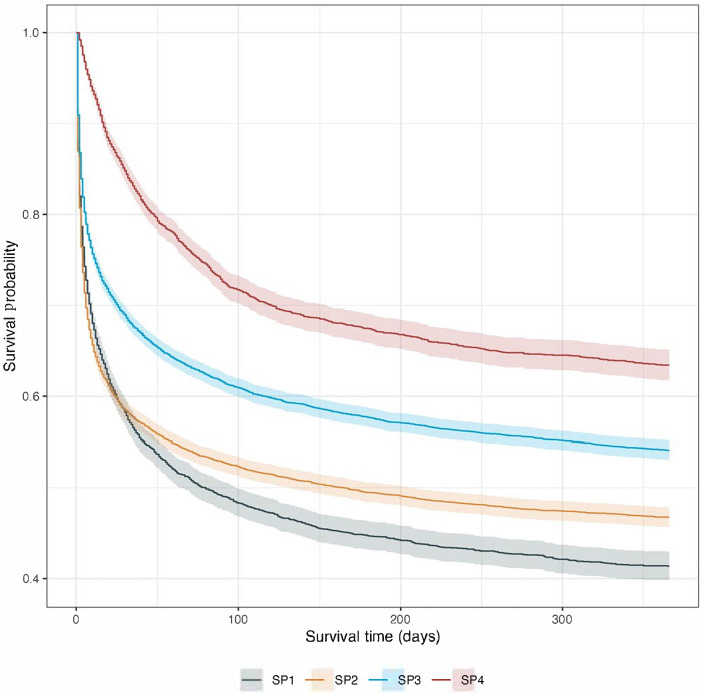
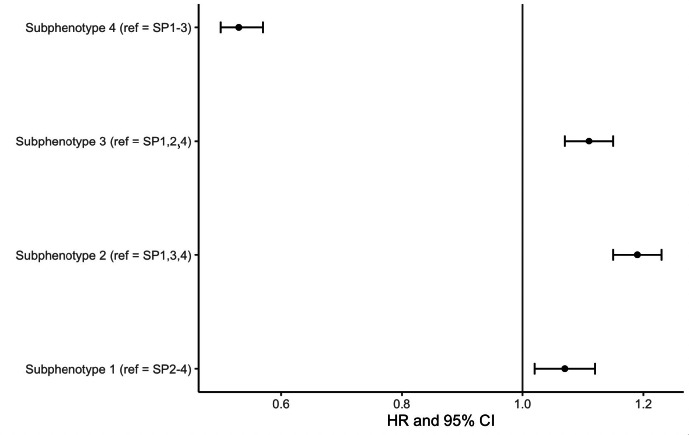
Results: We identified 27,028 unique beneficiaries who survived to discharge after OHCA. We derived 4 distinct subphenotypes. Subphenotype 1 included a distribution of more urban, female, and Black beneficiaries with the least robust area-level SDOH measures and the highest 1-year mortality (2375/4417, 53.8%). Subphenotype 2 was characterized by a greater distribution of male, White beneficiaries and had the strongest zip code-level SDOH measures, with 1-year mortality at 49.9% (4577/9165). Subphenotype 3 had the highest rates of cardiac catheterization at 34.7% (1342/3866) and the greatest distribution with a driving distance to the index OHCA hospital from their primary residence >16.1 km at 85.4% (8179/9580); more were also discharged to a skilled nursing facility after index hospitalization. Subphenotype 4 had moderate median household income at US $51,659.50 (IQR US $41,295 to $67,081) and moderate to high median unemployment at 5.5% (IQR 4.2%-7.1%), with the lowest 1-year mortality (1207/3866, 31.2%). Joint modeling of these features demonstrated an increased hazard of death for subphenotypes 1 to 3 but not for subphenotype 4 when compared to reference.

Conclusions: We identified 4 distinct subphenotypes with differences in outcomes by clinical and area-level SDOH features for OHCA. Further work is needed to determine if individual or other SDOH domains are specifically tied to long-term survival after OHCA.

Keywords: SDOH; algorithm; algorithms; association; associations; cardiac; cardiology; cluster; clustering; cohort; death; heart; k-means; machine learning; mortality; myocardial; observational; out-of-hospital-cardiac arrest; phenotype; phenotypes; retrospective; social determinants of health; subphenotype; subphenotypes; survival; survive; survivor; survivors.


Conflict of interest statement

Conflicts of Interest: None declared.

Figures

Figure 1.
Figure 1.. Chord diagrams demonstrating grouped characteristics for each of 4 out-of-hospital cardiac arrest (OHCA) subphenotypes. The diagrams demonstrate the grouped characteristics by each subphenotype. Each chord diagram includes key grouped features and their relationship with each subphenotype. The size of each chord (or arc) is representative of the proportional relationship between each feature and subphenotype. (A) Urban/nonurban and driving distance by subphenotype. (B) Beneficiary-level demographics by subphenotype. (C) Hospital characteristics and procedures by subphenotype. (D) Beneficiary disposition by location for each subphenotype. AGE1: beneficiary level—age category 65-74 years; AGE2: beneficiary level—age category 75-84 years; AGE3: beneficiary level—age category >85 years; BLACK: beneficiary level—Black race; CATH: beneficiary level—cardiac catheterization at index hospitalization; DRIVE: area level—percentage who drive alone at zip code level; ELX: beneficiary level—Elixhauser comorbidity index; FEMALE: beneficiary level—female sex; FROMSNF: beneficiary level—from skilled nursing facility prior to index OHCA; HOSPBEDS: hospital level—total number of beds; HOSPDIST1: beneficiary level—distance to travel to hospital from residence <8.0 kilometers; HOSPDIST2: beneficiary level—distance to travel to hospital from residence 8.0-16.1 kilometers; HOSPDIST3: beneficiary level—distance to travel to hospital from residence >16.1 kilometers; ICD: beneficiary level—implantable cardioverter defibrillator placement at index hospitalization; INPATIENT: beneficiary level—inpatient hospital stay at index OHCA; LGMETRO: area level—National Center for Health Statistics large metropolitan urban classification; LOS: beneficiary level—total hospital length of stay in days; MAJOR: hospital level—major academic teaching; MINOR: hospital level—minor academic teaching; NONMETRO: area level—National Center for Health Statistics nonmetro classification; OTHER: other beneficiary race/ethnicity (Centers for Medicare and Medicaid Services–defined categories Hispanic, Asian, Native Hawaiian or Pacific Islander, American Indian, or Alaska Native); SP1: subphenotype 1; SP2: subphenotype 2; SP3: subphenotype 3; SP4: subphenotype 4; TOSNF: beneficiary level—to skilled nursing facility after index OHCA; TRNSFR: beneficiary level—interhospital transfer at index hospitalization; TRSNFRTOT: beneficiary level—total number of interhospital transfers; WHITE: beneficiary level—White race.
Figure 2.
Figure 2.. Radar plots demonstrating the degree of association between normalized features and cluster membership. The radar plots represent the degree of association between normalized features and cluster membership. Each point represents a coefficient from the multinomial regression model for subtypes using normalized features (note that we do not normalize binary features), and each grid line represents −25, −4, 0, 4, and 25, respectively, where axes are scaled with squared root. As an example, a 1 unit increase in normalized household income (HHI) increases log odds of subtype 1-4 by −2.0, 1.6, −0.1, and 0.4. AGE1: beneficiary level—age category 65-74 years; AGE2: beneficiary level—age category 75-84 years; BLACK: beneficiary level—Black race ; CATH: beneficiary level—cardiac catheterization at index hospitalization; DRIVE: area level—percentage who drive alone at zip code level; ELX: beneficiary level—Elixhauser comorbidity index; FEMALE: beneficiary level—female sex; FROMSNF: beneficiary level—from skilled nursing facility prior to index OHCA; HOSPBEDS: hospital level—total number of beds; HOSPDIST1: beneficiary level—distance to travel to hospital from residence <8.0 km; HOSPDIST2: beneficiary level—distance to travel to hospital from residence 8-16 kilometers; ICD: beneficiary level—implantable cardioverter defibrillator placement at index hospitalization; INPATIENT: beneficiary level—inpatient hospital stay at index OHCA; LGMETRO: area level—National Center for Health Statistics large metropolitan urban classification; LOS: beneficiary level—total hospital length of stay in days; MAJOR: hospital level—major academic teaching; MINOR: hospital level—minor academic teaching; NONMETRO: area level—National Center for Health Statistics nonmetro classification; SP1: subphenotype 1; SP2: subphenotype 2; SP3: subphenotype 3; SP4: subphenotype 4.; TOSNF: beneficiary level—to skilled nursing facility after index OHCA; TRNSFR: beneficiary level—interhospital transfer at index hospitalization; TRSNFRTOT: beneficiary level—total number of interhospital transfers; WHITE: beneficiary level—White race.
Figure 3.
Figure 3.. Survival by Kaplan Meier estimation for 1-year mortality for each of the 4 out-of-hospital cardiac arrest subphenotypes. SP1: subphenotype 1; SP2: subphenoytype 2; SP3: subphenotype 3; SP4: subphenotype 4.
Figure 4.
Figure 4.. Forest plot of Cox proportional hazards models for each subphenotype for outcome of mortality at 1 year using a linear predictor as an offset. Models are adjusted for 21 total features, including beneficiary demographics (age, sex, race), beneficiary-level cardiac procedures (implantable cardioverter defibrillator, cardiac catheterization), hospital academic status, hospital number of beds, hospital travel distance, complete area-level social determinant of health factors, and National Center for Health Statistics urban/rural status (Table S2 in Multimedia Appendix 4). Each subphenotype model is compared to reference (ie, all other subphenotypes). HR: hazard ratio.

References

    1. 2020 annual report. Cardiac Arrest Registry to Enhance Survival Surveillance (CARES) [01-05-2022]. https://mycares.net/sitepages/uploads/2021/2020_flipbook/index.html?page=1 URL. Accessed.
    1. Girotra S, van Diepen S, Nallamothu BK, et al. Regional variation in out-of-hospital cardiac arrest survival in the United States. Circulation. 2016 May 31;133(22):2159–2168. doi: 10.1161/CIRCULATIONAHA.115.018175. doi. Medline. - DOI - PMC - PubMed
    1. Shinozaki K, Nonogi H, Nagao K, Becker LB. Strategies to improve cardiac arrest survival: a time to act. Acute Med Surg. 2016 Apr 28;3(2):61–64. doi: 10.1002/ams2.192. doi. Medline. - DOI - PMC - PubMed
    1. Tsao CW, Aday AW, Almarzooq ZI, et al. Heart disease and stroke statistics-2022 update: a report from the American Heart Association. Circulation. 2022 Feb 22;145(8):e153–e639. doi: 10.1161/CIR.0000000000001052. doi. Medline. - DOI - PubMed
    1. Healthy people 2030. US Department of Health and Human Services. [10-05-2022]. https://health.gov/healthypeople/objectives-and-data/social-determinants... URL. Accessed.

LinkOut - more resources