. 2024 Jan 11;12(1):e0233423.
doi: 10.1128/spectrum.02334-23. Epub 2023 Dec 7.

Changes in environmental and engineered conditions alter the plasma membrane lipidome of fractured shale bacteria

Affiliations

Changes in environmental and engineered conditions alter the plasma membrane lipidome of fractured shale bacteria

Chika Jude Ugwuodo et al. Microbiol Spectr. .

Abstract

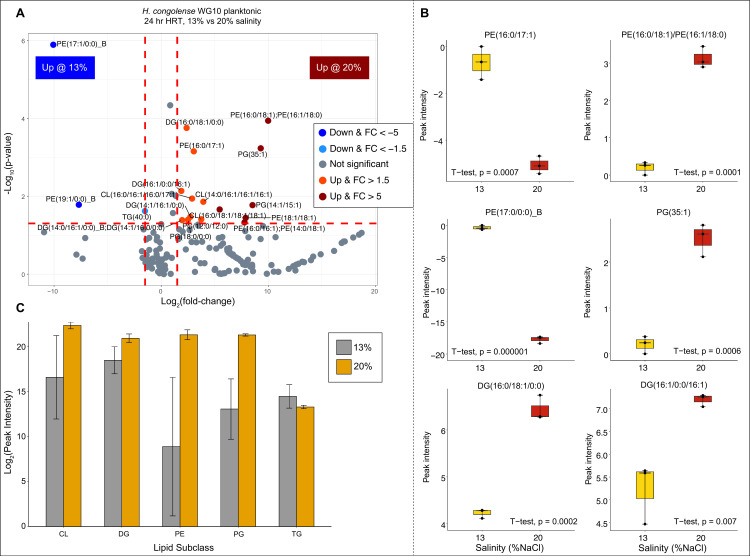
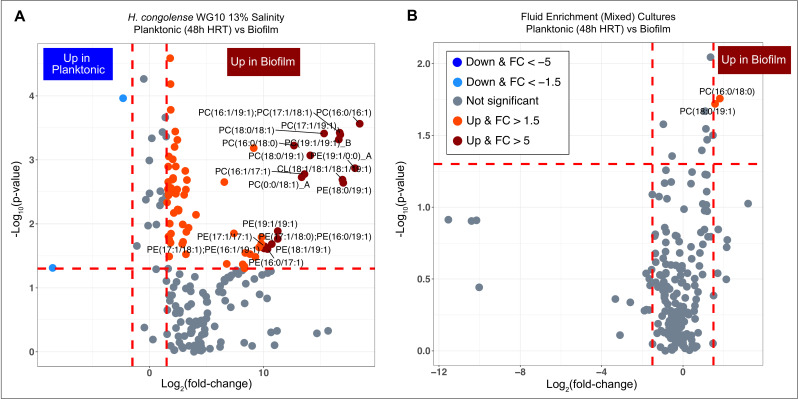
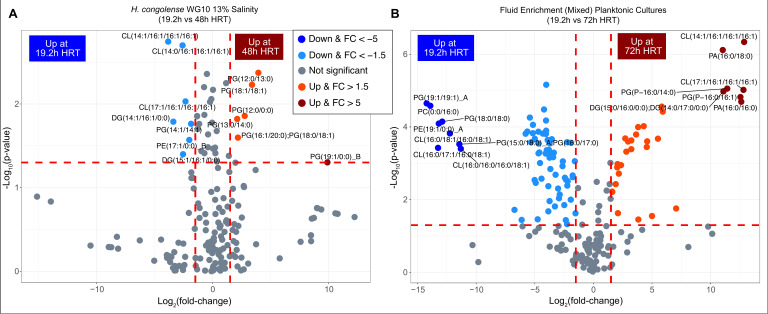
Microorganisms inadvertently introduced into the shale reservoir during fracturing face multiple stressors including brine-level salinities and starvation. However, some anaerobic halotolerant bacteria adapt and persist for long periods of time. They produce hydrogen sulfide, which sours the reservoir and corrodes engineering infrastructure. In addition, they form biofilms on rock matrices, which decrease shale permeability and clog fracture networks. These reduce well productivity and increase extraction costs. Under stress, microbes remodel their plasma membrane to optimize its roles in protection and mediating cellular processes such as signaling, transport, and energy metabolism. Hence, by observing changes in the membrane lipidome of model shale bacteria, Halanaerobium congolense WG10, and mixed consortia enriched from produced fluids under varying subsurface conditions and growth modes, we provide insight that advances our knowledge of the fractured shale biosystem. We also offer data-driven recommendations for improving biocontrol efficacy and the efficiency of energy recovery from unconventional formations.

Keywords: Halanaerobium; fractured shale; hydraulic retention time; intact polar lipids; lipidomics; membrane adaptation; salinity.


Conflict of interest statement

Fabrizio Colosimo is currently employed by New England Biolabs, Ipswich, MA, United States. Jishnu Adhikari is currently employed by Tetra Tech Inc., King of Prussia, PA, United States. The remaining authors declare no conflict of interest.

Figures

Fig 1
Fig 1
(A) Relative abundances of lipid classes detected by LC-MS/MS in negative and positive ionization modes in H. congolense WG10, produced fluid enrichment cultures, and uncultivated field (filter) consortia. (B) Representative structures of each lipid class. Data from both ionization modes were first separately normalized by total intensity. S7, S13, and S20 represent salinity gradients (% NaCl), while 19.2, 24, 48, and 72 are hydraulic retention times in hours (h). HC, Halanaerobium congolense; PEL, planktonic; BF, biofilm; PFE, produced fluid enrichment; SPH, sphingolipids; D19, December 2019; J20, July 2020; D20, December 2020; M21, May 2021.
Fig 2
Fig 2
Hierarchical clustering of H. congolense WG10 samples based on lipidomic data collected in the negative and positive ionization modes. S7, S13, and S20 represent salinity gradients (% NaCl), while 19.2, 24, and 48 are hydraulic retention times in hours (h). PEL, planktonic; BF, biofilm. The distance measure is Euclidean while clustering was done using the “Ward.D2” method in R, which implements Ward’s 1963 criterion (30).
Fig 3
Fig 3
Changes in abundance of membrane lipids in H. congolense WG10 planktonic cultures grown at 24 h HRT under 13% vs 20% NaCl. (A) Volcano plot showing the P-value and log2 fold change for each lipid. The direction of comparison is 13%–20%. The red horizontal line indicates the threshold of statistical significance, P < 0.05, while both red vertical lines delineate |FC| > 1.5. (B) Boxplots of the most significantly differential lipids (P ≤ 0.01 and |FC| > 1.5). Peak intensities were log2-transformed then median-normalized, sample-wise. (C) Lipid variation by subclass using only the differential (P ≤ 0.05 and |FC| > 1.5) species.
Fig 4
Fig 4
Changes in abundance of membrane lipids in H. congolense WG10 biofilm cultures grown under 13% vs 20% NaCl. (A) Volcano plot showing the P-value and log2 fold change for each lipid. The direction of comparison is 13%−20%. The red horizontal line indicates the threshold of statistical significance, P < 0.05, while both red vertical lines delineate |FC| > 1.5. (B) Boxplots of the most significantly differential lipids (P ≤ 0.01 and |FC| > 1.5). Peak intensities were log2-transformed then median-normalized, sample-wise. (C) Lipid variation by subclass using only the differential (P ≤ 0.05 and |FC| > 1.5) species.
Fig 5
Fig 5
Changes in abundance of membrane lipids in fractured shale microbes during biofilm growth vs planktonic. (A) Volcano plot showing the P-value and log2 fold change of lipids in H. congolense WG10 growing as biofilms (incubated for 48 h) vs planktonic (grown under 48 h HRT). Salinity was maintained at the optimum (13%) for both growth modes. (B) Volcano plot showing the P-value and FC of lipids in mixed microbial consortia in produced fluids enriched as biofilms (incubated for 48 h) vs planktonic (grown under 48 h HRT). The direction of comparison is planktonic to biofilm. The red horizontal line indicates the threshold of statistical significance, P < 0.05, while both red vertical lines delineate |FC| > 1.5.
Fig 6
Fig 6
Machine learning-based predictive modeling of H. congolense WG10 biofilm growth. (A) Random forest classification performance of the 15 most discriminant lipids ranked by mean importance measure. Red and blue denote higher abundance in biofilm and planktonic cultures, respectively. (B) Partial least squares discriminant analysis two-dimensional score plot showing a distinct separation of H. congolense WG10 culture samples into biofilms and planktons.
Fig 7
Fig 7
Comparison between the lipidomes of fractured shale microorganisms grown under low vs high hydraulic retention times. (A) Volcano plot showing the P-value and log2 fold change of lipids in H. congolense WG10 planktonic cultures grown at optimal salinity (13% NaCl) under 19.2 h (lowest) vs 48 h (highest) HRT. (B) Volcano plot showing the P-value and FC of lipids in mixed microbial consortia in shale-produced fluids enriched in planktonic modes under 19.2 h (lowest) vs 72 h (highest) HRT. The direction of comparison is 19.2 h to 48 or 72 h. The red horizontal line indicates the threshold of statistical significance, P < 0.05, while both red vertical lines delineate |FC| > 1.5.
Fig 8
Fig 8
Temporal variations in the net charge of lipids found in mixed microbial consortia from field-filtered shale-produced fluids sampled across four time points. The stacked bars are overlaid with a line graph showing corresponding volumes of produced water recovered from the well. Anionic = sum of phosphatidylglycerols and cardiolipins; zwitterionic = sum of phosphatidylcholines and phosphatidylethanolamines; neutral = sum of diacylglycerols, triacyclglycerols, and sphingolipids.

References

    1. Amundson KK, Borton MA, Daly RA, Hoyt DW, Wong A, Eder E, Moore J, Wunch K, Wrighton KC, Wilkins MJ. 2022. Correction to: microbial colonization and persistence in deep fractured shales is guided by metabolic exchanges and viral predation. Microbiome 10:30. doi:10.1186/s40168-022-01239-6 - DOI - PMC - PubMed
    1. Cluff MA, Hartsock A, MacRae JD, Carter K, Mouser PJ. 2014. Temporal changes in microbial ecology and geochemistry in produced water from hydraulically fractured marcellus shale gas wells. Environ Sci Technol 48:6508–6517. doi:10.1021/es501173p - DOI - PubMed
    1. Daly RA, Borton MA, Wilkins MJ, Hoyt DW, Kountz DJ, Wolfe RA, Welch SA, Marcus DN, Trexler RV, MacRae JD, Krzycki JA, Cole DR, Mouser PJ, Wrighton KC. 2016. Microbial metabolisms in a 2.5-km-deep ecosystem created by hydraulic fracturing in shales. Nat Microbiol 1:16146. doi:10.1038/nmicrobiol.2016.146 - DOI - PubMed
    1. Mouser PJ, Borton M, Darrah TH, Hartsock A, Wrighton KC. 2016. Hydraulic fracturing offers view of microbial life in the deep terrestrial subsurface. FEMS Microbiol Ecol 92:fiw166. doi:10.1093/femsec/fiw166 - DOI - PubMed
    1. Booker AE, Hoyt DW, Meulia T, Eder E, Nicora CD, Purvine SO, Daly RA, Moore JD, Wunch K, Pfiffner SM, Lipton MS, Mouser PJ, Wrighton KC, Wilkins MJ, Liu S-J. 2019. Deep-subsurface pressure stimulates metabolic plasticity in shale-colonizing Halanaerobium spp. Appl Environ Microbiol 85:e00018-19. doi:10.1128/AEM.00018-19 - DOI - PMC - PubMed

LinkOut - more resources