. 2024 May 2;24(3):520-536.
doi: 10.17305/bb.2023.9921.

Exosome miR-4738-3p-mediated regulation of COL1A2 through the NF-κB and inflammation signaling pathway alleviates osteoarthritis low-grade inflammation symptoms

Affiliations

Exosome miR-4738-3p-mediated regulation of COL1A2 through the NF-κB and inflammation signaling pathway alleviates osteoarthritis low-grade inflammation symptoms

Jun Xu et al. Biomol Biomed. .

Abstract

This study aimed to elucidate the roles of microRNA (miR)-4738-3p and the collagen type I alpha 2 chain (COL1A2) gene in the pathogenesis of osteoarthritis (OA) through bioinformatics analysis and cellular assays. The GSE55235 dataset was analyzed using the weighted gene co-expression network analysis (WGCNA) method to identify gene modules associated with OA. Key overlapping genes were identified from these modules and the GSE55235-differential expressed genes (DEGs). The expression levels of selected genes were determined in C28/I2 cells using the quantitative real-time polymerase chain reaction (qRT-PCR). The interaction between miR-4738-3p and COL1A2 was examined in the context of interleukin 1 beta (IL-1β) induction. Exosome characterization was achieved through transmission electron microscopy (TEM), western blotting (WB), and other analyses. The study also investigated the functional relevance of miR-4738-3p in OA pathology through various molecular and cellular assays. Our findings revealed that the green module exhibited a strong correlation with the OA phenotype in the GSE55235 dataset, with COL1A2 emerging as a hub gene and miR-4738-3p as its key downstream target. IL-1β induction suggested that COL1A2 is involved in inflammation and apoptosis, while miR-4738-3p appeared to play an antagonistic role. The analysis of exosomes underscored the significance of miR-4738-3p in cellular communication, with an enhanced level of exo-miR-4738-3p antagonizing IL-1β-induced inflammation and promoting cell survival. Conversely, a reduction in exo-miR-4738-3p led to increased cell damage. This study established a clear regulatory relationship between miR-4738-3p and COL1A2, with the nuclear factor kappa B (NF-κB) signaling pathway playing a central role in this regulation. The miR-4738-3p significantly influences the OA-associated inflammation, primarily through modulation of COL1A2 and the NF-κB pathway. Therefore, targeting miR-4738-3p offers a potential therapeutic approach for OA, with exosome miR-4738-3p presenting a promising strategy.


Conflict of interest statement

Conflicts of interest: Authors declare no conflicts of interest.

Figures

Figure 1.
Figure 1.
Evaluation of IL-1β-induced changes in miR-4738-3p, COL1A2 expression, and associated cellular responses in C28/I2 chondrocytes. (A) Graph showing the relative IL-1β levels in C28/I2 chondrocytes after induction, confirming the establishment of the in vitro OA model. (B and C) qRT-PCR analysis depicting changes in the expression levels of miR-4738-3p (B) and COL1A2 (C) in C28/I2 cells following IL-1β treatment. (D and E) qRT-PCR results showing dose-dependent effects of different concentrations of IL-1β on the expression of miR-4738-3p (D) and COL1A2 (E), highlighting the significant changes at 10 ng/mL. (F and G) qRT-PCR (F) and WB (G) analyses depicting the differential expression patterns of chondrogenic markers induced by different IL-1β concentrations, including COX2, INOS, MMP13, and collagen 2. The accompanying bar graph on the right (G) displays protein expression quantification through gray-scale analysis. (H) WB analysis illustrating changes in protein levels of COLIA2, TLR4, p-NF-κB, and NF-κB at different doses of IL-1β. The accompanying bar graph on the right displays protein expression quantification through gray-scale analysis. (I) Flow cytometry results assessing the changes in apoptosis rate of C28/I2 chondrocytes after treatment with different IL-1β concentrations. (J and K) qRT-PCR (J) and WB (K) analyses demonstrating the differential expression trends of c-Caspase3 and Bcl-2 with increasing doses of IL-1β. The accompanying bar graph on the right (K) displays protein expression quantification through gray-scale analysis. *P < 0.05; **P < 0.01; indicating levels of statistical significance. IL-1β: Interleukin 1 beta; miR: MicroRNA; COL1A2: Collagen type I alpha 2 chain; OA: Osteoarthritis; qRT-PCR: Quantitative real-time polymerase chain reaction; WB: Western blot; COX2: Cyclooxigenase 2; INOS: Inducible nitric oxide synthase; MMP13: Matrix metallopeptidase 13; TLR4: Toll-like receptor 4; p-NF-κB: Phosphorylated nuclear factor kappa B; c-Caspase3: Cleaved-Caspase3; Bcl-2: B-cell lymphoma 2 protein; mRNA: Messenger RNA; PI: Propidium iodide; FITC: Fluorescein isothiocyanate.
Figure 2.
Figure 2.
Isolation of HS-MSC-exosomes and analysis of COL1A2 and miR-4738-3p transfection efficiency. (A) Transmission electron micrographs displaying the characteristic morphology of exosomes isolated from HS-MSC using ultracentrifugation. The scale bar indicates a length of 200 nm. (B) WB analysis detecting the protein levels of exosome markers (CD9, CD81, and HSP70) in both HS-MSCs and isolated exosomes. The accompanying bar graph on the right displays protein expression quantification through gray-scale analysis. (C and D) qRT-PCR analysis results revealing the expression trends of miR-4738-3p (C) and COL1A2 (D) in IL-1β-induced C28/I2 chondrocytes. (E and F) Comparative qRT-PCR analysis results displaying the miR-4738-3p expression in HS-MSCs (E) and its derived exosomes (F). *P < 0.05; indicating the level of statistical significance. HS-MSC: Human synovial mesenchymal stem cells; COL1A2: Collagen type I alpha 2 chain; miR: MicroRNA; WB: Western blot; CD: Cluster of differentiation; HSP70: Heat shock protein 70; qRT-PCR: Quantitative real-time polymerase chain reaction; IL-1β: Interleukin 1 beta; NC: Negative control; mRNA: Messenger RNA; siRNA: Small interfering RNA; pcDNA: Empty vector control; OE: Overexpression vectors.
Figure 3.
Figure 3.
Exo-miR-4738-3p alters the gene expression profile and inhibits apoptosis in OA chondrocytes. (A and B) qRT-PCR analysis results displaying changes in the expression of miR-4738-3p (A) and COL1A2 (B) in exosomes derived from C28/I2 chondrocytes following treatment with 10 ng/mL IL-1β. (C and D) qRT-PCR (C) and WB (D) assays measuring the expression levels of COX2, INOS, MMP13, and collagen 2 in the blank, exo-miR-NC, and exo-miR-4738-3p groups, following treatment with 10 ng/mL of IL-1β. The accompanying bar graph on the right (D) displays protein expression quantification through gray-scale analysis. (E) WB analysis demonstrating the protein levels of COL1A2, TLR4, p-NF-κB, and NF-κB in exosome-treated cells enriched with miR-4738-3p, following 10 ng/mL of IL-1β treatment. The accompanying bar graph on the right displays protein expression quantification through gray-scale analysis. (F) Flow cytometry presenting changes in cell apoptosis rates in the blank, exo-miR-NC, and exo-miR-4738-3p groups treated with 10 ng/mL of IL-1β. (G and H) Comparative qRT-PCR (G) and WB (H) analysis displaying the relative expression levels of c-Caspase3 and Bcl-2 in the blank, exo-miR-NC, and exo-miR-4738-3p groups, all based on 10 ng/mL of IL-1β treatment. The accompanying bar graph on the right (H) displays protein expression quantification through gray-scale analysis. *P < 0.05 vs the blank group; #P < 0.05 vs exo-miR-NC; indicating levels of statistical significance. Exo: Exosome; miR: MicroRNA: OA: Osteoarthritis; qRT-PCR: Quantitative real-time polymerase chain reaction; COL1A2: Collagen type I alpha 2 chain; IL-1β: Interleukin 1 beta; WB: Western blot; COX2: Cyclooxigenase 2; INOS: Inducible nitric oxide synthase; MMP13: Matrix metallopeptidase 13; NC: Negative control; TLR4: Toll-like receptor 4; p-NF-κB: Phosphorylated nuclear factor kappa B; c-Caspase3: Cleaved-Caspase3; Bcl-2: B-cell lymphoma 2 protein; mRNA: Messenger RNA; PI: Propidium iodide; FITC: Fluorescein isothiocyanate.
Figure 4.
Figure 4.
Knockdown of exo-miR-4738-3p exacerbates IL-1β-induced C28/I2 chondrocyte injury. (A and B) qRT-PCR verifying the knockdown efficiency of miR-4738-3p (A) and illustrating the corresponding changes in COL1A2 expression (B) in exosomes derived from C28/I2 chondrocyte treated with 10 ng/mL of IL-1β. (C and D) qRT-PCR (C) and WB (D) assays measuring the expression levels of COX2, INOS, MMP13, and collagen 2 in the blank, exo-NC-inhibitor, and exo-miR-4738-3p inhibitor groups following treatment with 10 ng/mL of IL-1β. The accompanying bar graph on the right (D) displays protein expression quantification through gray-scale analysis. (E) WB analysis demonstrating the protein levels of COL1A2, TLR4, p-NF-κB, and NF-κB in exosome-treated cells enriched with the miR-4738-3p inhibitor, following 10 ng/mL of IL-1β treatment. The accompanying bar graph on the right displays protein expression quantification through gray-scale analysis. (F) Flow cytometry presenting changes in cell apoptosis rates in blank, exo-NC-inhibitor, and exo-miR-4738-3p inhibitor groups treated with 10 ng/mL of IL-1β. (G and H) Comparative qRT-PCR (G) and WB (H) analysis displaying the relative expression levels of c-Caspase3 and Bcl-2 in the blank, exo-miR-NC, and exo-miR-4738-3p groups, all based on 10 ng/mL of IL-1β treatment. The accompanying bar graph on the right (H) displays protein expression quantification through gray-scale analysis. *P < 0.05 vs the blank group; **P < 0.01 vs the blank group; #P < 0.05 vs exo-miR-NC; indicating levels of statistical significance. Exo: Exosome; miR: MicroRNA; IL-1β: Interleukin 1 beta; qRT-PCR: Quantitative real-time polymerase chain reaction; COL1A2: Collagen type I alpha 2 chain; WB: Western blot; COX2: Cyclooxigenase 2; INOS: Inducible nitric oxide synthase; MMP13: Matrix metallopeptidase 13; NC: Negative control; TLR4: Toll-like receptor 4; p-NF-κB: Phosphorylated nuclear factor kappa B; c-Caspase3: Cleaved-Caspase3; Bcl-2: B-cell lymphoma 2 protein; mRNA: Messenger RNA; PI: Propidium iodide; FITC: Fluorescein isothiocyanate.
Figure 5.
Figure 5.
miR-4738-3p regulates the NF-κB signaling pathway by targeting COL1A2. (A) Schematic representation from the ENCORI database, depicting the potential binding sites between miR-4738-3p and the 3′-UTR of COL1A2. (B) Dual-luciferase reporter assay results confirming the direct interaction between miR-4738-3p and the 3′-UTR of COL1A2. *P < 0.05; indicating levels of statistical significance. (C) WB analyses depicting the effect of various treatments (control, Il-1β, miR-4738-3p mimics, miR-4738-3p inhibitor, BAY-11-7082, miR-4738-3p inhibitor + BAY 11-7082) on the expression levels of COL1A2 and p-NF-κB, highlighting the regulatory role of miR-4738-3p in the NF-κB signaling pathway. *P < 0.05 indicating a significant difference compared to the control group. #P < 0.05 indicating a significant difference between miR-4738-3p-inhibitor + BAY 11-7082 group and the miR-4738-3p-inibitor group or BAY 11-7082 group. The accompanying bar graph on the right displays protein expression quantification through gray-scale analysis. miR: MicroRNA; NF-κB: Nuclear factor kappa B; COL1A2: Collagen type I alpha 2 chain; ENCORI: Encyclopedia of RNA Interactomes; 3′-UTR: 3′-untranslated region; WB: Western blot; IL-1β: Interleukin 1 beta; p-NF-κB: Phosphorylated nuclear factor kappa B; hsa: Homo sapiens; MUT: Mutation; NC: Negative control.
Figure S1.
Figure S1.
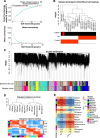
WGCNA analysis of the GSE55235 dataset. (A) Determination of the optimal soft-thresholding power with the panel depicting the scale-free topology fit index plotted against various soft-thresholding powers. The optimal soft-thresholding power selected for the analysis is highlighted with a vertical red line. (B) Sample dendrogram based on topological overlap, alongside a trait heatmap, illustrating the clustering patterns of the samples and highlighting potential outliers within the dataset. (C) Cluster dendrogram derived from the topological overlap matrix illustrating the hierarchical organization of genes and the formation of different modules. (D) Eigengene adjacency heatmap illustrating the relationships between different gene modules. The color gradient in the heatmap corresponds to the varying levels of adjacency between modules, with color intensity indicating the strength of these relationships. (E) Trait heatmap demonstrating the correlations between the identified gene modules and the specific traits of interest in GSE55235 samples, with corresponding correlation values and P values. WGCNA: Weighted gene co-expression network analysis; OA: Osteoarthritis; ME: Module eigengene.
Figure S2.
Figure S2.
Identification and network analysis of overlapping genes in the green module and GSE55235-DEGs. (A) Volcano plot detailing the upregulated (red) and downregulated (blue) DEGs identified from the GSE55235 dataset, with horizontal and vertical lines indicating threshold values for significance and fold change. (B) Venn diagram highlighting the overlap of genes between the green module and GSE55235-DEGs. The overlapping region illustrates the common genes shared by both sets. (C–E) Representations of the PPI networks based on the MOCDE (C), MCC (D), and DMNC (E) algorithms, respectively, with each node in the networks representing a gene, and the edges indicating interactions between these genes. (F) Venn diagram of five key overlapping genes identified within the three sub-networks analyzed by the MOCDE, MCC, and DMNC algorithms. (G) Expression levels of five key overlapping genes (COL3A1, COL1A1, COL1A2, COL5A1, and COL5A2) in OA and control groups. The y-axis represents the expression values, with the OA group presented with pink color and the control group presented with blue color. ***P < 0.001; ****P < 0.0001. DEGs: Differentially expressed genes; PPI: Protein–protein interaction; MOCDE: Molecular Complex Detection; MCC: Maximal Clique Centrality; DMNC: Dense Module based on Node Connectivity; LAMA4: Laminin subunit alpha 4; COL5A2: Collagen type V alpha 2 chain; COL5A1: Collagen type V alpha 1 chain; COL3A1: Collagen type III alpha 1 chain; COL1A2: Collagen type I alpha 2 chain; COL1A: Collagen type I alpha 1 chain; COX2: Cyclooxygenase 2; BGN: Biglycan; TIMP1: Tissue inhibitor of metalloproteinases 1; THY1: Thy-1 membrane glycoprotein; SULF1: Sulfatase 1; MXRA5: Matrix-remodeling associated 5; MMP9: Matrix metallopeptidase 9; LOXL1: Lysyl oxidase-like 1; CDH11: Cadherin 11; FAP: Fibroblast activation protein.
Figure S3.
Figure S3.
Expression and correlation analysis of COL1A2 and miR-4738-3p. (A) Bar graph from the qRT-PCR analysis depicting the relative expression levels of five key overlapping genes in C28/I2 cells. The y-axis indicates their relative expression levels. (B) Venn diagram showing the intersection of targets identified from the TargetScan databases, miRDB databases, and the GSE55235-DE miRNAs. (C) Boxplot comparing the expression levels of miR-4738-3p in GSE55235-OA samples versus the control samples. ***P < 0.001; indicating a statistically significant difference in expression. (D) Correlation scatter plot, generated using the GEPIA database, showing a significant negative correlation between the expression of miR-4738-3p and COL1A2. The P value and correlation coefficient are shown in the upper left corner of the plot. COL1A2: Collagen type I alpha 2 chain; miR: MicroRNA; qRT-PCR: Quantitative real-time polymerase chain reaction; miRDB: MicroRNA Target Prediction Database; DE: Differentially expressed; miRNAs: MicroRNAs; OA: Osteoarthritis; GEPIA: Gene Expression Profiling Interactive Analysis; mRNA: Messenger RNA; COL1A1: Collagen type I alpha 1 chain; COL3A1: Collagen type III alpha 1 chain; COL5A1: Collagen type V alpha 1 chain; COL5A2: Collagen type V alpha 2 chain.

References

    1. Yao Q, Wu X, Tao C, Gong W, Chen M, Qu M, et al. Osteoarthritis: pathogenic signaling pathways and therapeutic targets. Signal Transduct Target Ther. 2023;8(1):56. https://doi.org/10.1038/s41392-023-01330-w. - PMC - PubMed
    1. Bhatia D, Bejarano T, Novo M. Current interventions in the management of knee osteoarthritis. J Pharm Bioallied Sci. 2013;5(1):30. https://doi.org/10.4103/0975-7406.106561. - PMC - PubMed
    1. Steinmetz JD, Culbreth GT, Haile LM, Rafferty Q, Lo J, Fukutaki KG, et al. Global, regional, and national burden of osteoarthritis, 1990–2020 and projections to 2050: a systematic analysis for the Global Burden of Disease Study 2021. Lancet Rheumatol. 2023;5(9):e508–e22. https://doi.org/10.1016/S2665-9913(23)00163-7. - PMC - PubMed
    1. Hawker GA. Osteoarthritis is a serious disease. Clin Exp Rheumatol. 2019;37 Suppl 120(5):3–6. PMID: 31621562. - PubMed
    1. Dima R, Francio VT, Towery C, Davani S. Review of literature on low-level laser therapy benefits for nonpharmacological pain control in chronic pain and osteoarthritis. Trials. 2017;5:6. PMID: 28987080. - PubMed

Publication types