Meta-Analysis
. 2023 Dec;131(12):127008.
doi: 10.1289/EHP12854. Epub 2023 Dec 7.

A Nationwide Comparative Analysis of Temperature-Related Mortality and Morbidity in Japan

Affiliations
Meta-Analysis

A Nationwide Comparative Analysis of Temperature-Related Mortality and Morbidity in Japan

Lei Yuan et al. Environ Health Perspect. 2023 Dec.

Abstract

Background: The impact of temperature on morbidity remains largely unknown. Moreover, extensive evidence indicates contrasting patterns between temperature-mortality and temperature-morbidity associations. A nationwide comparison of the impact of temperature on mortality and morbidity in more specific subgroups is necessary to strengthen understanding and help explore underlying mechanisms by identifying susceptible populations.

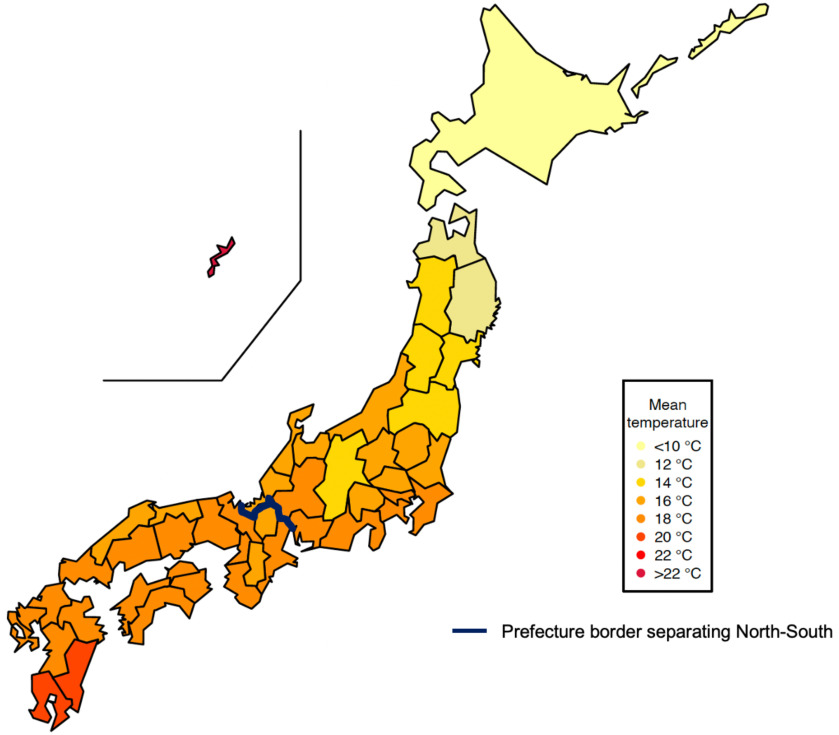
Objective: We performed this study to quantify and compare the impact of temperature on mortality and morbidity in 47 prefectures in Japan.

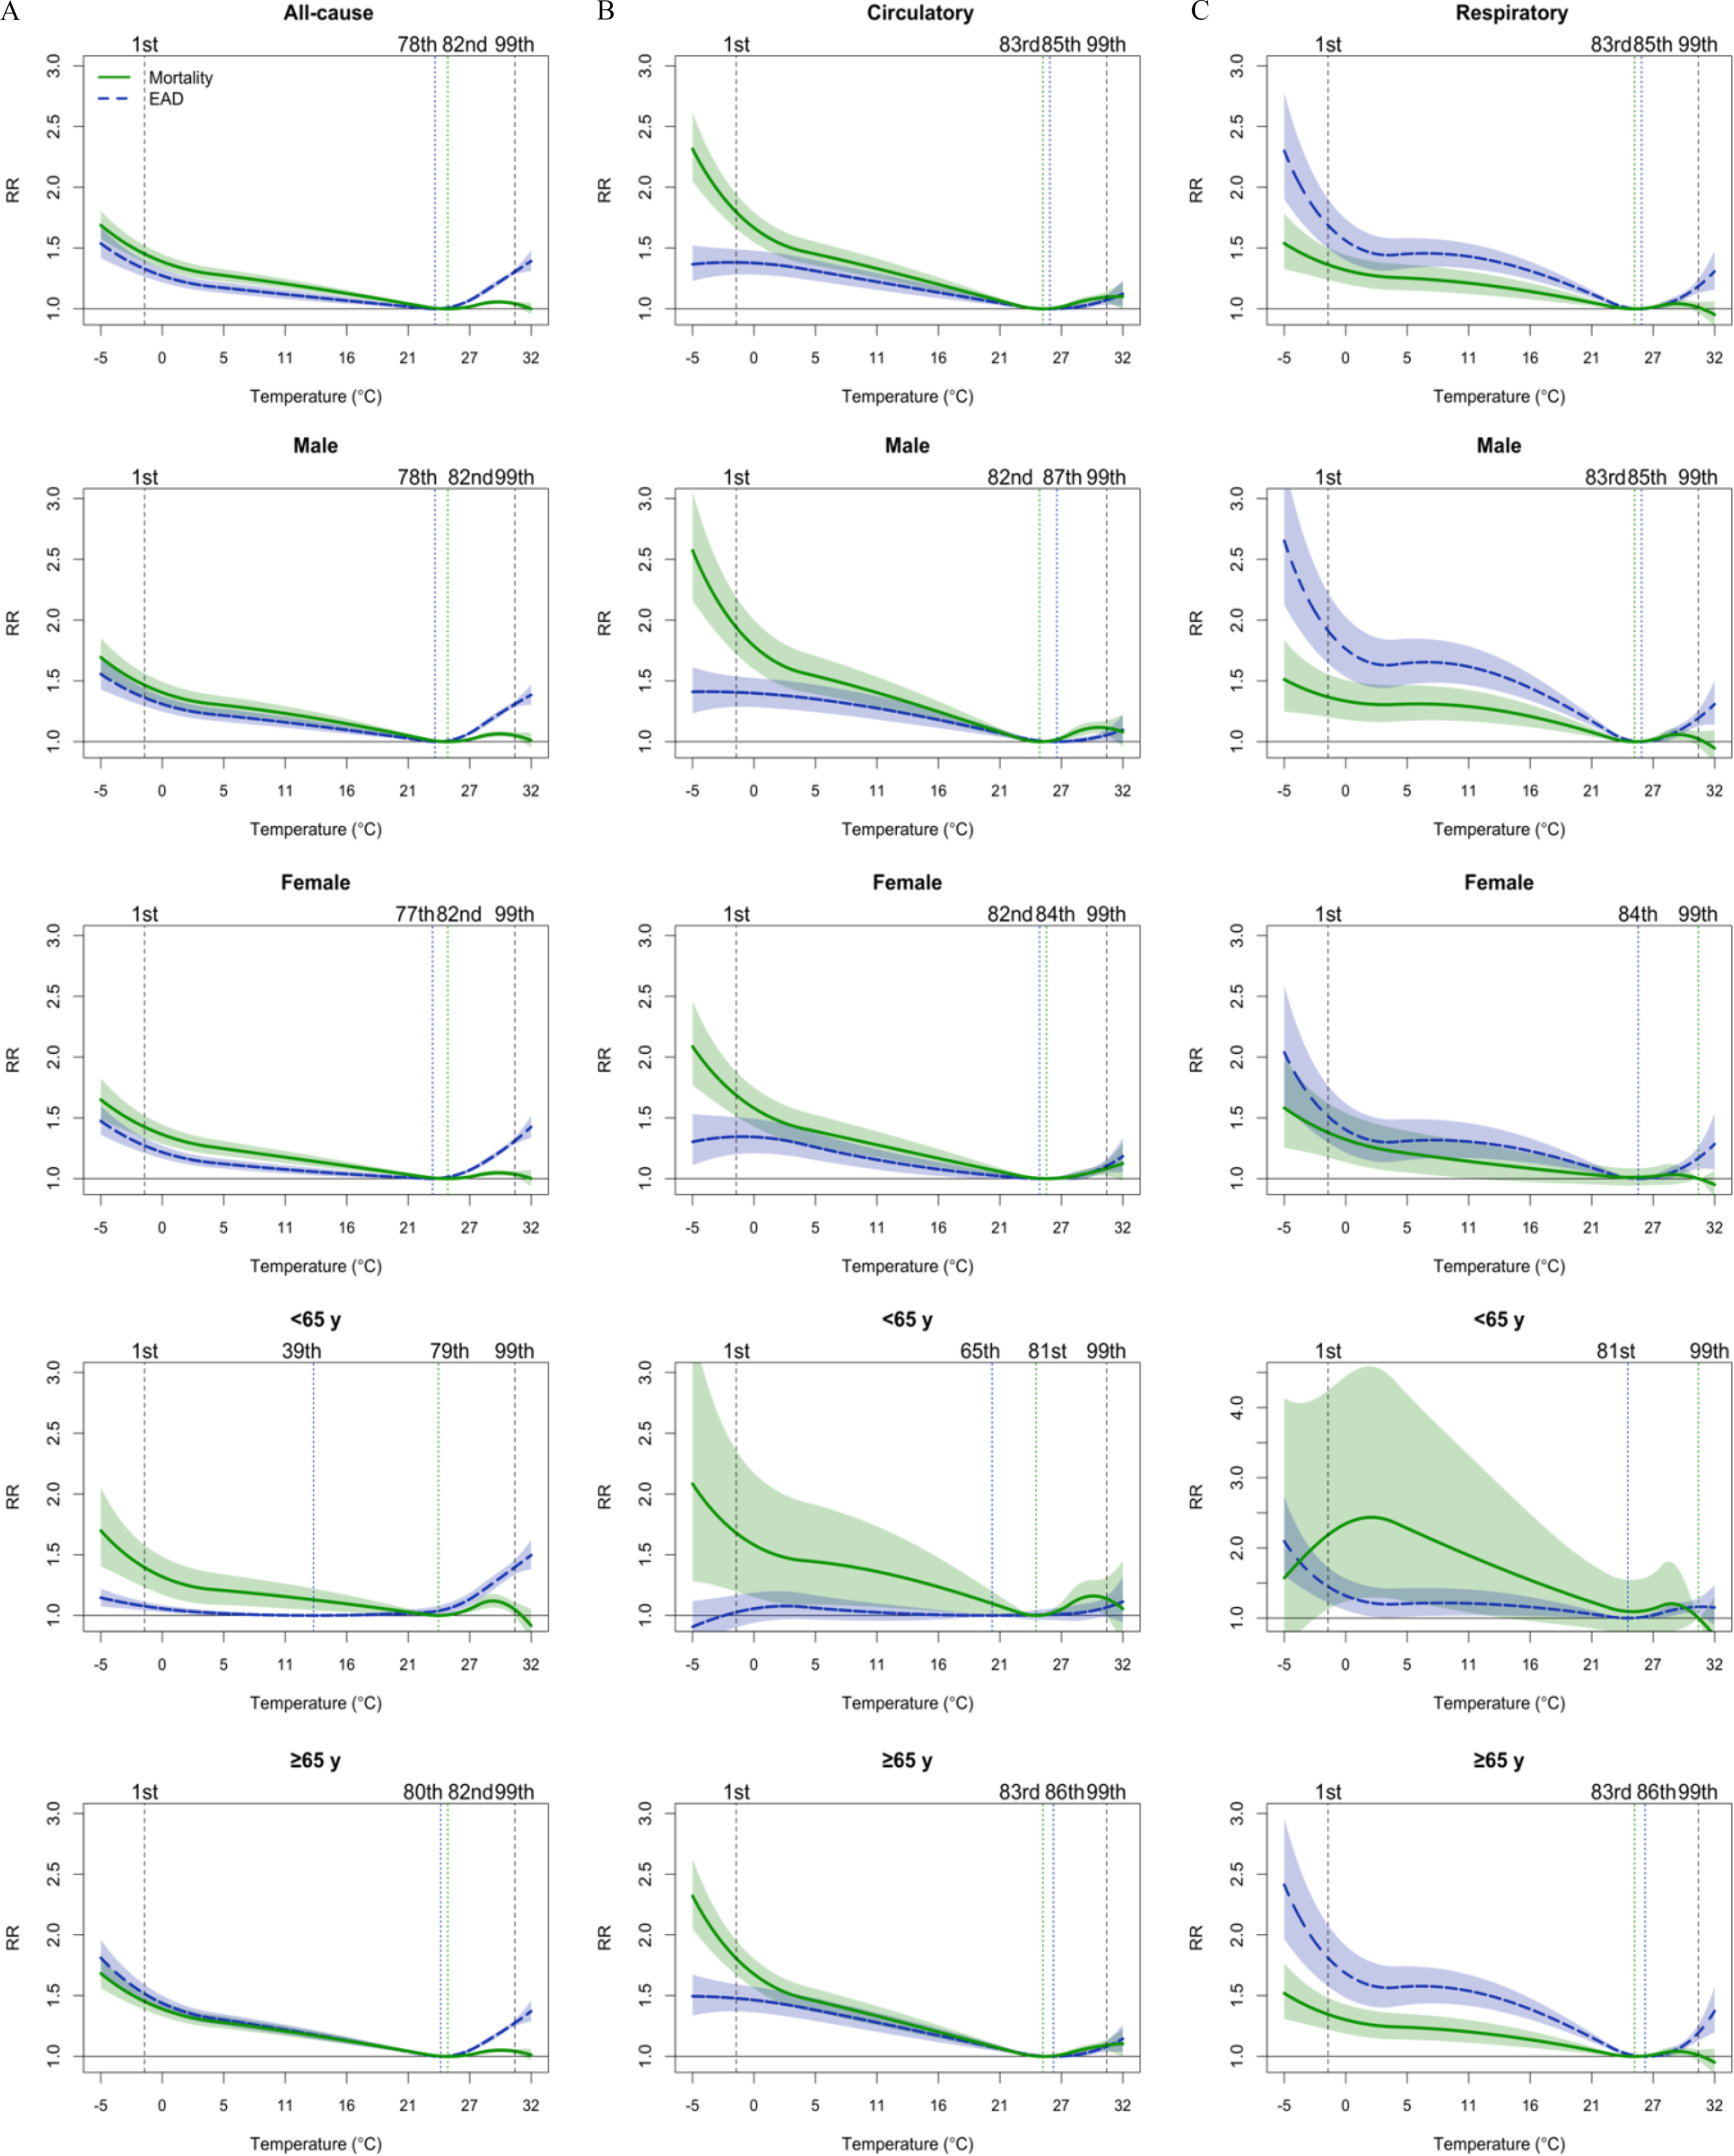
Methods: We applied a two-stage time-series design with distributed lag nonlinear models and mixed-effect multivariate meta-analysis to assess the association of temperature with mortality and morbidity by causes (all-cause, circulatory, and respiratory) at prefecture and country levels between 2015 and 2019. Subgroup analysis was conducted by sex, age, and regions.

Results: The patterns and magnitudes of temperature impacts on morbidity and mortality differed. For all-cause outcomes, cold exhibited larger effects on mortality, and heat showed larger effects on morbidity. At specific temperature percentiles, cold (first percentile) was associated with a higher relative risk (RR) of mortality [1.45; 95% confidence interval (CI): 1.39, 1.52] than morbidity (1.33; 95% CI: 1.26, 1.40), as compared to the minimum mortality/morbidity temperature. Heat (99th percentile) was associated with a higher risk of morbidity (1.30; 95% CI: 1.28, 1.33) than mortality (1.04; 95% CI: 1.02, 1.06). For cause-specific diseases, mortality due to circulatory diseases was more susceptible to heat and cold than morbidity. However, for respiratory diseases, both cold and heat showed higher risks for morbidity than mortality. Subgroup analyses suggested varied associations depending on specific outcomes.

Discussion: Distinct patterns were observed for the association of temperature with mortality and morbidity, underlying different mechanisms of temperature on different end points, and the differences in population susceptibility are possible explanations. Future mitigation policies and preventive measures against nonoptimal temperatures should be specific to disease outcomes and targeted at susceptible populations. https://doi.org/10.1289/EHP12854.


Figures

Figure 1 is a map of Japan depicting the mean temperature in 47 prefectures between 2015 and 2019. The line in the map implies a prefecture border separating North and South. The mean temperature ranges as less than 10 degrees Celsius, 12 degrees Celsius, 14 degrees Celsius, 16 degrees Celsius, 18 degrees Celsius, 20 degrees Celsius, 22 degrees Celsius, and greater than 22 degrees Celsius.
Figure 1.
Spatial map of mean temperature in 47 prefectures between 2015 and 2019 in Japan. See Table S3 for the corresponding numeric data.
Figure 2A has five ribbon plus line graphs titled All-cause, Male, Female, less than 65 years, and greater than or equal to 65 years, plotting relative risk, ranging from 1.0 to 3.0 in increments of 0.5 (y-axis) across temperature (degree Celsius), ranging from negative 5 to 5 in increments of 5, 5 to 11 in increments of 6, 11 to 21 in increments of 5, 21 to 27 in increments of 6, and 27 to 32 in increments of 5 (x-axis) for mortality and emergency ambulance dispatches, respectively. Figure 2B has five ribbon plus line graphs titled Circulatory, Male, Female, less than 65 years, and greater than or equal to 65 years, plotting relative risk, ranging from 1.0 to 3.0 in increments of 0.5 (y-axis) across temperature (degree Celsius), ranging from negative 5 to 5 in increments of 5, 5 to 11 in increments of 6, 11 to 21 in increments of 5, 21 to 27 in increments of 6, and 27 to 32 in increments of 5 (x-axis) for mortality and emergency ambulance dispatches, respectively. Figure 2C has five ribbon plus line graphs titled Respiratory, Male, Female, less than 65 years, and greater than or equal to 65 years, plotting relative risk, ranging from 1.0 to 3.0 in increments of 0.5 (y-axis) across temperature (degree Celsius), ranging from negative 5 to 5 in increments of 5, 5 to 11 in increments of 6, 11 to 21 in increments of 5, 21 to 27 in increments of 6, and 27 to 32 in increments of 5 (x-axis) for mortality and emergency ambulance dispatches, respectively.
Figure 2.
Cold and heat effects on all-cause and cause-specific mortality and EAD for the general population and different sex and age subgroups between 2015 and 2019 in Japan. The vertical lines represent the percentile of minimum mortality/morbidity temperature (dotted) and the 1st and 99th percentiles of the temperature distribution (dashed). See Table 2 for the corresponding numeric data for overall population and Table S7 for subgroup estimates. Note: EAD, emergency ambulance dispatches; RR, relative risk.
Figure 3A is a set of six maps of Japan. On the top-left, the map depicts the cold-related relative risk of all-cause mortality. At the center, the map depicts the cold-related relative risk of circulatory mortality. On the top-right, the map depicts the cold-related relative risk of respiratory mortality. At the bottom-left, the map depicts the cold-related relative risk of all-cause emergency ambulance dispatches. At the center, the map depicts the cold-related relative risk of circulatory emergency ambulance dispatches. At the bottom-right, the map depicts the cold-related relative risk of respiratory emergency ambulance dispatches. The spatial variations range is divided into five parts: 1.81 to 2.54, 1.65 to 1.81, 1.42 to 1.65, 1.25 to 1.42, and 1.00 to 1.25. Figure 3B is a set of six maps of Japan. On the top-left, the map depicts the heat-related relative risk of all-cause mortality. At the center, the map depicts the heat-related relative risk of circulatory mortality. On the top-right, the map depicts the heat-related relative risk of respiratory mortality. At the bottom-left, the map depicts the heat-related relative risk of all-cause emergency ambulance dispatches. At the center, the map depicts the heat-related relative risk of circulatory emergency ambulance dispatches. At the bottom-right, the map depicts the heat-related relative risk of respiratory emergency ambulance dispatches. The spatial variations range is divided into five parts: 1.48 to 1.78, 1.26 to 1.48, 1.14 to 1.26, 1.05 to 1.14, and 1.00 to 1.05.
Figure 3.
Spatial variations in the cold- and heat-related RRs of all-cause and cause-specific mortality and EAD between 2015 and 2019 in Japan. RR is defined as the risk increment at cold and heat (the 1st and 99th percentiles of the temperature distribution) relative to MMTP. See Table S4–S6 for the corresponding prefecture-specific numeric data. Note: EAD, emergency ambulance dispatch; MMTP, minimum mortality/morbidity temperature percentile; RR, relative risk.
Figure 4 is a set of two error bar graphs titled cold risks for different subgroups and heat risks for different subgroups, plotting relative risk, ranging from 1.0 to 2.5 in increments of 0.5 and 1.0 to 1.6 in increments of 0.2 (y-axis) across all male, female, less than 65 years, greater than or equal to 65 years, North, and South (x-axis) for all-cause mortality, circulatory mortality, respiratory mortality, all cause emergency ambulance dispatches, circulatory emergency ambulance dispatches, and respiratory emergency ambulance dispatches, respectively.
Figure 4.
Pooled RRs with 95% CIs (vertical bars) of heat and cold on all-cause and cause-specific mortality and EAD in subgroup analyses by sex, age, and region groups. RR is defined as the risk increment at cold and heat (the 1st and 99th percentiles of the temperature distribution) relative to MMTP. See Table S7 for the corresponding numeric data and test for the difference. Note: CI, confidence interval; EAD, emergency ambulance dispatch; MMTP, minimum mortality/morbidity temperature percentile; RR, relative risk.

References

    1. Murray CJL, Aravkin AY, Zheng P, Abbafati C, Abbas KM, Abbasi-Kangevari M, et al. . 2020. Global burden of 87 risk factors in 204 countries and territories, 1990–2019: a systematic analysis for the global burden of disease study 2019. Lancet 396(10258):1223–1249, PMID: , 10.1016/S0140-6736(20)30752-2. - DOI - PMC - PubMed
    1. Bunker A, Wildenhain J, Vandenbergh A, Henschke N, Rocklöv J, Hajat S, et al. . 2016. Effects of air temperature on climate-sensitive mortality and morbidity outcomes in the elderly; a systematic review and meta-analysis of epidemiological evidence. EBioMedicine 6:258–268, PMID: , 10.1016/j.ebiom.2016.02.034. - DOI - PMC - PubMed
    1. Song X, Wang S, Hu Y, Yue M, Zhang T, Liu Y, et al. . 2017. Impact of ambient temperature on morbidity and mortality: an overview of reviews. Sci Total Environ 586:241–254, PMID: , 10.1016/j.scitotenv.2017.01.212. - DOI - PubMed
    1. Basu R, Samet JM. 2002. Relation between elevated ambient temperature and mortality: a review of the epidemiologic evidence. Epidemiol Rev 24(2):190–202, PMID: , 10.1093/epirev/mxf007. - DOI - PubMed
    1. Son JY, Liu JC, Bell ML. 2019. Temperature-related mortality: a systematic review and investigation of effect modifiers. Environ Res Lett 14(7):073004, 10.1088/1748-9326/ab1cdb. - DOI

Publication types