. 2024 Feb 1;134(3):e172256.
doi: 10.1172/JCI172256.

Multiomic profiling reveals metabolic alterations mediating aberrant platelet activity and inflammation in myeloproliferative neoplasms

Affiliations

Multiomic profiling reveals metabolic alterations mediating aberrant platelet activity and inflammation in myeloproliferative neoplasms

Fan He et al. J Clin Invest. .

Abstract

Platelets from patients with myeloproliferative neoplasms (MPNs) exhibit a hyperreactive phenotype. Here, we found elevated P-selectin exposure and platelet-leukocyte aggregates indicating activation of platelets from essential thrombocythemia (ET) patients. Single-cell RNA-seq analysis of primary samples revealed significant enrichment of transcripts related to platelet activation, mTOR, and oxidative phosphorylation in ET patient platelets. These observations were validated via proteomic profiling. Platelet metabolomics revealed distinct metabolic phenotypes consisting of elevated ATP generation accompanied by increases in the levels of multiple intermediates of the tricarboxylic acid cycle, but lower α-ketoglutarate (α-KG) in MPN patients. Inhibition of PI3K/AKT/mTOR signaling significantly reduced metabolic responses and hyperreactivity in MPN patient platelets, while α-KG supplementation markedly reduced oxygen consumption and ATP generation. Ex vivo incubation of platelets from both MPN patients and Jak2 V617F-knockin mice with α-KG supplementation significantly reduced platelet activation responses. Oral α-KG supplementation of Jak2 V617F mice decreased splenomegaly and reduced hematocrit, monocyte, and platelet counts. Finally, α-KG treatment significantly decreased proinflammatory cytokine secretion from MPN CD14+ monocytes. Our results reveal a previously unrecognized metabolic disorder in conjunction with aberrant PI3K/AKT/mTOR signaling that contributes to platelet hyperreactivity in MPN patients.

Keywords: Hematology; Platelets.


Conflict of interest statement

Conflict of interest: STO has served as a consultant for Kartos Therapeutics, CTI BioPharma, Celgene/Bristol Myers Squibb, Disc Medicine, Blueprint Medicines, PharmaEssentia, Constellation, Geron, Abbvie, Sierra Oncology, and Incyte. AD is founder of Omix Technologies Inc and Altis Biosciences, and scientific advisory board member for Hemanext Inc and Macopharma.

Figures

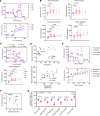
Figure 1
Figure 1. Platelets from ET patients show significantly increased P-selectin level and PLA formation.
(A) Representative figure of exposure of P-selectin on the surface of platelets measured by flow cytometry. (B) P-selectin expression on the surface of platelets at baseline and following 1 μM TRAP6 or 5 μg/mL collagen stimulation (HI = 7, PV = 8, ET = 16, MF = 8). Data are mean ± SD and were assessed by Kruskal-Wallis test. (C) Representative figure of PLA ratio measured by flow cytometry. Data are presented as percentages of aggregates from the respective leukocyte population. (D) PLA measurements in whole blood at baseline and following 1 μM TRAP6 or 5 μg/mL collagen stimulation (HI = 7, PV =8, ET = 16, MF = 8). Data are mean ± SD and were assessed by Kruskal-Wallis test. (E) αIIbβ3 integrin expression (presented as the percentage positive staining of anti–PAC-1 antibody; see Supplemental Table 2) at baseline and following 1 μM TRAP6 or 5 μg/mL collagen stimulation (HI = 7, PV = 8, ET = 16, MF = 8). Data are mean ± SD and were assessed by Brown-Forsythe and Welch’s ANOVA test. (F) Pearson’s correlation coefficient among platelet (PLT) markers and parameters in ET. (G) Simple linear regression between PLA percentage and P-selectin percentage in ET. (H) Simple linear regression between αIIbβ3 integrin percentage and P-selectin percentage in ET.
Figure 2
Figure 2. scRNA-seq revealed the activation of platelets and monocytes in peripheral blood from ET patients.
(A) UMAP plot of cells sequenced from HIs (n = 3) and ET patients (n = 5). (B) UMAP plot of cells sequenced from HIs and ET patients with cell type annotations. PLT, platelet; HSC, hematopoietic stem cell. (C) UMAP plot showing platelets clustering with scores for “reactome platelet activation signaling and aggregation” gene set. (D) UMAP plot showing platelets from HIs and ET. (E) Violin plot of platelet clusters showing scores for “reactome platelet activation signaling and aggregation” gene set. (F) Venn diagram showing overlapped genes among differentially expressed genes in platelets from HIs, ET patients, and genes in “reactome platelet activation signaling and aggregation” gene set. (G) Dot plot of genes in “reactome platelet activation signaling and aggregation” gene set that overlapped with differentially expressed genes in platelets from HIs (0/186) and ET patients (62/686).
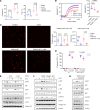
Figure 3
Figure 3. Metabolomics analyses showed distinct metabolic phenotypes of platelets from MPN patients.
(A) Diagram showing sample collection, processing, and analysis. (B) PCA score plot of top 500 most variable proteins in protein LC-MS data of platelets from age- and sex-matched HIs (n = 8) and MPN patients (ET = 12, PV = 7, MF = 9). (C) Heatmap of selected proteins from “hallmark mTORC1 signaling” and “hallmark OXPHOS” gene sets. Columns were reordered based on the results of hierarchical clustering to identify sample correlations. (D) GSEA enrichment plots for “hallmark mTORC1 signaling” and “hallmark OXPHOS” gene sets enriched in ET patients versus HIs. (E) Principal component analysis (PCA) score plot of metabolite LC-MS data of platelets from age- and sex-matched HIs (n = 8) and MPN patients (ET = 12, PV = 7, MF = 9) displayed with 80% confidence region. (F) Volcano plot of metabolite changes between HIs and MPN patients. Red dots denote significant (P < 0.05) and positive fold change (logFC > 20.5) features. Blue dots denote significant (P < 0.05) and negative fold change (logFC < –20.5) features. (G) The diagram showing steps of glycolysis and TCA cycle and scatter plots of peak areas (arbitrary units after normalization) for several key metabolites. Data are mean ± SD and were assessed by Kruskal-Wallis test with Dunn’s multiple-comparison test. P values are marked if less than 0.05. (H) Western blot of washed platelets from HIs and MPN patients against TOM-20 (see Supplemental Table 2), a mitochondrial marker protein, and quantifications. Data are mean ± SD and were assessed by 2-tailed Mann-Whitney U test. (I) Western blot of washed platelets from HIs and MPN patients detecting human OXPHOS components (complex I–V proteins) with an antibody cocktail and quantifications. Data are mean ± SD and were assessed by 2-tailed Mann-Whitney U test.
Figure 4
Figure 4. Effects of mTOR inhibitors and ruxolitinib on platelet activities.
(A) Representative image and dot plot showing effects of mTOR inhibitors and ruxolitinib on maximal aggregation intensity of washed ET platelets. Washed platelets were treated with sapanisertib, omipalisib, or ruxolitinib at 5 μM for 1 hour followed by platelet aggregation analysis with 5 μM TRAP6 stimulation. Data shown as mean ± SD and were assessed by Friedman’s test and Dunn’s multiple-comparison test. (B) Representative images showing effects of mTOR inhibitors and ruxolitinib on activation of washed ET platelets. Washed platelets were treated with sapanisertib, omipalisib, or ruxolitinib at 5 μM for 1 hour followed by flow cytometry analysis. (C) Immunoblots showing changes in intracellular signaling pathways of platelets after mTOR inhibitor and ruxolitinib treatments. Washed platelets were treated with sapanisertib, omipalisib, or ruxolitinib at 5 μM for 1 hour followed by stimulation with TRAP6 peptides and immunoblot analysis. (D) Immunoblots showing changes in intracellular signaling pathways of MPN platelets after omipalisib treatment. Washed platelets were treated with omipalisib at 0.2, 1, and 5 μM for 1 hour followed by stimulation with TRAP6 peptides and immunoblot analysis. (E) Representative OCR and ECAR profiles of platelets showing the blockage of energy demand boost by mTOR inhibitors after TRAP6 stimulation. Washed ET platelets were treated with sapanisertib, omipalisib, or ruxolitinib at 5 μM for 1 hour followed by Seahorse analysis (a, oligomycin A; b, FCCP; c, rotenone/antimycin A). TRAP6 (20 μM) was injected on-plate to stimulate platelet energy demand.
Figure 5
Figure 5. Platelets from MPN patients displayed bioenergetic alterations, which can be reverted by α-KG supplementation.
(A) Representative OCR and ECAR profiles of platelets from 2 HIs, 1 ET patient, and 1 MF patient (a, oligomycin A; b, FCCP; c, rotenone/antimycin A). (B) Quantification of basal OCR, ATP production, maximal OCR, and spare capacity profiles of washed platelets in HIs (n = 8) and MPN patients (n = 18: ET = 9, PV = 4, MF = 5). Data are mean ± SD and were assessed by Kruskal-Wallis test with Dunn’s multiple-comparison test. P values are marked if less than 0.05. (C) Representative OCR profiles of platelets from 1 HI and 1 ET patient showing the energy demand boost after TRAP6 stimulation and quantification of post-TRAP6 stimulation OCR profiles (a, oligomycin A; b, FCCP; c, rotenone/antimycin A). Data are mean ± SD and were assessed by Kruskal-Wallis test with Dunn’s multiple-comparison test. P values are marked if less than 0.05. (D) Correlation analysis of bioenergetic parameters and platelet functional parameters. (E) Representative OCR and ECAR profiles of platelets from 1 HI and 1 ET patient with the preincubation of 500 μM octyl-α-KG or DMSO for 1 hour (a, oligomycin A; b, FCCP; c, rotenone/antimycin A). (F) Platelet OCR/ECAR ratio from 1 HI and 1 ET patient with the preincubation of 500 μM octyl-α-KG or DMSO control. (G) Quantification of individual components of the platelet OCR profile in MPN (n = 5). Data were normalized to DMSO group set as 1, are presented as mean ± SD, and were assessed by 2-tailed Mann-Whitney U test.
Figure 6
Figure 6. α-KG inhibited platelet activation through the suppression of ATP synthase.
(A) Washed MPN platelet P-selectin and αIIbβ3 integrin expression changes after incubation with 200 μM octyl-α-KG for 1 hour ex vivo. Data are mean ± SD and were assessed by 2-tailed, paired Student’s t test. (B) Platelet aggregation assay with α-KG treatment. Washed ET platelets were incubated with 100 μM (L) or 200 μM (H) octyl-α-KG for 1 hour and stimulated with 5 μM TRAP6 followed by platelet aggregation tests. Maximal aggregation intensity was quantified as mean ± SD. Data were assessed by 2-tailed, paired Student’s t test. (C) Platelet adhesion and spreading assay with α-KG. Number and area of attached platelets on the coverslips were quantified with CellProfiler software (n = 9). Data are mean ± SD and were assessed by 2-tailed Mann-Whitney U test. Total original magnification, ×1000. (D) Platelet P-selectin and αIIbβ3 integrin expression changes in α-KG–supplemented mice. Age- and sex-matched wild-type and Jak2 V617F–knockin mice were supplemented with regular water (n = 7) or 2% α-KG (n = 7) for 1 week. Platelets were stimulated with thrombin ex vivo or not followed by flow cytometry analysis. Data shown as the ratio (mean ± SD) of P-selectin/αIIbβ3 integrin double-positive platelets and were assessed by 2-tailed Student’s t test. (E) Immunoblots of washed platelets after α-KG treatment. Washed ET platelets were incubated with 250 μM or 500 μM octyl-α-KG for 1 hour followed by stimulation with TRAP6 peptides. (F) Immunoblots of washed platelets after α-KG treatment with different stimulants. Washed ET platelets were incubated with 250 μM octyl-α-KG followed by stimulation with 5 μM TRAP6 peptides or 5 μg/mL collagen or 20 μM ADP. (G) Immunoblots of washed platelets after α-KG or oligomycin (Omy) treatment. Washed ET platelets were incubated with 250 μM octyl-α-KG or 1 μM Omy followed by stimulation with TRAP6 peptides.
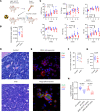
Figure 7
Figure 7. α-KG exerts therapeutic effects on MPN and inhibits megakaryopoiesis.
(A) Schematic of the Jak2 V617F–knockin mice. cKit+ cells from Jak2 V617F CD45.2 C57BL/6J mice were isolated and transplanted into irradiated CD45.1 C57BL/6J mice. Two weeks after transplantation, mice were randomly grouped and supplemented with regular water (control, n = 10) or 1% α-KG in drinking water (n = 10) daily for 6 weeks. (B) Spleen weight of transplanted mice normalized to body weight measured at the end of treatments. Data are mean ± SD and were assessed by 2-tailed Student’s t test. (C) WBC, platelet (PLT) count, RBC, hematocrit (HCT), monocyte (MO) count, and ratio of Jak2 V617F–transplanted mice treated with regular water or α-KG across multiple time points. Data are mean ± SD and were assessed by 2-way ANOVA with Dunnett’s multiple-comparisons test. *P < 0.05, **P < 0.01, ***P < 0.001, ****P < 0.0001. (D) Representative images of H&E staining of femur bones from mice treated with regular water or α-KG. (E) Representative images of immunofluorescent staining of expanded CD34+ cells and differentiated megakaryocytes from the same individual. Total original magnification, ×200 (D) and ×600 (E). (F) Flow cytometry of CD41 and CD61 surface expression on in vitro megakaryocytes differentiated with α-KG. Sorted CD34+ hematopoietic stem and progenitor cells were cultured for megakaryocyte differentiation with 250 μM octyl-α-KG or DMSO control. CD41+CD61+ double-positive cells were determined by flow cytometry. Data are mean ± SD and were assessed by 2-tailed, paired Student’s t test. (G) Percentage of LSK cells from Jak2 V617F–transplanted mice treated with regular water or α-KG at the end of treatments. Data are mean ± SD and were assessed by 2-tailed Student’s t test. (H) CFU assays of mouse cKit+ cells with DMSO control or α-KG. Colony numbers were counted after 14 days. Data are mean ± SD and were assessed by 2-tailed Student’s t test.
Figure 8
Figure 8. α-KG inhibited monocyte activation and hyperinflammation.
(A) Plasma cytokine levels in HIs and MPN patients. Plasma from HIs (n = 9) and MPN patients (n = 28) was collected for the determination of 30 biomarkers using a V-PLEX Human Cytokine 30-Plex Kit from Meso Scale Discovery. Data are mean ± SD and were assessed by 2-tailed Mann-Whitney U test. MFpET, myelofibrosis post essential thrombocythemia. (B) Monocyte cytokine secretion changes with octyl-α-KG or oligomycin (Omy) treatment. Sorted CD14+ monocytes (0.5 × 10⁶) from MPN patients (n = 5) were incubated with octyl-α-KG or Omy for 8 hours and the supernatants were collected for cytokine determination by multiplex Luminex assay. Data are mean ± SD and were assessed by 2-tailed Mann-Whitney U test. (C) The PCA score plot of RNA-seq of sorted CD14+ monocytes after the incubation with octyl-α-KG or DMSO control. (D) Bar plot of GSEA results showing top 5 hallmark pathways enriched in DMSO- versus α-KG–treated monocytes. (E) Heatmap showing changes in cytokine secretion by CD11b+ myeloid cells from Jak2 V617F mice. Data were normalized to control group as fold changes. Enriched CD11b+ myeloid cells were incubated with LPS (0.1 mg/mL) in the presence or absence of α-KG for 6 hours. Supernatants were collected for cytokine determination by multiplex Luminex assay. (F) Dot plots of altered intracellular pathways of monocytes in peripheral blood of MPN patients by mass cytometry. Whole blood from MPN patients (n = 6) were incubated with octyl-α-KG or DMSO for 1 hour followed by stimulation with TNF-α. Data are mean ± SD and were assessed by 2-tailed, paired Student’s t test. (G) Proposed model showing the roles of PI3K/AKT/mTOR signaling and metabolic changes in platelets from MPN patients. A positive feedback loop involving PI3K/AKT/mTOR signaling and metabolic changes promotes platelet hyperreactivities and megakaryopoiesis in MPN. The supplementation of α-KG, which disrupts the feedback loop, shows therapeutic effects against platelet hyperreactivity, megakaryopoiesis, and chronic inflammation in MPN.

References

    1. Barbui T, et al. The 2016 WHO classification and diagnostic criteria for myeloproliferative neoplasms: document summary and in-depth discussion. Blood Cancer J. 2018;8(2):15. doi: 10.1038/s41408-018-0054-y. - DOI - PMC - PubMed
    1. Rungjirajittranon T, et al. A systematic review and meta-analysis of the prevalence of thrombosis and bleeding at diagnosis of Philadelphia-negative myeloproliferative neoplasms. BMC Cancer. 2019;19(1):184. doi: 10.1186/s12885-019-5387-9. - DOI - PMC - PubMed
    1. Barbui T, et al. Thrombosis in myeloproliferative neoplasms during cytoreductive and antithrombotic drug treatment. Res Pract Thromb Haemost. 2022;6(1):e12657. doi: 10.1002/rth2.12657. - DOI - PMC - PubMed
    1. Hasselbalch HC, et al. The pathobiology of thrombosis, microvascular disease, and hemorrhage in the myeloproliferative neoplasms. Blood. 2021;137(16):2152–2160. doi: 10.1182/blood.2020008109. - DOI - PubMed
    1. Duchemin J, et al. Increased circulating procoagulant activity and thrombin generation in patients with myeloproliferative neoplasms. Thromb Res. 2010;126(3):238–242. doi: 10.1016/j.thromres.2010.06.025. - DOI - PubMed

Substances