. 2024 Jan 23;9(2):e167299.
doi: 10.1172/jci.insight.167299.

Lung microvascular occlusion by platelet-rich neutrophil-platelet aggregates promotes cigarette smoke-induced severe flu

Affiliations

Lung microvascular occlusion by platelet-rich neutrophil-platelet aggregates promotes cigarette smoke-induced severe flu

Tomasz W Kaminski et al. JCI Insight. .

Abstract

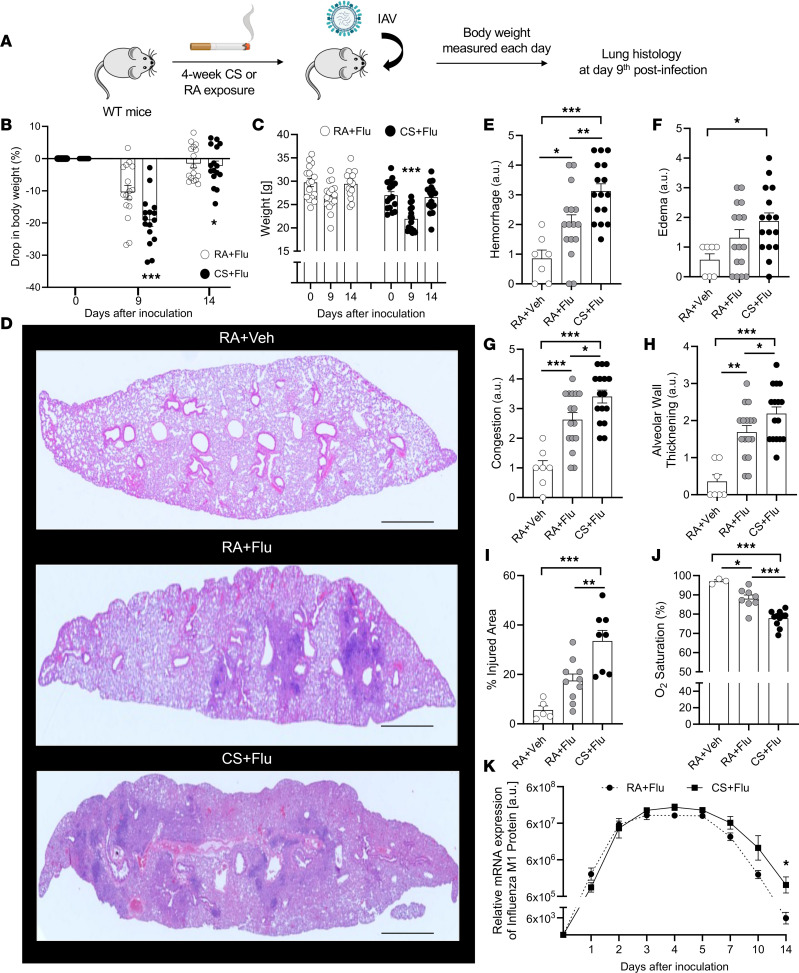
Cigarette smoking is associated with a higher risk of ICU admissions among patients with flu. However, the etiological mechanism by which cigarette smoke (CS) exacerbates flu remains poorly understood. Here, we show that a mild dose of influenza A virus promotes a severe lung injury in mice preexposed to CS but not room air for 4 weeks. Real-time intravital (in vivo) lung imaging revealed that the development of acute severe respiratory dysfunction in CS- and flu-exposed mice was associated with the accumulation of platelet-rich neutrophil-platelet aggregates (NPAs) in the lung microcirculation within 2 days following flu infection. These platelet-rich NPAs formed in situ and grew larger over time to occlude the lung microvasculature, leading to the development of pulmonary ischemia followed by the infiltration of NPAs and vascular leakage into the alveolar air space. These findings suggest, for the first time to our knowledge, that an acute onset of platelet-driven thrombo-inflammatory response in the lung contributes to the development of CS-induced severe flu.

Keywords: Infectious disease; Influenza; Neutrophils; Platelets; Pulmonology.


Conflict of interest statement

Conflict of interest: PS received funding as a part of sponsored research agreements with CSL Behring Inc., IHP Therapeutics, and Novartis Inc. PS is also the recipient of 2021 Bayer Hemophilia Award Program. BJM received grant funding from Bayer Pharmaceuticals, the Pittsburgh Foundation, and the Translational Breast Cancer Research Consortium. BJM also received consulting fees from Boehringer Ingelheim, BioAegis, and Synairgen.

Figures

Figure 1
Figure 1. CS+Flu promotes severe lung injury in mice.
(A) Experimental scheme. WT mice exposed to cigarette smoke (CS) or room air (RA) for 4 weeks followed by intranasal inoculation with influenza A virus (flu) or sterile PBS as vehicle (Veh). Body weight was measured every day after inoculation for 14 days, and lung injury was assessed at day 9 after inoculation. (B and C) Percent drop in body weight and absolute body weight at day 0, 9, and 14 after inoculation in RA+Flu and CS+Flu mice (n = 16 per group). (D) Representative H&E-stained histological sections of the whole left lung of an RA+Veh, RA+Flu, and CS+Flu mouse at day 9 after inoculation. Scale bars: 100 μm. (EJ) Lung histological sections were scored (refer to Methods for details, n = 8–16 per group) for severity of hemorrhage (E), pulmonary edema (F), vascular congestion (G), alveolar wall thickening (H), percentage of injured area (I), and percent blood oxygen saturation in RA+Veh, RA+Flu and CS+Flu mice (J) (n = 3–12 per group) at day 4 after inoculation. (K) Relative mRNA expression of Influenza M1 Protein (refer Methods for details) at different days after flu infection in RA+Flu and CS+Flu mice (n = 3–5 per group). Data are shown as mean ± SEM and compared using Student’s t test. Comparative statistical analysis was performed by 1-way ANOVA. Comparative statistical analysis was performed by 1-way ANOVA with Bonferroni correction. *P < 0.05; **P < 0.01; ***P < 0.001.
Figure 2
Figure 2. CS+Flu promotes early-onset of thrombo-inflammation in mice.
(A) Experimental scheme. WT mice exposed to cigarette smoke (CS) or room air (RA) for 4 weeks followed by intranasal inoculation with influenza A virus (flu) or sterile PBS as vehicle (Veh), and quantitative fluorescence intravital lung microscopy (qFILM) was used to assess thrombo-inflammation in the lung of live mice at 2 and 4 days after inoculation. The microcirculation (pseudo-colored purple), neutrophils (red), and platelets (pseudo-colored green) were labeled in vivo by i.v. administration of FITC dextran, AF546 anti–mouse Ly6G Ab, and V450 anti–mouse CD49b Ab, respectively. Refer to Methods for details. (B and C) Representative qFILM images of lung microcirculation in RA+Veh, RA+Flu, and CS+Flu mice are shown at (B) day 2 and (C) day 4 after flu infection. Neutrophil-platelet aggregates (NPAs) are marked by dashed ovals. Erythrocytes are visible as dark cells within the lung microcirculation. Complete time series for images in B and C are shown in Supplemental Videos 1–6. Scale bars: 50 μm.
Figure 3
Figure 3. In situ formation of large platelet-rich NPAs promotes pulmonary thrombo-inflammation in CS+Flu mice.
Mice were exposed to CS or RA for 4 weeks followed by inoculation with flu, and qFILM was used to assess thrombo-inflammation in the lung at 4 days after infection. Microcirculation (pseudocolored purple), neutrophils (red), and platelets (pseudocolored green). (A and B) qFILM images of 2 separate field of views (FOVs) in the lung of CS+Flu mice at four different time points. (A) A neutrophil bound to platelets (arrowhead) crawls intravascularly to join a large NPA (dashed ellipse). Refer to Supplemental Video 7. Arrow denotes direction of blood flow. Scale bar: 25 µm. (B) A neutrophil bound to platelets (arrowhead) crawls intravascularly to join an existing NPA (dashed ellipse). Scale bar: 20 µm. Refer to Supplemental Video 8. qFILM analysis revealed that (C) the number of neutrophils crawling toward a large NPA per FOV was significantly higher and (D) the crawling velocity of neutrophils was significantly lower in the lung microcirculation of CS+Flu than RA+Flu mice. (E) The crawling velocity of single neutrophils (without bound platelets) was not different from the neutrophils bound to platelets. qFILM images were analyzed to compare (F) number of NPAs per FOV and (G) size of NPAs in the lung of RA+Flu and CS+Flu mice. (H) Three representative qFILM images of platelet-rich NPAs in the lung microcirculation of CS+Flu mice. Scale bar: 10 μm (left) and 25 μm (middle and right). (I) Percent FOVs containing at least 1 platelet-rich NPA in the lung of RA+Flu and CS+Flu mice. FOV size ~8,600 µm2 (A) and ~4,300 µm2 (B). *P < 0.05, **P < 0.01. Data in C, D, and F are shown as mean ± SEM and compared using Students’ t test. n = 5 mice per group and ~6–8 FOVs per mouse (CG and I).
Figure 4
Figure 4. Platelet-rich NPAs promote severe pulmonary ischemia in CS+Flu mice.
Mice were exposed to CS or RA for 4 weeks, followed by inoculation with flu, and qFILM was used to assess thrombo-inflammation in the lung at 4 days after infection. Microcirculation (pseudocolored purple), neutrophils (red), and platelets (pseudo-colored green). (A) Cropped qFILM images of the same FOV in the lung of a CS+Flu mouse shown at 4 different time points. Four neutrophils decorated with platelets crawl intravascularly (direction shown by arrows) over 9 minutes to form an NPA, which occludes a pulmonary microvessel (purple vascular dye disappears in the dashed ellipse). Time points relative to the first frame at 0 seconds. Refer to Supplemental Video 9. (B) Three representative qFILM images showing occlusion of lung microvessels (lack of blood flow evident by the absence of purple fluorescence in the microvessels marked with dotted lines). (C) Representative qFILM images of the lung of RA+Flu (top row) and CS+Flu (bottom row) mouse showing ischemic areas (dark regions without purple vascular dye). NPAs marked by arrowheads. Images in the right column show only the vascular dye (purple) channel of the respective 3-color images in the left column. Scale bars: 20 µm. qFILM data was analyzed to compare (D) number of ischemic areas per field of view (FOV), (E) percent FOVs with ischemic areas, and (F) size of ischemic areas in the lung of RA+Flu and CS+Flu mice. Data in D and F are shown as mean ± SEM and compared using Students’ t test. Data in E are shown as percentages and compared using χ2 distribution test. n = 5 mice per group and ~6–8 FOVs per mouse. *P < 0.05, **P < 0.01, ***P < 0.001. FOV size, 6,400 µm2.
Figure 5
Figure 5. Pulmonary ischemia leads to severe vascular leakage in the lung of CS+Flu mice.
Mice exposed to CS or RA for 4 weeks followed by inoculation with Flu, and qFILM used to assess thrombo-inflammation in the lung at 4 days after infection. Microcirculation (pseudocolored purple), neutrophils (red), and platelets (pseudocolored green). qFILM images of the lung microcirculation in an (A) RA+Flu and (B) CS+Flu mouse showing alveolar air spaces with (#) or without (*) vascular leakage (presence of purple vascular dye in air spaces). Right panels show magnified view of the dashed box in left panels. Dashed contours in right panels mark the walls of the pulmonary microvessels bordering the alveolar air spaces. Presence (A; right panel) and absence (B; right panel) of vascular dye between the dashed contours suggests the presence or absence of blood flow in microvessels. Refer to Supplemental Videos 13 and 14. Scale bars: 50 µm (left panels) and 20 µm (right panels). qFILM images were analyzed to compare (C) percent field of views (FOVs) with vascular leakage and (D) size of vascular leakage areas in the lung of RA+Flu and CS+Flu mice. Data in C are shown as percentages and compared using χ2 distribution test. Data in D are shown as mean ± SEM and compared using Students’ t test. n = 5 mice/group and ~6–8 FOVs per mouse. *P < 0.05. FOV size, ~65,000 µm2. (E) Cropped qFILM image of the same FOV in the lung of a CS+Flu mouse show 2 neutrophils crawling intravascularly in opposite directions (shown by arrows). One neutrophil crawls to the left; meanwhile, the second neutrophil crawls to the right and transmigrates into the air space. Arrowhead marks the disappearing tail of the emigrating neutrophil. Refer to Supplemental Video 15. Scale bar: 10 µm.

References

    1. Paules CI, et al. Chasing seasonal influenza - the need for a universal influenza vaccine. N Engl J Med. 2018;378(1):7–9. doi: 10.1056/NEJMp1714916. - DOI - PubMed
    1. Torres A, et al. Severe flu management: a point of view. Intensive Care Med. 2020;46(2):153–162. doi: 10.1007/s00134-019-05868-8. - DOI - PMC - PubMed
    1. Sockrider M, et al. COVID-19 infection versus influenza (Flu) and other respiratory illnesses. Am J Respir Crit Care Med. 2020;202(10):P27–P28. doi: 10.1164/rccm.2020C16. - DOI - PubMed
    1. Iwasaki A, Pillai PS. Innate immunity to influenza virus infection. Nat Rev Immunol. 2014;14(5):315–328. doi: 10.1038/nri3665. - DOI - PMC - PubMed
    1. Kuiken T, et al. Pathogenesis of influenza virus infections: the good, the bad and the ugly. Curr Opin Virol. 2012;2(3):276–286. doi: 10.1016/j.coviro.2012.02.013. - DOI - PubMed

Publication types