. 2024 Jan 23;9(2):e174220.
doi: 10.1172/jci.insight.174220.

CRISPR screening identifies BET and mTOR inhibitor synergy in cholangiocarcinoma through serine glycine one carbon

Affiliations

CRISPR screening identifies BET and mTOR inhibitor synergy in cholangiocarcinoma through serine glycine one carbon

Yan Zhu et al. JCI Insight. .

Abstract

Patients with cholangiocarcinoma have poor clinical outcomes due to late diagnoses, poor prognoses, and limited treatment strategies. To identify drug combinations for this disease, we have conducted a genome-wide CRISPR screen anchored on the bromodomain and extraterminal domain (BET) PROTAC degrader ARV825, from which we identified anticancer synergy when combined with genetic ablation of members of the mTOR pathway. This combination effect was validated using multiple pharmacological BET and mTOR inhibitors, accompanied by increased levels of apoptosis and cell cycle arrest. In a xenograft model, combined BET degradation and mTOR inhibition induced tumor regression. Mechanistically, the 2 inhibitor classes converged on H3K27ac-marked epigenetic suppression of the serine glycine one carbon (SGOC) metabolism pathway, including the key enzymes PHGDH and PSAT1. Knockdown of PSAT1 was sufficient to replicate synergy with single-agent inhibition of either BET or mTOR. Our results tie together epigenetic regulation, metabolism, and apoptosis induction as key therapeutic targets for further exploration in this underserved disease.

Keywords: Cell Biology; Drug screens; Gastroenterology; Liver cancer.


Conflict of interest statement

Conflict of interest: The authors have declared that no conflict of interest exists.

Figures

Figure 1
Figure 1. In vitro CRISPR screen identified synergy with BET inhibition.
(A) BETp ARV825 GC50 for normal cholangiocyte (MMNK1) and 8 CCA cell lines. GC50 for MMNK1 is > 150 nM. (B) Schematic of the workflow for CRISPR screening with ARV825. (C) DrugZ ranking of CRISPR screen hits in SNU1079 with ARV825. Data are from 2 independent biological repeats. (D) Gene set enrichment analysis of depleted sgRNAs. (E and F) The top mTOR-related gene sets from GSEA.
Figure 2
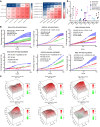
Figure 2. In vitro validation of synergy between mTOR and BET inhibition.
(A) Growth fold of SNU1079 with 100 hours under the combination of RAPA/AZD8055 and ARV825. (B) Growth curve of 3 cell lines under the given BET and mTOR inhibition states. (C) Bliss score curves of 3 cell lines under the given BET and mTOR inhibition states. (D) Summary of highest Bliss scores in 3 CCA cell lines with different BET and mTOR inhibitor combinations with duplicates, excluding 80 nM ARV825, which may have off-target effects. Data are from 2 independent biological repeats and are presented as mean ± SD.
Figure 3
Figure 3. BETp plus mTORi enhances cell cycle arrest and apoptosis compared with single agents.
(A and B) Cell cycle measurement by propidium iodide in SNU1079 (A) or SSP25 (B) at 48 hours with the listed treatments. Data are from 3 independent biological repeats and are presented as mean ± SD. One-way ANOVA was used to calculate statistical difference. (C) Western blots of known target proteins for BET and mTOR inhibition at 48 hours with the listed drug treatments in SNU1079 and SSP25. (D and E) Quantitative measurement of protein levels from C, normalized to GAPDH. Data are from 3 independent biological repeats and presented as mean ± SD. One-way ANOVA was used to calculate statistical difference. ****P < 0.0001; ***P < 0.001; **P < 0.01; *P < 0.05. See full unedited blots in supplemental material.
Figure 4
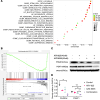
Figure 4. BETp + mTORi affects SGOC metabolism through PSAT1 and PHGDH.
(A) GSEA of genes with decreased expression under 48 hours of treatment with BETp + mTORi in SNU1079 and SSP25. (B) GSEA graph of the SGOC LOCASALE gene set. (C) Western blot of PHGDH and PSAT1 at 48 hours with the listed drug treatments in SNU1079. (D) Quantitative measurement of C, normalized to GAPDH. Data are from 3 independent biological repeats and are presented as mean ± SD. One-way ANOVA was used to calculate statistical difference. **P < 0.01; *P < 0.05. See full unedited blots in supplemental material.
Figure 5
Figure 5. BETp + mTORi affects components of SGOC metabolism.
(A) MS quantitation of key SGOC components at 48 hours with the listed drug treatments. THF, tetrahydrofolate. (B) A simplified schematic of the SGOC pathway with the MS results overlaid. 3-PG, 3-phosphoglycerate; 3-PHP, 3-phosphate hydroxypyruvate; 3-PSer, 3-phosphoserine; PHGDH, phosphoglycerate dehydrogenase; PSAT, phosphoserine aminotransferase; PSPH, phosphoserine phosphatase.
Figure 6
Figure 6. BETp + mTORi reduces global H3K27 acetylation, and PSAT1 knockdown synergizes with BETp and mTORi.
(A) Global H3K27ac density at 48 hours with the listed drug treatments in SNU1079. (B) Summary of global H3K27ac peaks from A. (C) H3K27ac peaks near the PSAT1 locus in SNU1079. (D) Western blot of PSAT1 in shNT or PSAT1 shRNA–transduced SNU1079. (E and F) Growth curve of SNU1079 with PSAT1 shRNAs combined with 40 nM ARV825 (E) or 50 nM AZD8055 (F). Data are from 2 independent biological repeats and are presented as mean ± SD. See full unedited blots in supplemental material.
Figure 7
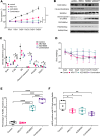
Figure 7. In vivo validation of the synergistic effect.
(A) Tumor growth curve under different BETp and mTORi treatments. Data are from 8 independent biological repeats and are presented as mean ± SD. One-way ANOVA was used to calculate statistical difference. (B) Western blot of selected proteins from the tumors in A at day 20. (C) Quantitative measurement of protein levels from B, normalized to GAPDH. Data are from 2 independent biological repeats and are presented as mean ± SD. One-way ANOVA was used to calculate statistical difference. (D) Body weight of the mice in A. (E) Quantitative measurement of TUNEL assay. Data are from 4 independent tumors and are presented as mean ± SD. One-way ANOVA was used to calculate statistical difference. (F) Quantitative measurement of pHH3. Data are from 4 independent tumors and are presented as mean ± SD. One-way ANOVA was used to calculate statistical difference. ****P < 0.0001; ***P < 0.001; **P < 0.01; *P < 0.05. See full unedited blots in supplemental material.

References

    1. Llovet JM, et al. Hepatocellular carcinoma. Nat Rev Dis Primers. 2016;2:16018. doi: 10.1038/nrdp.2016.18. - DOI - PubMed
    1. Ghouri YA, et al. Cancer review: cholangiocarcinoma. J Carcinog. 2015;14:1. doi: 10.4103/1477-3163.151940. - DOI - PMC - PubMed
    1. Yu TH, et al. Clinicopathological characteristics and prognostic factors for intrahepatic cholangiocarcinoma: a population-based study. Sci Rep. 2021;11(1):3990. doi: 10.1038/s41598-021-83149-5. - DOI - PMC - PubMed
    1. Saha SK, et al. Forty-year trends in cholangiocarcinoma incidence in the U.S.: intrahepatic disease on the rise. Oncologist. 2016;21(5):594–599. doi: 10.1634/theoncologist.2015-0446. - DOI - PMC - PubMed
    1. Charbel H, et al. Cholangiocarcinoma: epidemiology, risk factors, pathogenesis, and diagnosis. Curr Gastroenterol Rep. 2011;13(2):182–187. doi: 10.1007/s11894-011-0178-8. - DOI - PubMed

Publication types

MeSH terms

Substances