. 2023 Dec 7;134(3):e174528.
doi: 10.1172/JCI174528.

Hemorrhage-activated NRF2 in tumor-associated macrophages drives cancer growth, invasion, and immunotherapy resistance

Hemorrhage-activated NRF2 in tumor-associated macrophages drives cancer growth, invasion, and immunotherapy resistance

Dominik J Schaer et al. J Clin Invest. .

Abstract

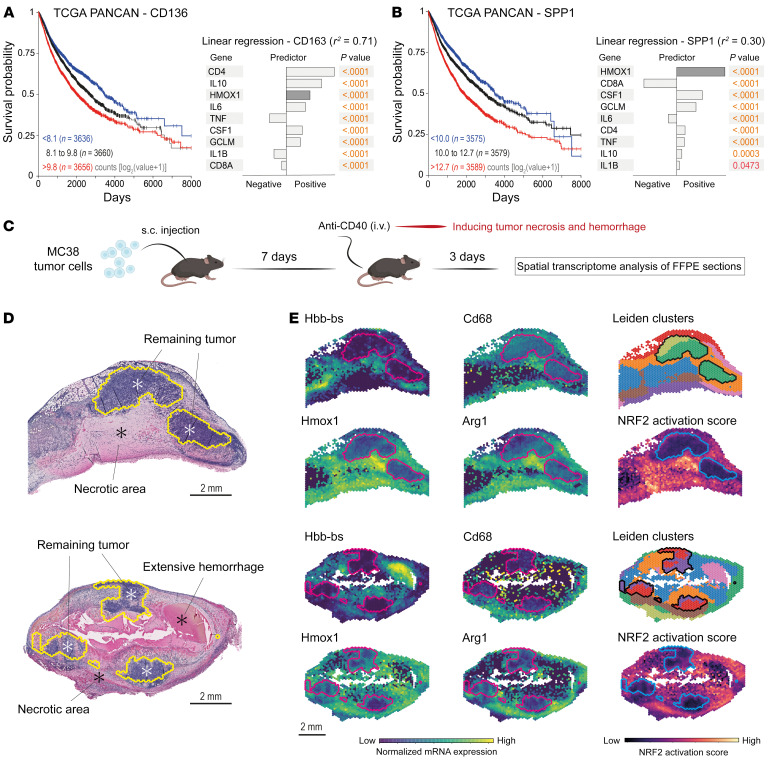
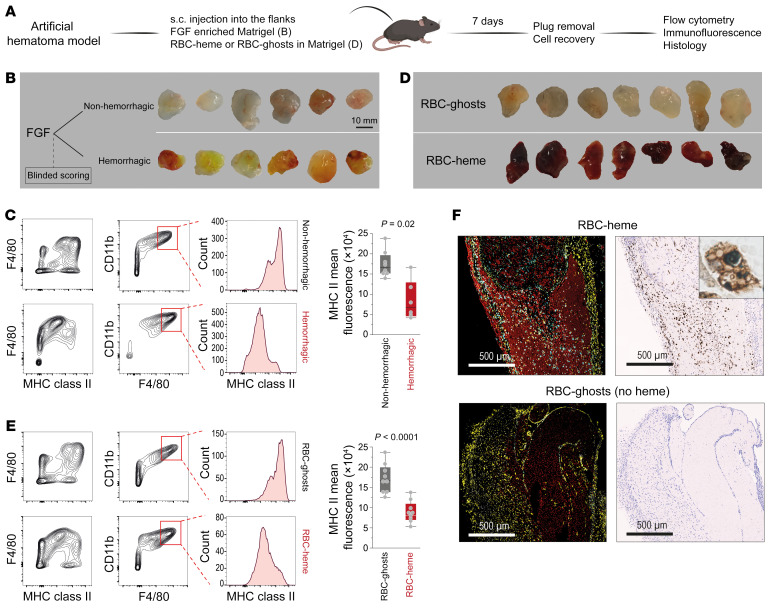
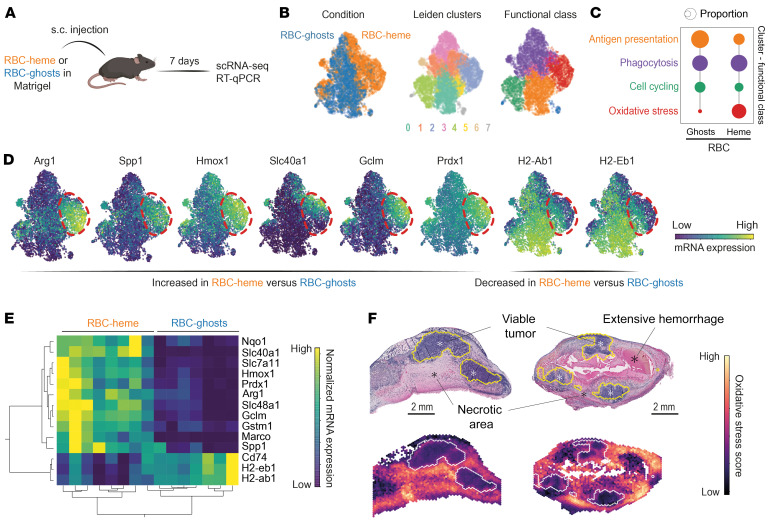
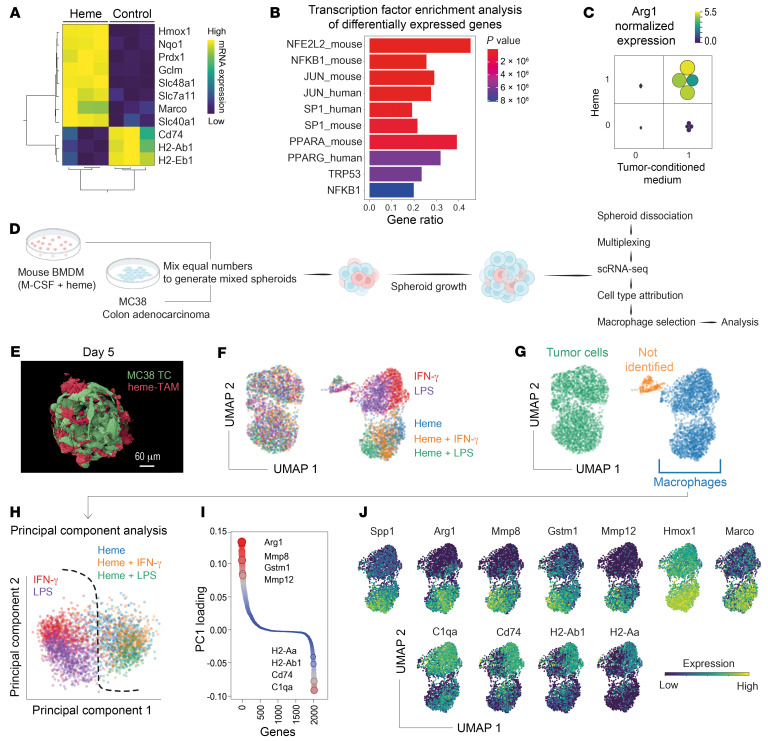
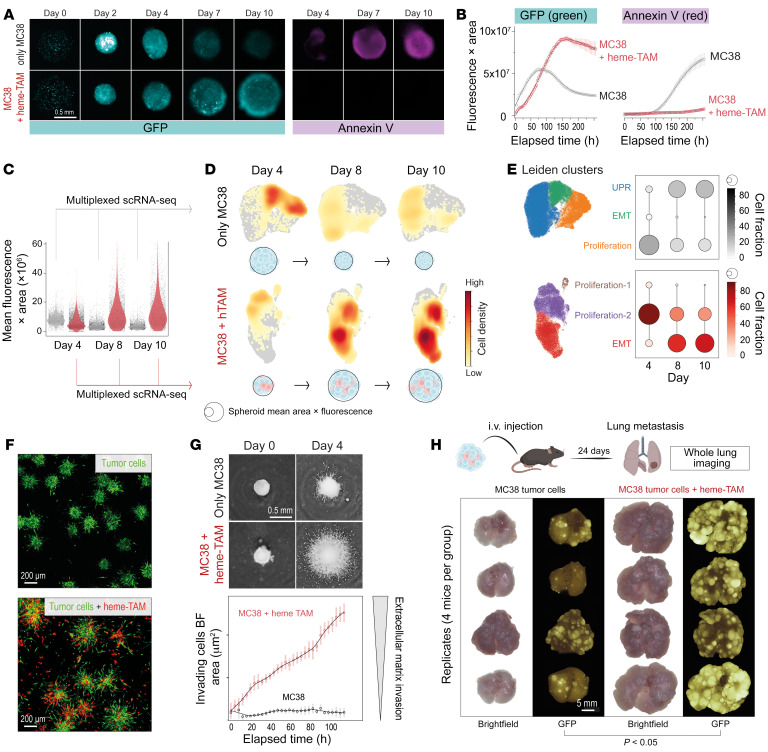
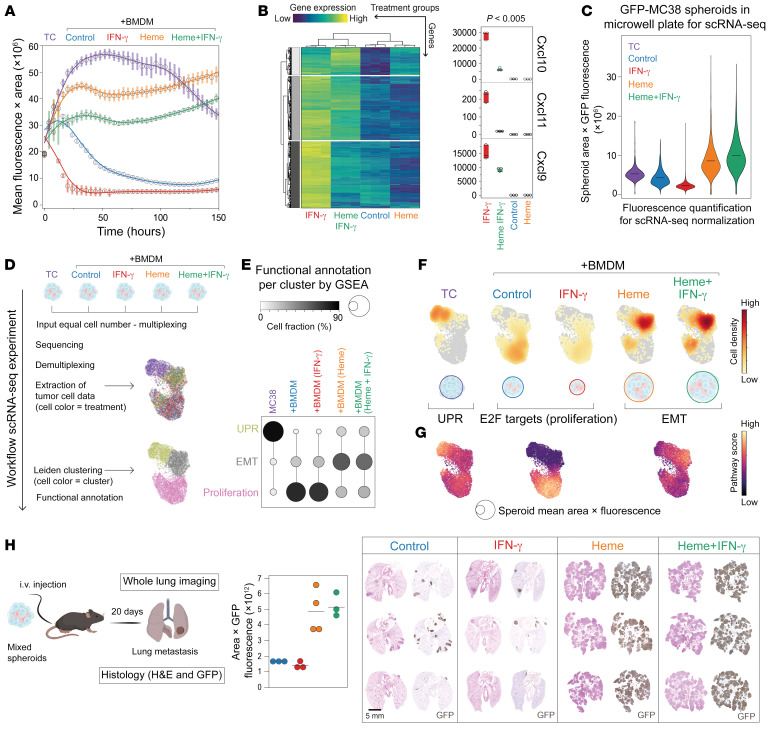
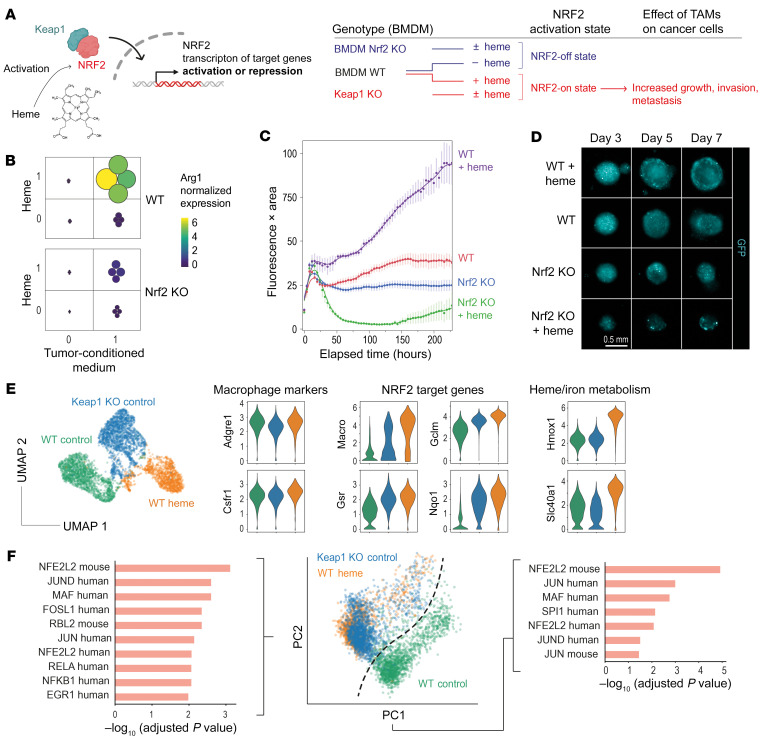
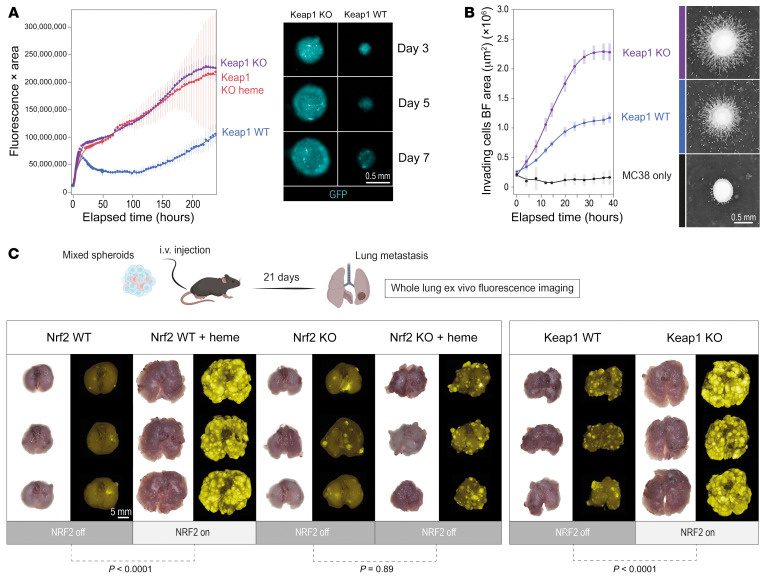
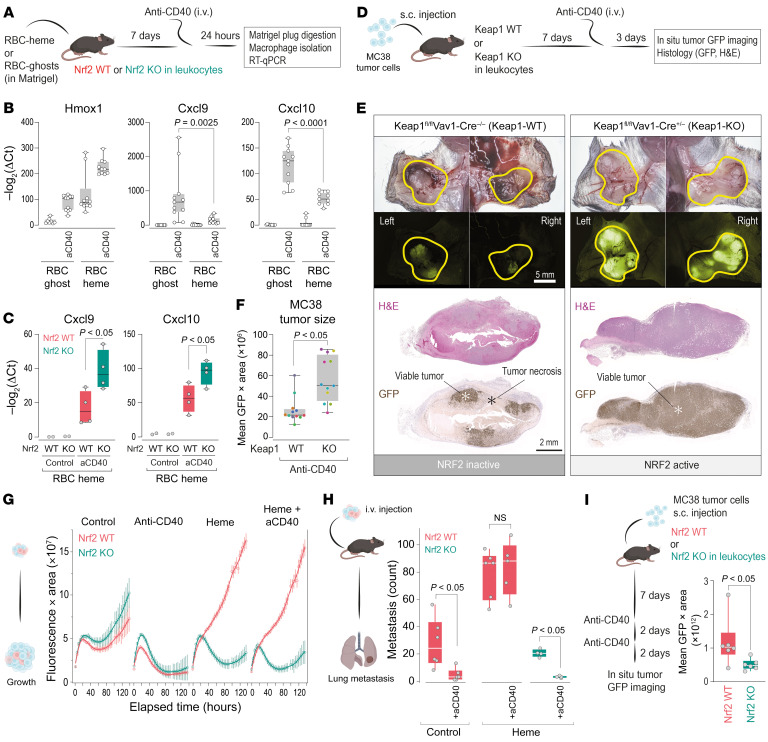
Microscopic hemorrhage is a common aspect of cancers, yet its potential role as an independent factor influencing both cancer progression and therapeutic response is largely ignored. Recognizing the essential function of macrophages in red blood cell disposal, we explored a pathway that connects intratumoral hemorrhage with the formation of cancer-promoting tumor-associated macrophages (TAMs). Using spatial transcriptomics, we found that NRF2-activated myeloid cells possessing characteristics of procancerous TAMs tend to cluster in perinecrotic hemorrhagic tumor regions. These cells resembled antiinflammatory erythrophagocytic macrophages. We identified heme, a red blood cell metabolite, as a pivotal microenvironmental factor steering macrophages toward protumorigenic activities. Single-cell RNA-Seq and functional assays of TAMs in 3D cell culture spheroids revealed how elevated intracellular heme signals via the transcription factor NRF2 to induce cancer-promoting TAMs. These TAMs stabilized epithelial-mesenchymal transition, enhancing cancer invasiveness and metastatic potential. Additionally, NRF2-activated macrophages exhibited resistance to reprogramming by IFN-γ and anti-CD40 antibodies, reducing their tumoricidal capacity. Furthermore, MC38 colon adenocarcinoma-bearing mice with NRF2 constitutively activated in leukocytes were resistant to anti-CD40 immunotherapy. Overall, our findings emphasize hemorrhage-activated NRF2 in TAMs as a driver of cancer progression, suggesting that targeting this pathway could offer new strategies to enhance cancer immunity and overcome therapy resistance.

Keywords: Cancer; Inflammation; Innate immunity; Macrophages; Oncology.


Conflict of interest statement

Conflict of interest: The authors have declared that no conflict of interest exists.

Figures

Figure 1
Figure 1. RBC and heme exposure defines an identity of tumor-associated macrophages.
(A) Left: Kaplan-Meier survival analysis stratified by CD163 mRNA expression in patients with solid cancers in the TCGA PANCAN database. Right: Linear regression model with CD163 as the response variable and tissue microenvironmental factors as the predictors (r2 = 0.71). (B) Left: Kaplan-Meier survival analysis stratified by SPP1 mRNA expression in patients with solid cancers in the TCGA PANCAN database. Right: Linear regression model with SPP1 as the response variable and the tissue microenvironmental factors as predictors (r2 = 0.30). (C) MC38 tumor–bearing mice were treated with agonistic anti-CD40 antibodies to induce hemorrhagic tumor necrosis. Spatial RNA-Seq analysis was performed to characterize macrophages in the perinecrotic tumor microenvironment. (D) HE-stained MC38 tumor sections used for transcriptional analysis. Scale bars: 2 mm. Marked areas indicate the remaining tumoral tissue. (E) Expression of selected genes, highlighting the presence of Cd68+Hmox1+Arg1+ macrophages in the hemorrhagic (Hbb-bs+) tumor regions. The Cd68+Hmox1+Arg1+ regions are marked by a high NRF2 activation score. The lines delineate the remaining tumor.
Figure 2
Figure 2. Erythrophagocytic transformation of macrophages in RBC-heme Matrigel plugs.
(A) Subcutaneously placed FGF-enriched Matrigel plugs were used to study the effect of hemorrhage on the phenotype of invading macrophages. Plugs enriched with intact RBCs (RBC-heme) or RBC-ghosts were used to study the specific effect of hemoglobin-heme. (B) FGF-enriched Matrigel plugs were collected from the subcutaneous (s.c.) injection site 7 days after injection and classified by blinded investigators as non-hemorrhagic or hemorrhagic based on their macroscopic appearance. (C) Flow cytometry contour plots of plug-invading cells, defining F4/80+CD11b+ macrophages with lower MHC class II expression in hemorrhagic plugs. The box plots depict the mean fluorescence intensities of MHC class II expression within the CD11b+F4/80+ population (n = 6–8 plugs per condition; each dot represents 1 plug; t test). (D) RBC-heme and RBC-ghost plugs were collected 7 days after s.c. injection. (E) Flow cytometry contour plots of plug-invading cells defining F4/80+CD11b+ macrophages with lower MHC class II expression in RBC-heme than RBC-ghost plugs. The box plots depict the mean fluorescence intensities of MHC class II expression within the CD11b+F4/80+ population (n = 9 plugs per condition; each dot represents 1 plug; t test). (F) Fluorescence immunohistochemistry images of Matrigel plug sections stained with TER119 (red, RBC-heme or RBC-ghost), anti-F4/80 (yellow, macrophages), and anti-HMOX1 antibodies (cyan). Nuclei were stained with DAPI (white). Images were acquired using a PhenoImager HT (Akoya). Corresponding consecutive sections stained for iron show iron accumulation in infiltrating cells. Scale bars: 500 μm. The inset shows an iron-positive erythrophagocyte containing multiple RBC remnants.
Figure 3
Figure 3. RBC-heme enforces the transformation of macrophages into heme-TAMs.
(A) RBC-heme– and RBC-ghost–enriched Matrigel plugs were collected 7 days after s.c. placement and processed for scRNA-Seq analysis. (B) Plug-invading cells were enriched by anti-F4/80 and anti-CD11b magnetic beads from an RBC-heme and an RBC-ghost Matrigel plug before scRNA-Seq analysis. UMAPs are color-coded for condition, Leiden cluster, and the attributed functional class. (C) Proportion of macrophages per functional class stratified for RBC-heme and RBC-ghost. The dot size corresponds to the proportion of cells (%) per functional class. This analysis visualizes that erythrophagocytosis fosters the emergence of oxidative stress–handling macrophages while suppressing cells equipped for antigen presentation. (D) Expression heatmaps of selected signature genes. The dashed line highlights the region of the UMAP containing the oxidative stress cluster. These macrophages have high expression of Arg1, Spp1, and heme-, iron-, and oxidative stress–handling genes, while expression of MHC class II–related genes is low. (E) Expression heatmap and unsupervised hierarchical clustering analysis of heme-TAM marker genes measured by quantitative reverse transcriptase PCR (RT-qPCR) in plug-invading cells after enrichment of F4/80+ cells. Each column represents data from 1 plug collected 7 days after s.c. injection (n = 8 RBC-heme plugs, n = 7 RBC-ghost plugs). (F) A score for the oxidative stress–related macrophages in the RBC plug was calculated based on differentially expressed genes (log2[fold change] 2, P 0.001, n = 114 genes). This score was mapped into the spatial transcriptome data of the MC38 tumor sections reported in Figure 1. The heatmap visualizes that macrophages with an oxidative stress–handling identity accumulate in the perinecrotic tumor microenvironment.
Figure 4
Figure 4. Heme-TAMs in 3D spheroid cancer cell cultures.
(A) Expression heatmap and unsupervised hierarchical clustering analysis of marker genes quantified by bulk RNA-Seq in control and heme-treated BMDMs cultured in 2D (normalized log2 counts). Each column represents macrophages from 1 mouse (n = 3). (B) EnrichR analysis of all significantly differentially expressed genes (log2[fold change] 0.5, P 0.001, n = 3). The gene ratio defines the overlap of the input genes and the term-associated genes, and the top 10 enriched terms are shown. Terms are ranked by their P value. (C) Results of a factorial experiment defining the synergistic effect of heme and MC38 cell culture supernatant on Arg1 mRNA expression in 2D BMDM cultures. Arg1 expression was measured by RT-qPCR. Color and size of the dots represent the normalized gene expression per sample (n = 4 BMDM cultures per condition). (D) Experimental workflow used to generate and analyze mixed-cell-type 3D spheroids containing MC38 tumor cells and BMDMs. (E) 3D reconstruction of a confocal microscopy image stack of a mixed-cell-type spheroid resulting from a 5-day culture of GFP-MC38 cells (green) and heme-TAM-tomato cells (red) in a microwell plate. Scale bar: 60 μm. (F) Results of a multiplexed scRNA-Seq experiment with mixed-cell-type spheroids containing MC38 cells and BMDMs that had been pretreated with heme, LPS, IFN-γ, or combinations thereof. The spheroids were collected for scRNA-Seq 24 hours after the 2 cell types were mixed and seeded on microwell plates. The UMAP is color-coded to indicate the BMDM pretreatment. (G) Cell-type assignment of the spheroid cells was performed, and macrophages were extracted for further analysis. (H) In PCA of spheroid macrophages, PC1 segregates the heme-pretreated BMDMs from those not pretreated with heme. (I) The contribution of individual genes to PC1 is expressed as loadings. Genes are ordered and color-coded by their PC1 loading. A high absolute value indicates that the gene strongly influences overall gene expression variance. The highest PC1 loading was found for Arg1. (J) Expression heatmaps of the top PCA drivers and selected heme-induced TAM marker genes.
Figure 5
Figure 5. Heme-TAMs support tumor cell growth, invasiveness, and metastasis.
(A) Spheroid GFP fluorescence (magenta) and annexin V (cyan). (B) Integrated fluorescence across the spheroid area. Data are mean ± 95% CI of 42 replicates. (C) Spheroids were grown in microwell plates for scRNA-Seq experiments and GFP fluorescence across the spheroid area was quantified for ≥3,000 spheroids per condition and used for cell density correction in F (gray, MC38; red, MC38+heme-TAMs) (ANOVA with Tukey-Kramer post-test corrected with P 0.001 for all comparisons, except MC38 day 8 vs. MC38 day 10, P = 0.99). (D) Multiplexed scRNA-Seq of MC38 tumor cell spheroids (only MC38) or mixed-cell-type spheroids (MC38 + heme-TAM) on days 4, 8, and 10 after formation. After macrophage exclusion, cell densities were scaled by the mean spheroid size before projecting on the UMAP. (E) Leiden clustering defined 3 clusters per experiment, a dominant functional annotation for each cluster was determined by GSEA. Dot plots depict the fraction of tumor cells within each functional state per time point. (F) GFP-MC38 spheroids (top) and mixed GFP-MC38+heme-TAM-tomato spheroids (bottom) were transferred from microwell plates to a flat glass-bottom plate on day 4 after spheroid formation and embedded into an extracellular matrix. Cell invasion was imaged 24 hours later. (G) Four days after formation, spheroids were embedded into an extracellular matrix (t = 0 hours), and cell invasion was measured by live-cell imaging every 4 hours. Top: Representative inverted bright-field images. Scale bar: 0.5 mm. Bottom: The invading cell front was automatically segmented and quantified over time. Data are mean ± 95% CI of 21 replicates analyzed within 1 representative experiment. (H) Spheroids were collected on day 5 after formation and injected i.v. into C57BL/6J mice. Lungs were collected 24 days after injection. t test. Scale bar: 5 mm.
Figure 6
Figure 6. Heme-TAMs resist tumoricidal transformation by IFN-γ.
(A) Integrated spheroid GFP fluorescence obtained by live-cell microscopy. Data are mean ± 95% CI of 10 replicates from 1 representative experiment. (B) Expression heatmap and clustering of differentially expressed genes (log2[fold change] 0.5, P 0.005, n = 3). Right: Normalized count data for Cxcl9, Cxcl10, and Cxcl11. Each point represents 1 replicate. (C) Spheroids identical to those in A were grown in microwell plates for scRNA-Seq and scanned with a fluorescence microscope on day 9. Violin plots depict GFP fluorescence integrated across the object area for ≥1,400 spheroids per condition (ANOVA with Tukey-Kramer post-test corrected with P 0.001 for each comparison). (D) scRNA-Seq workflow. (E) GSEA-defined functional attributes for the 3 tumor cell clusters. Dot plot visualizes the fraction of tumor cells within each functional state. (F) Tumor cell densities normalized by the mean integrated fluorescence of the input. Bubbles beneath the UMAPs depict the mean spheroid size. (G) Gene expression score intensities for GSEA categories. (H) Approximately 750 spheroids (GFP-MC38 cancer cells + BMDMs) were collected from microwell plates on day 4 after spheroid formation and injected i.v. into Rag2−/−γc−/− mice. Lungs were collected 20 days after injection. Paraffin sections of lung tissue visualize metastatic disease. Scale bar: 5 mm. GFP fluorescence of whole-lung fluorescence images (see Supplemental Figure 4E) was integrated across the imaged lung area and quantified for n = 3–4 animals per condition. Each dot represents 1 mouse (lung). ANOVA with Tukey-Kramer post-test corrected for multiple comparisons, IFN-γ vs. heme + IFN-γ P = 0.0028, heme + IFN-γ vs. control P = 0.0046, heme vs. IFN-γ P = 0.0030, heme vs. control P = 0.0051, control vs. IFN-γ P = 0.98, heme vs. heme + IFN-γ P = 0.97.
Figure 7
Figure 7. Heme-TAM transformation progresses via NRF2 signaling.
(A) Keap1- and Nrf2-KO mice generated BMDMs with locked NRF2-on and NRF2-off states, independent of heme exposure. (B) Factorial experiment defining the effect of heme treatment and MC38 cell culture supernatant on the expression of Arg1 mRNA measured by RT-qPCR in Nrf2-WT and Nrf2-KO BMDMs. Color and size of the dots indicate the normalized gene expression per sample (n = 4 per condition). The data demonstrate that NRF2 is required to leverage the synergistic effect of heme and tumor cell supernatant. (C) Live-cell microscopy analysis of spheroids of GFP-MC38 cancer cells mixed with Nrf2-KO and Nrf2-WT BMDMs that were untreated or pretreated with heme. Data represent the GFP fluorescence intensity integrated across the object area. Data are mean ± 95% CI of 15 replicates analyzed within 1 representative experiment. (D) Representative fluorescence images of spheroids. Scale bar: 0.5 mm. (E) Multiplexed scRNA-Seq experiment of untreated 2D cultured WT BMDMs, heme-treated WT BMDMs, and untreated Keap1-KO BMDMs. The UMAP visualizes that the interaction of genotype and treatment defines distinct gene expression patterns. The violin plots visualize the expression of canonical myeloid marker genes, NRF2-regulated genes, and heme metabolism genes as log10 (normalized count + 1) values. (F) PCA of the transcriptome data described in E. The genes defining PC1 and PC2 were analyzed for driver transcription factors by EnrichR using the TRRUST Transcription Factors 2019 data set. This analysis indicates that heme-treated BMDMs and Keap1-KO macrophages share activated NRF2 as a driver of their phenotype.
Figure 8
Figure 8. Active NRF2 in TAMs enhances tumor invasiveness and metastatic disease.
(A) Live-cell microscopy analysis of spheroids of GFP-MC38 cancer cells mixed with untreated WT BMDMs and untreated as well as heme-pretreated Keap1-KO BMDMs. Data represent the GFP fluorescence intensity integrated across the object area and demonstrate that Keap1 KO in macrophages mimics the procancerous effect of heme. Data are mean ± 95% CI of 25 replicates analyzed within 1 representative experiment. GFP fluorescence images of mixed spheroids containing untreated Keap1-WT BMDMs and untreated Keap1-KO BMDMs on days 3, 5, and 7 after spheroid formation. (B) Quantitative spheroid invasion assay. Four days after formation, spheroids were embedded into an extracellular matrix (t = 0 hours), and cell invasion was measured with a live-cell imaging system. The invading cell front was automatically segmented and quantified over time. Data are mean ± 95% CI of 20 replicates analyzed within 1 representative experiment. Right: Representative bright-field images of spheroids 16 hours after matrix embedding. Scale bar: 0.5 mm. For better visualization, the images were inverted. (C) To test the metastatic potential, approximately 750 spheroids per condition were collected from microwell plates at day 4 after spheroid formation and injected i.v. into Rag2−/−γc−/− mice. Lungs were collected 21 days after injection. Bright-field and GFP fluorescence whole-lung images were used to visualize metastases, which were extensive when NRF2 was active in macrophages. Scale bar: 5 mm. Whole-lung GFP fluorescence intensity was integrated across the lung image area. ANOVA with Tukey-Kramer post-test corrected for multiple comparisons.
Figure 9
Figure 9. NRF2 signaling in hematopoietic cells promotes resistance to immunotherapy.
(A) Experimental workflow of Matrigel plug experiments. Macrophages were enriched using F4/80 magnetic beads. (B) Relative mRNA expression of Hmox1, Cxcl9, and Cxcl10 in macrophages. Each dot represents 1 plug (n = 8–11); ANOVA with Tukey-Kramer post-test corrected for multiple comparisons. (C) Identical experiments in conditional Nrf2-WT and -KO mice. (D) Experimental workflow of MC38 tumor cell experiments. (E) Top: Bright-field and GFP fluorescence images visualizing MC38 tumors in situ. Scale bar: 5 mm. Bottom: Tumor sections. Scale bar: 2 mm. (F) GFP fluorescence intensity integrated across the tumor area. Each dot represents 1 tumor grown on the right and left flank of a mouse; color indicates mouse of origin (n = 12); Wilcoxon’s test. (G) Live-cell microscopy of spheroids of GFP-MC38 cells mixed with Nrf2-KO and Nrf2-WT BMDMs that were untreated or pretreated with heme with or without cross-linked anti-CD40 antibody. Data represent GFP fluorescence intensity integrated across object area. Data are mean ± 95% CI of 15 replicates analyzed within 1 representative experiment. (H) Spheroids were collected on day 4 after formation and approximately 750 spheroids were injected i.v. per mouse. Lungs were collected after 23 days. Metastatic foci were manually counted on GFP fluorescence whole-lung images. Each dot represents the number of metastatic lesions in 1 mouse (n = 4–6). Wilcoxon’s test was used to test for the anti-CD40 antibody effect in the 3 experiments. (I) MC38 tumor cells were injected s.c. into conditional Nrf2-WT or -KO mice. On day 7, mice were treated with 2 sequential doses of anti-CD40 antibodies, and tumors were imaged 2 days later. Each dot represents 1 tumor (integrated GFP fluorescence intensity across the tumor area, n = 6); Wilcoxon’s test.

References

    1. Pittet MJ, et al. Clinical relevance of tumour-associated macrophages. Nat Rev Clin Oncol. 2022;19(6):402–421. doi: 10.1038/s41571-022-00620-6. - DOI - PubMed
    1. Sica A, Mantovani A. Macrophage plasticity and polarization: in vivo veritas. J Clin Invest. 2012;122(3):787–795. doi: 10.1172/JCI59643. - DOI - PMC - PubMed
    1. Salmon H, et al. Host tissue determinants of tumour immunity. Nat Rev Cancer. 2019;19(4):215–227. doi: 10.1038/s41568-019-0125-9. - DOI - PMC - PubMed
    1. Lazarov T, et al. Physiology and diseases of tissue-resident macrophages. Nature. 2023;618(7966):698–707. doi: 10.1038/s41586-023-06002-x. - DOI - PMC - PubMed
    1. Molgora M, Colonna M. Turning enemies into allies—reprogramming tumor-associated macrophages for cancer therapy. Med. 2021;2(6):666–681. doi: 10.1016/j.medj.2021.05.001. - DOI - PMC - PubMed

Publication types