. 2023 Dec 26;42(12):113535.
doi: 10.1016/j.celrep.2023.113535. Epub 2023 Dec 4.

Epinephrine inhibits PI3Kα via the Hippo kinases

Affiliations

Epinephrine inhibits PI3Kα via the Hippo kinases

Ting-Yu Lin et al. Cell Rep. .

Abstract

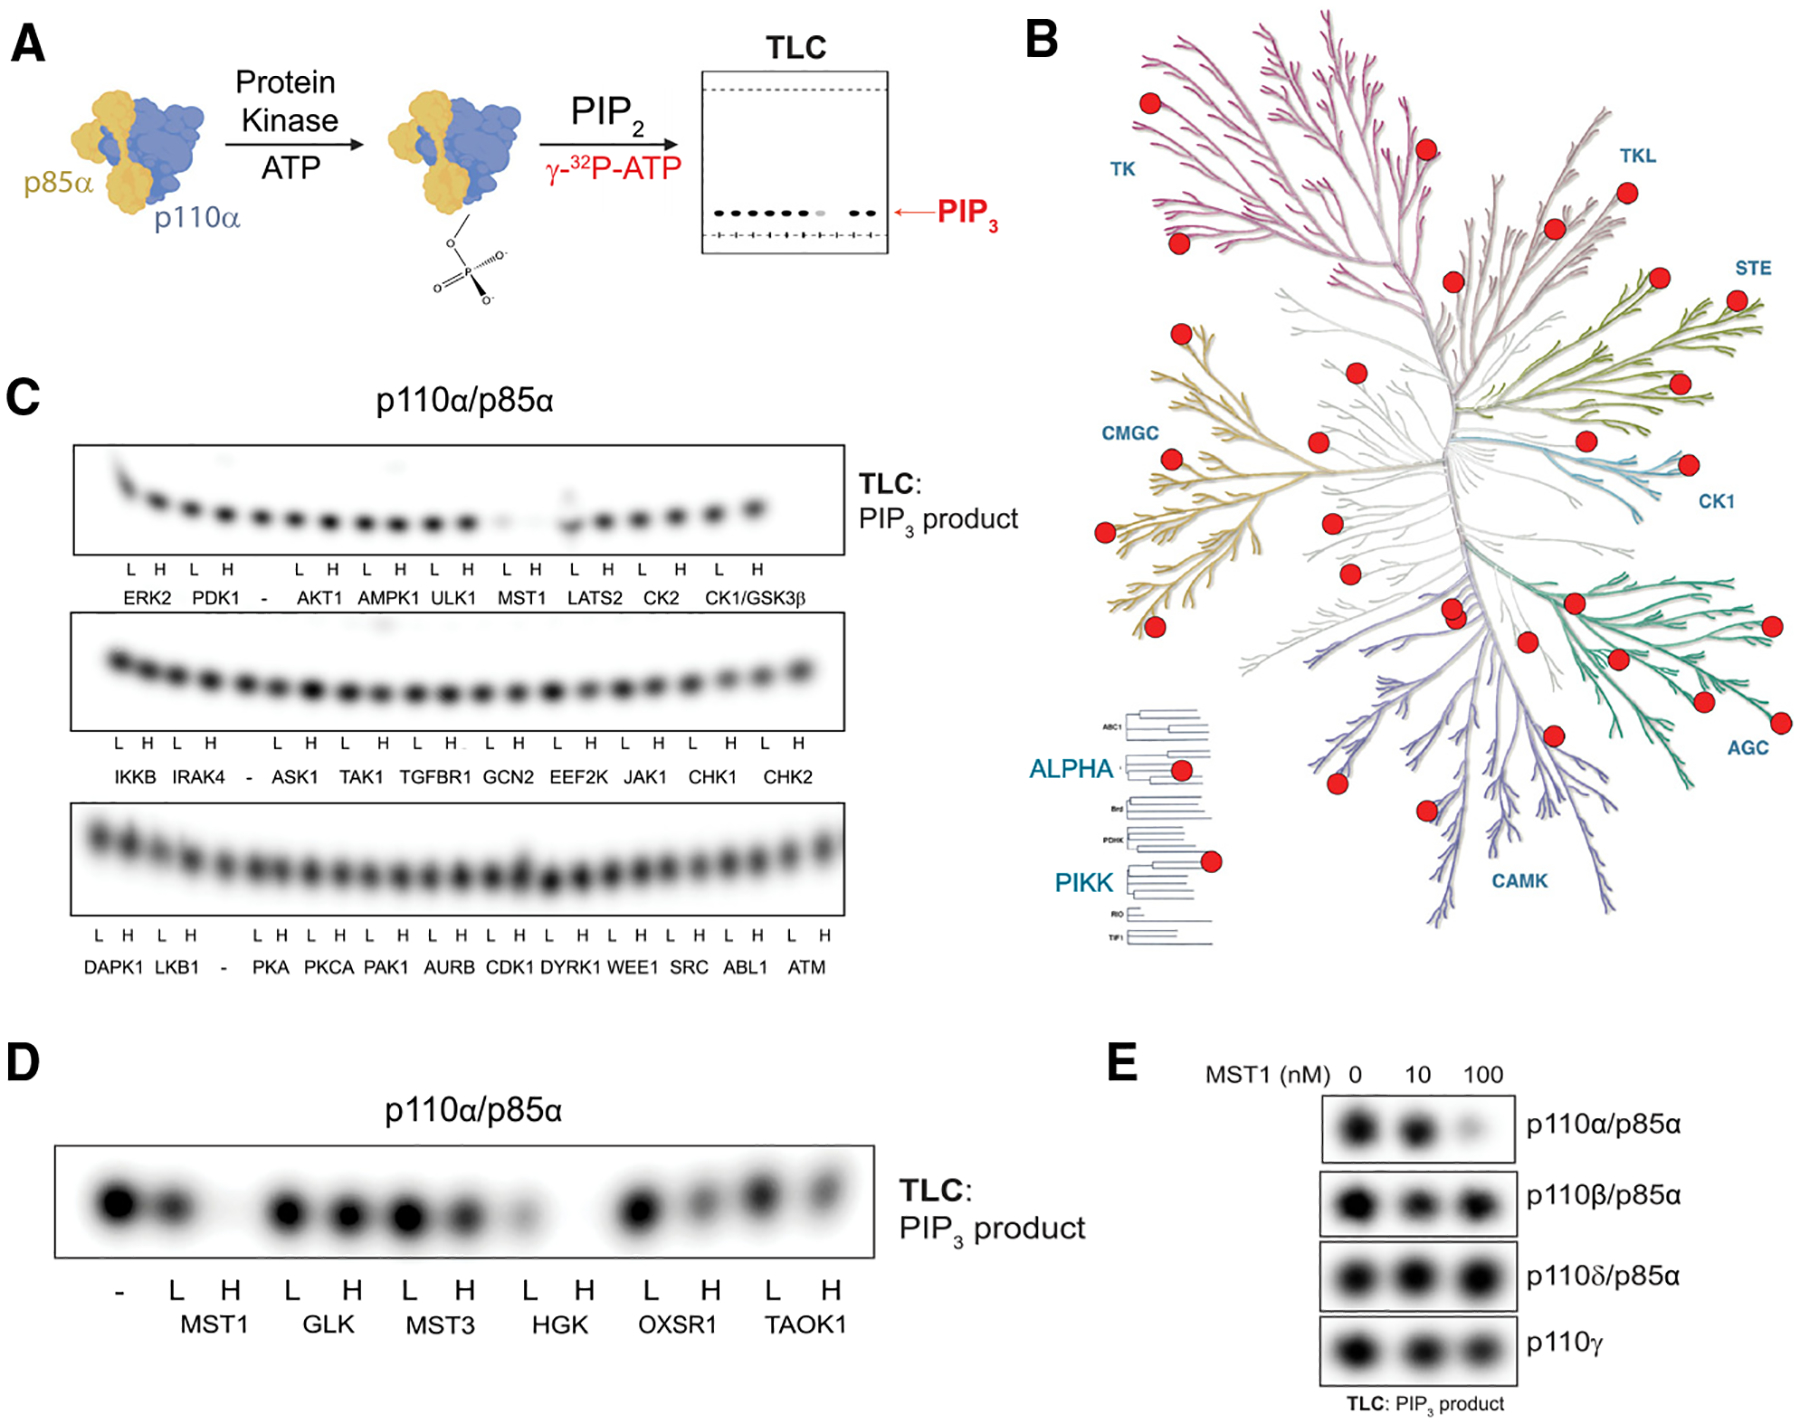
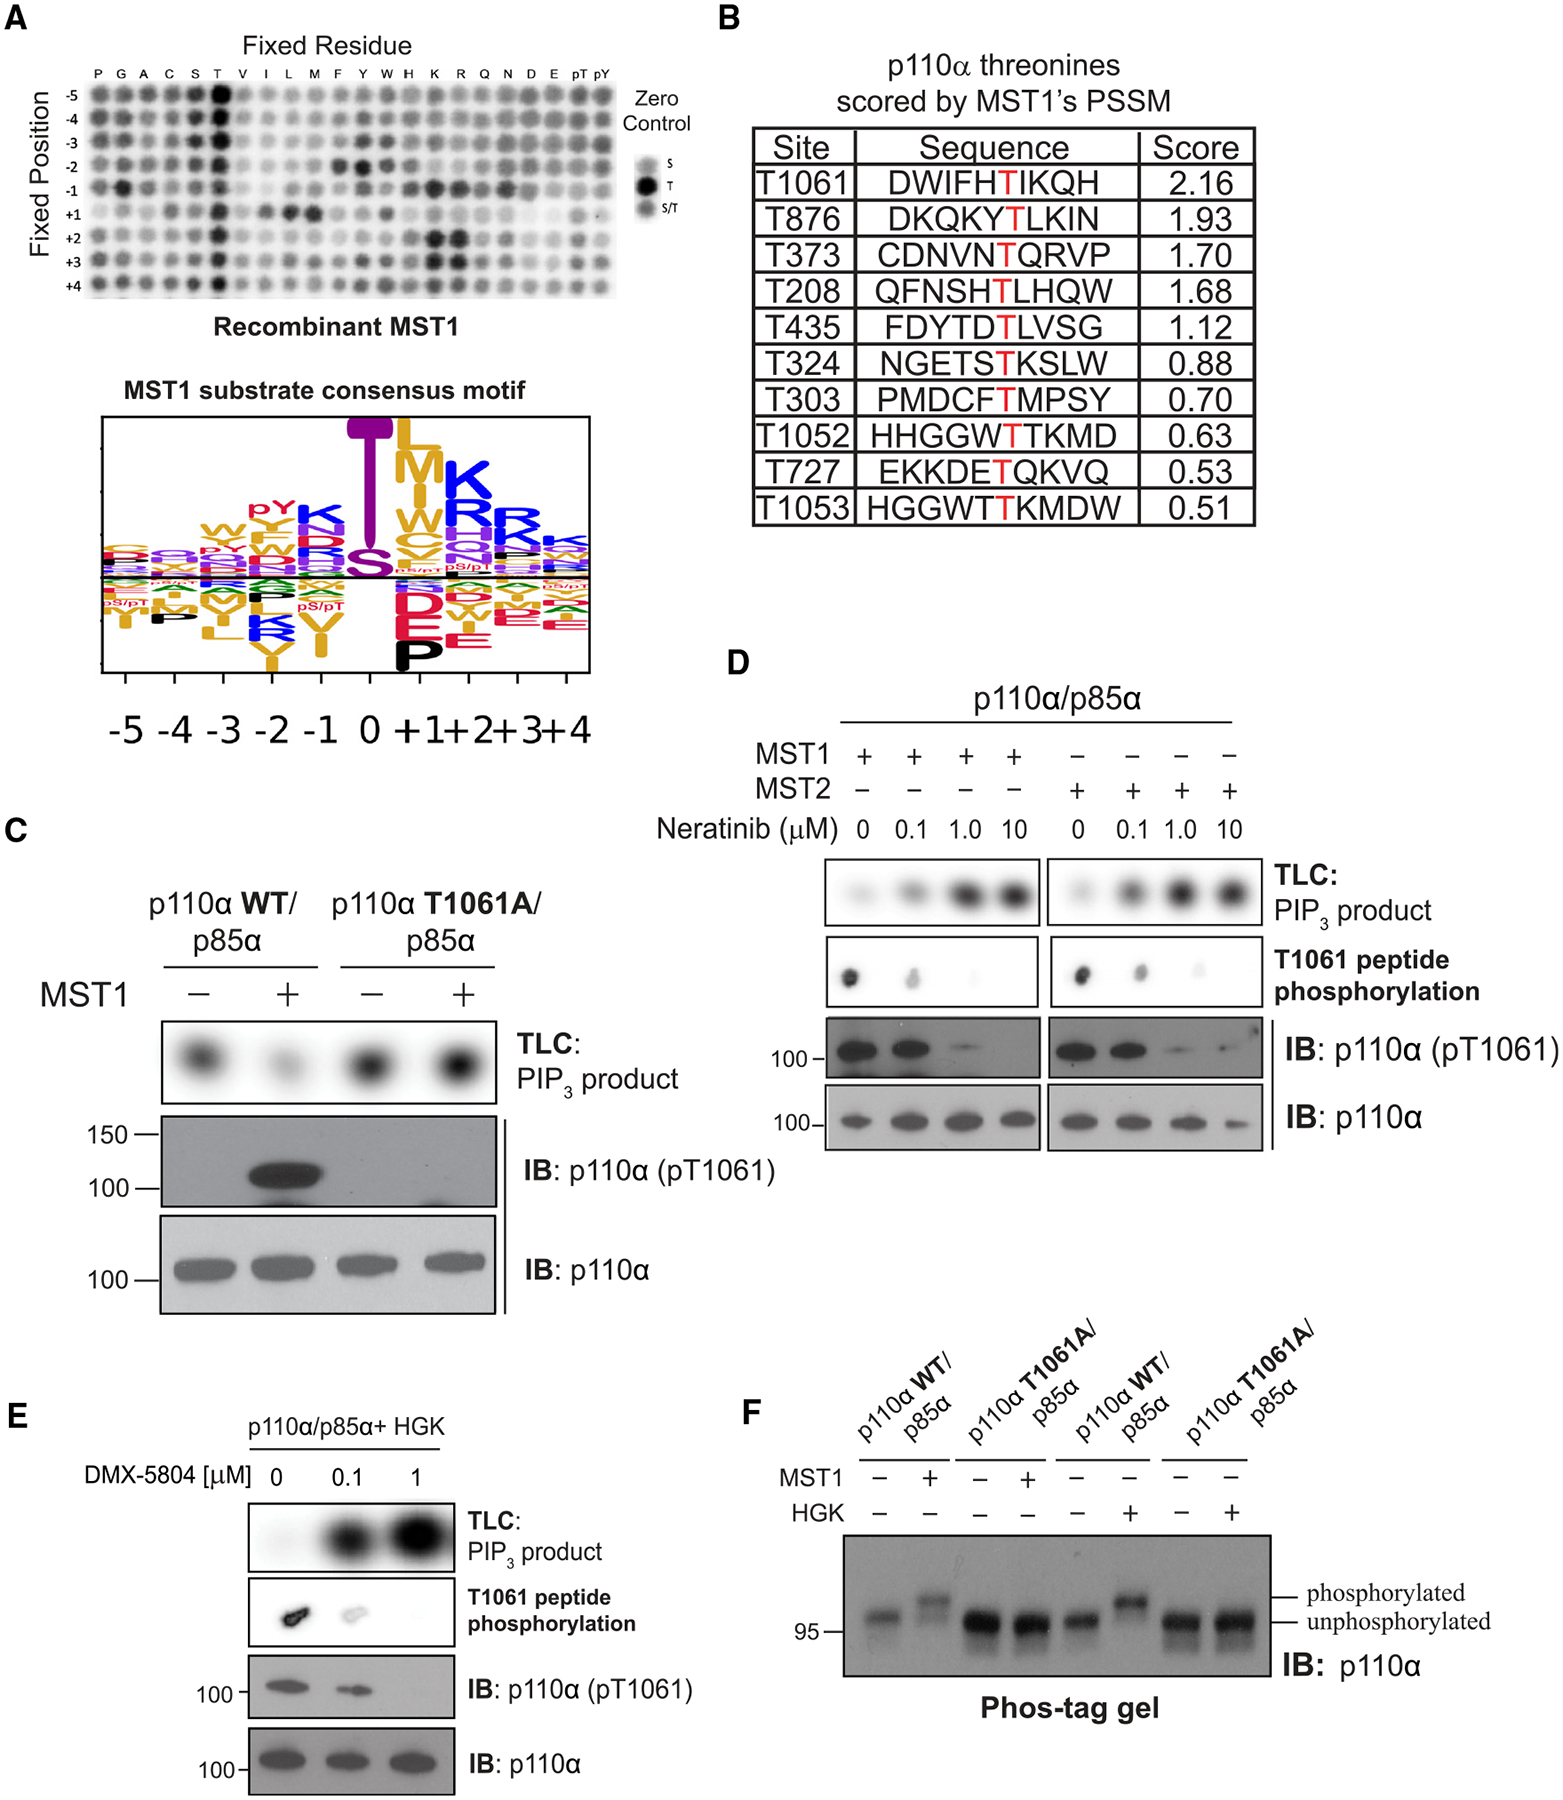
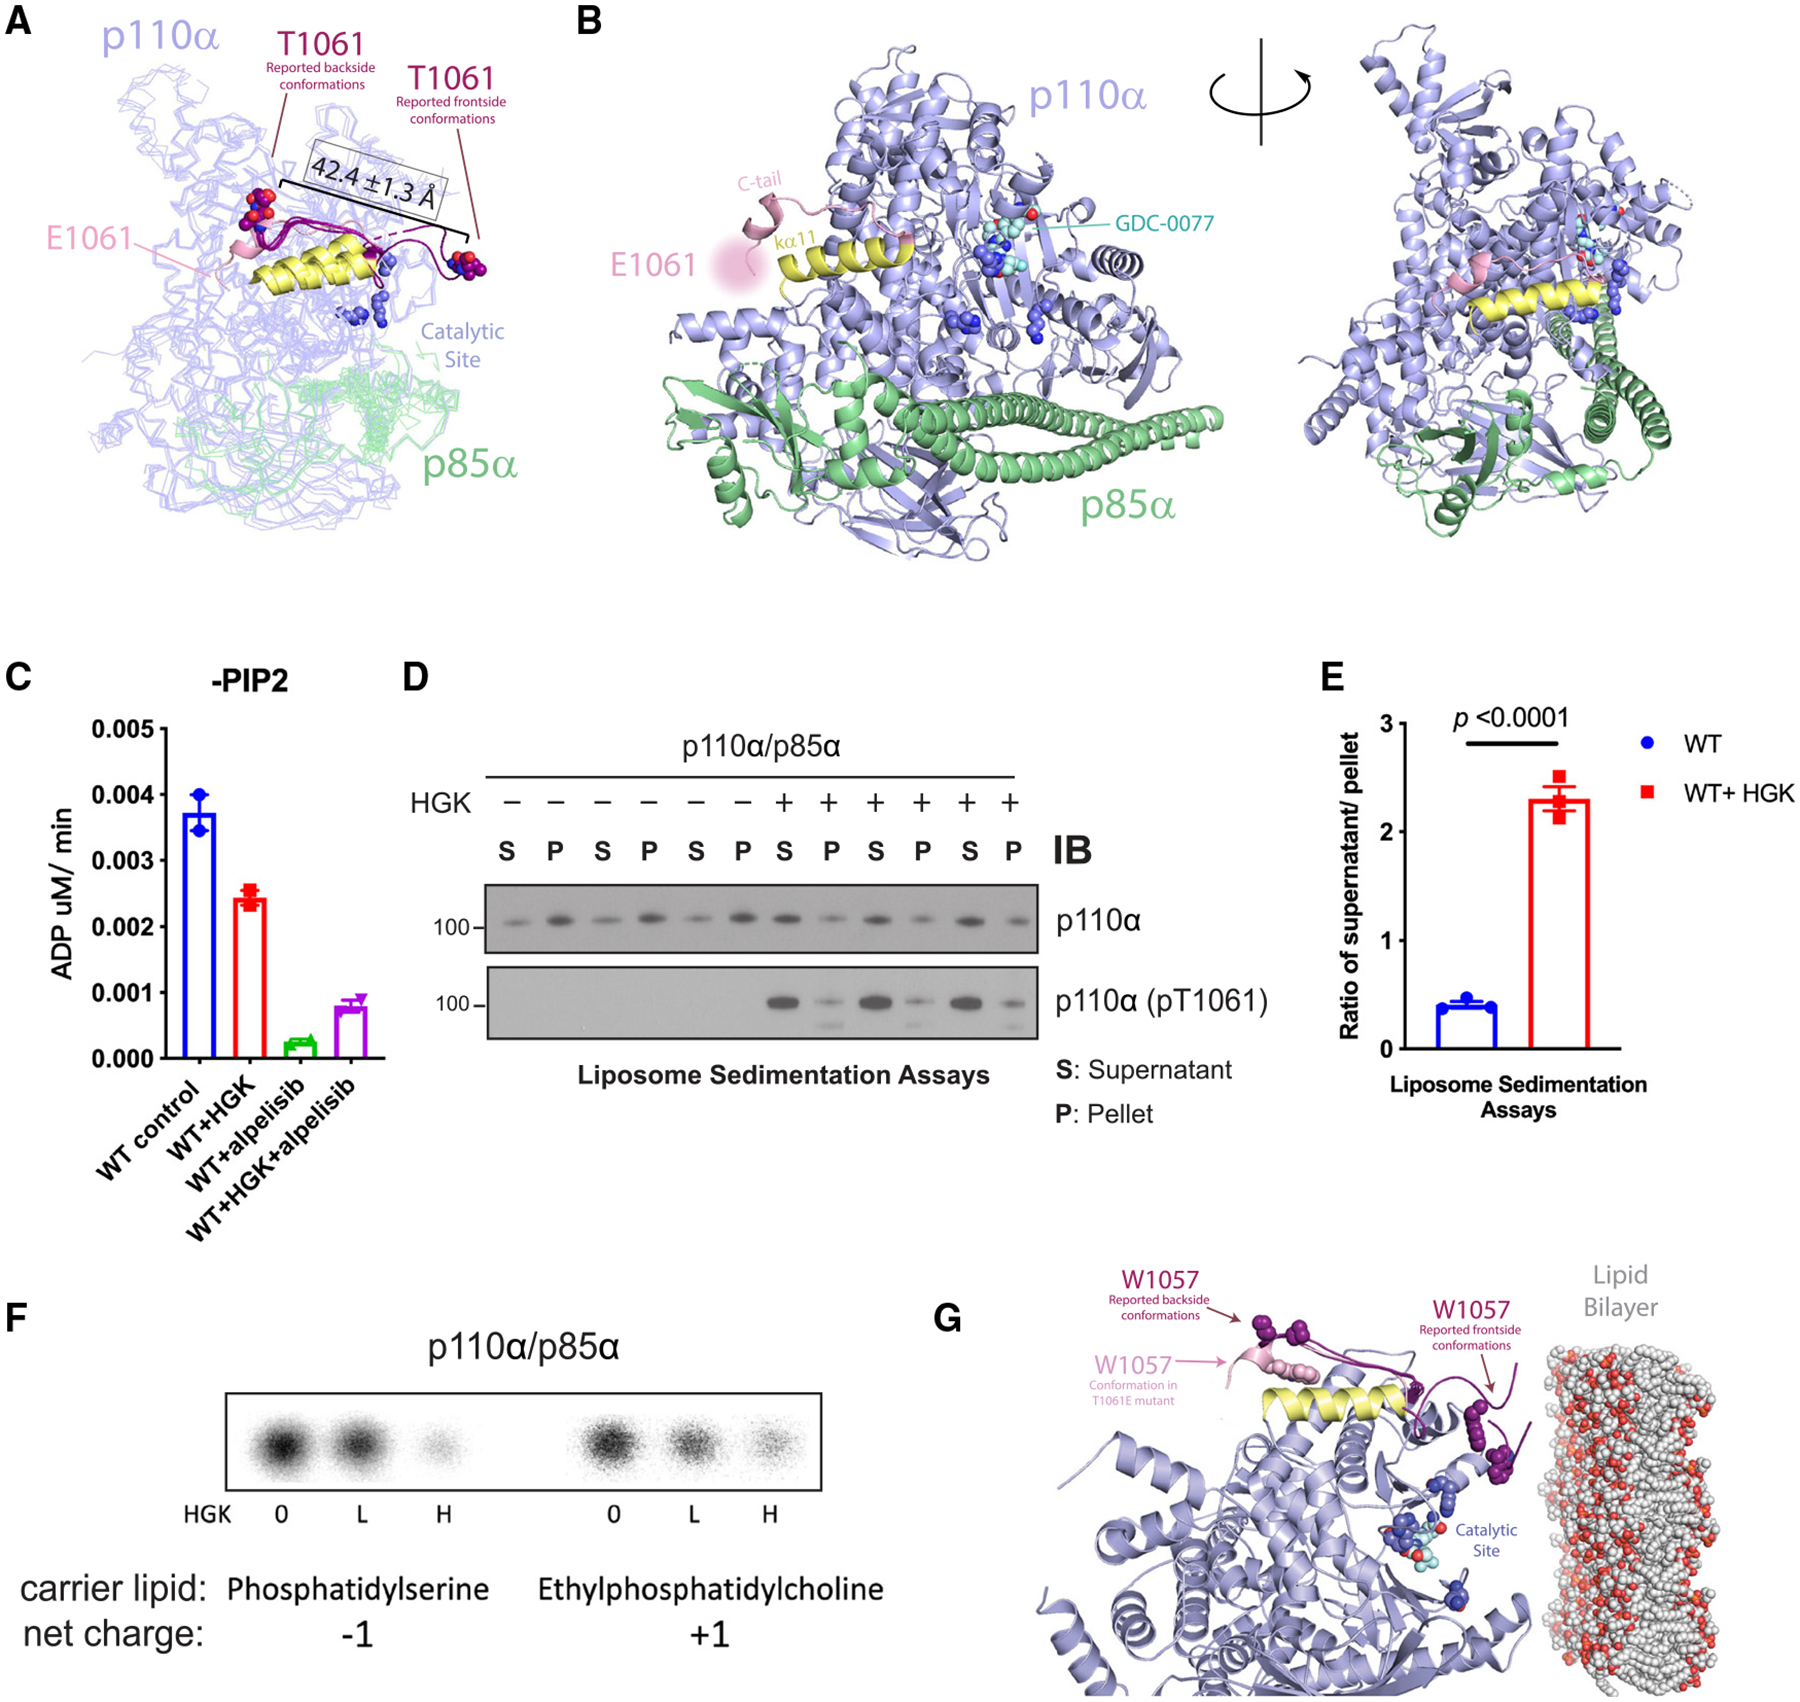
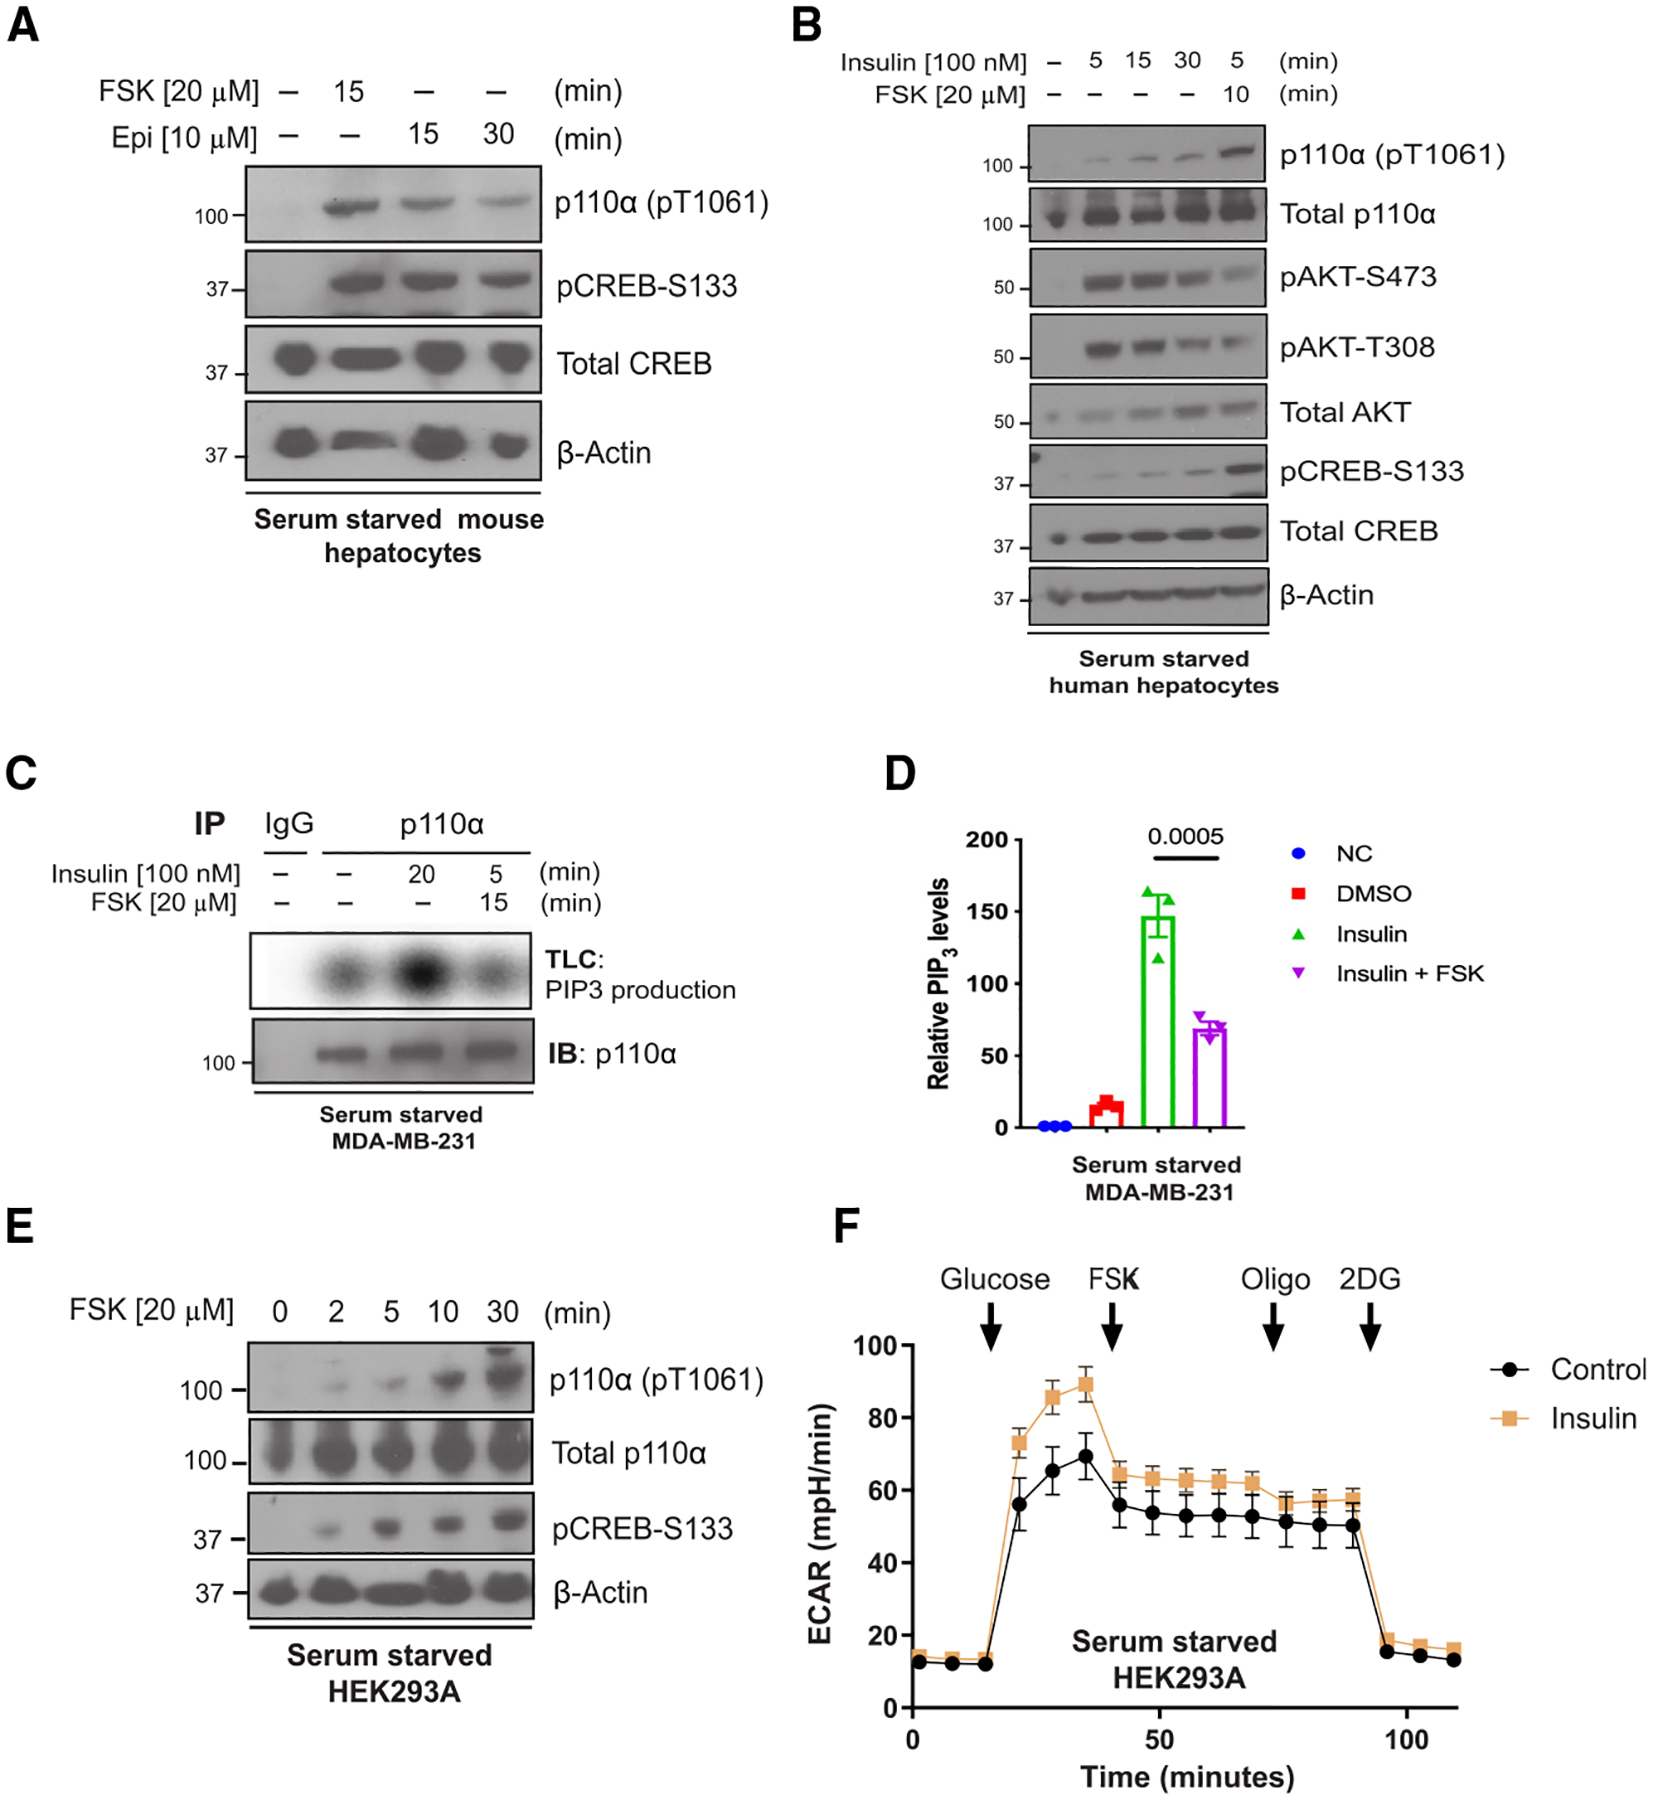
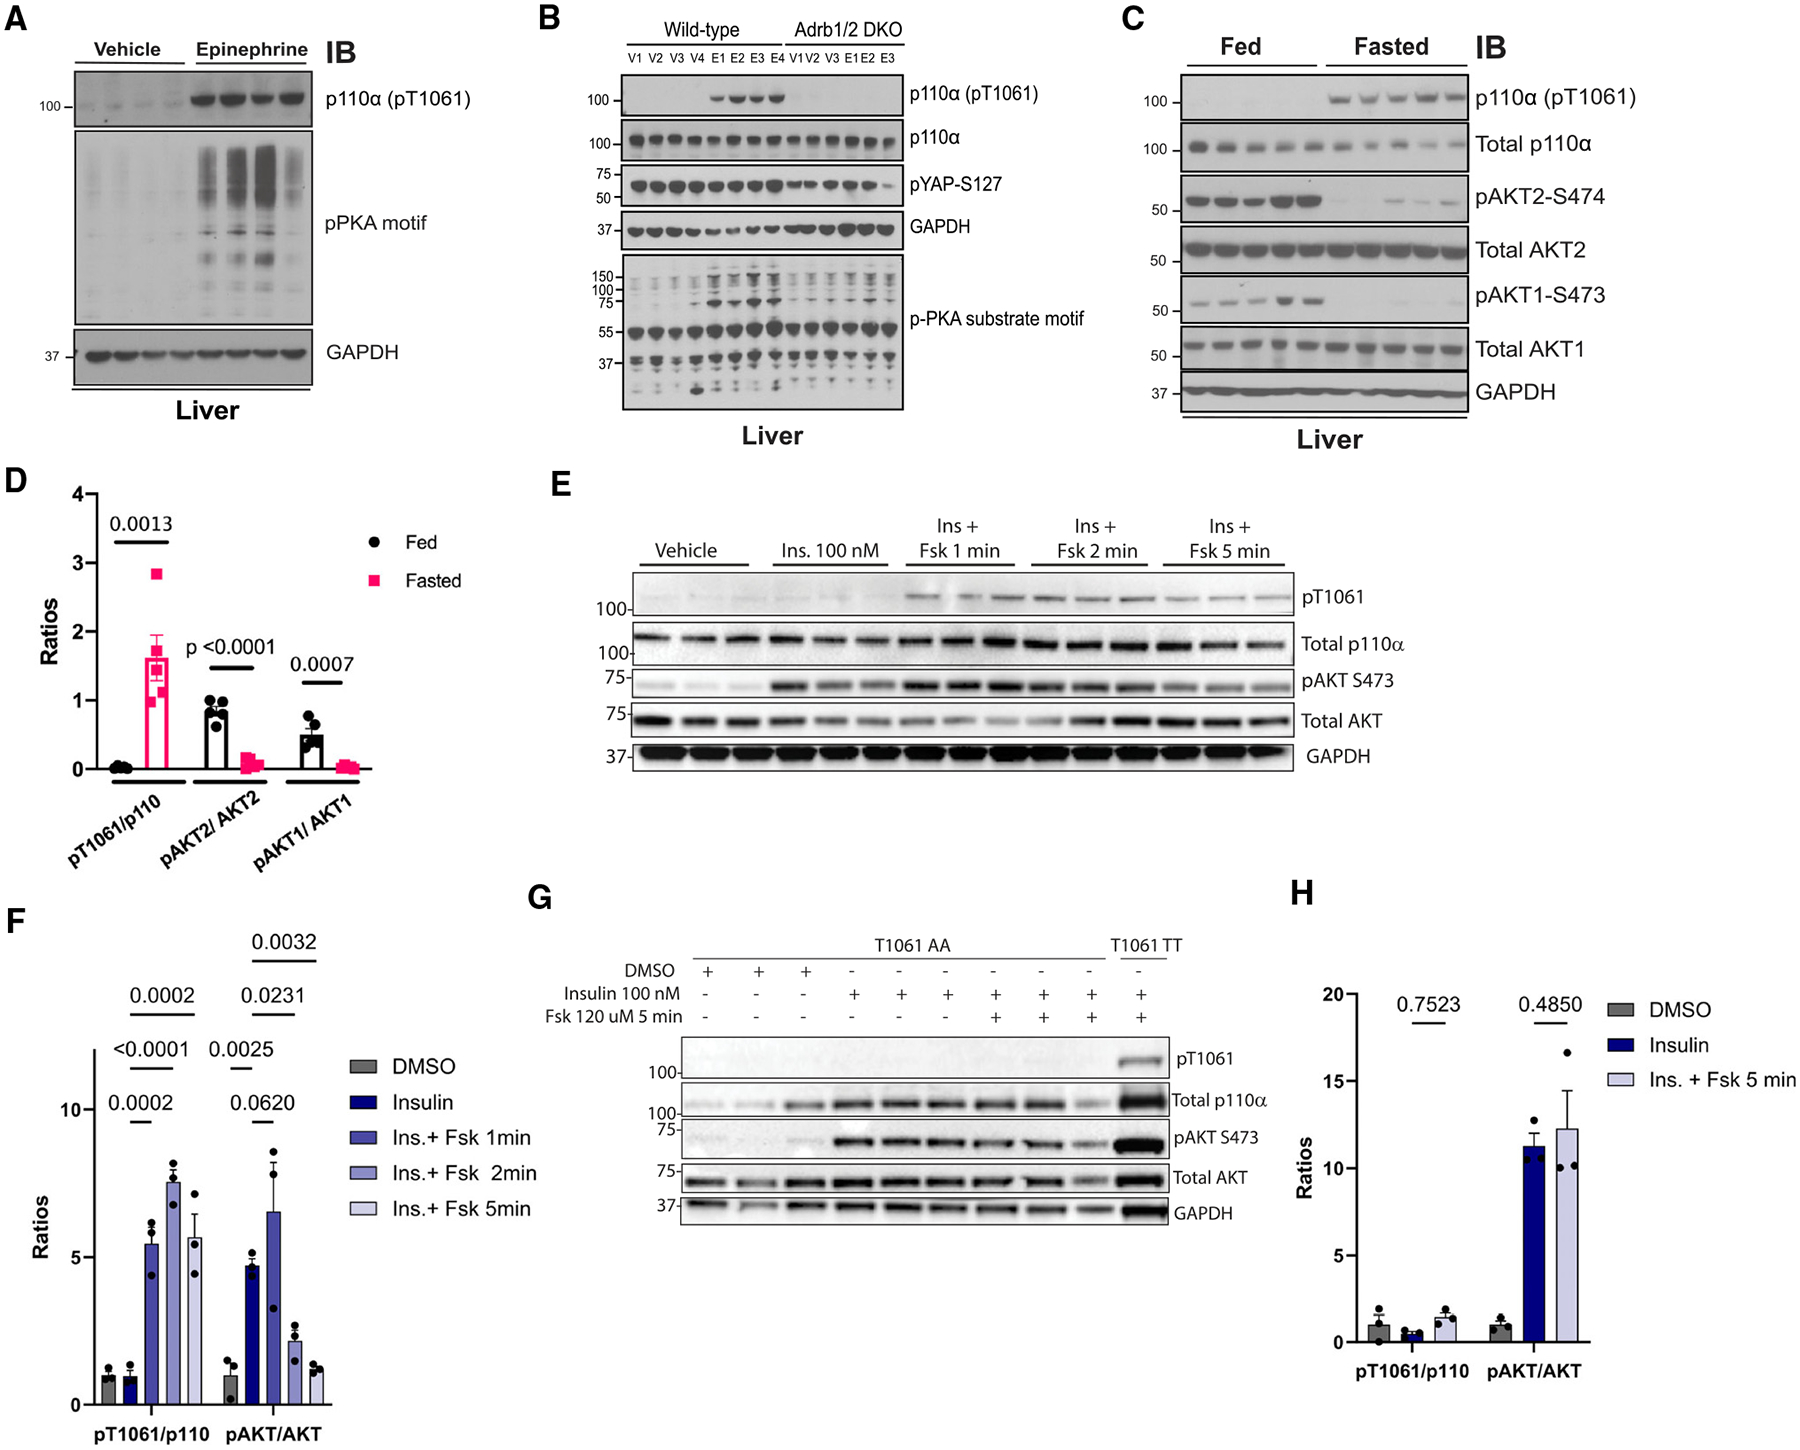
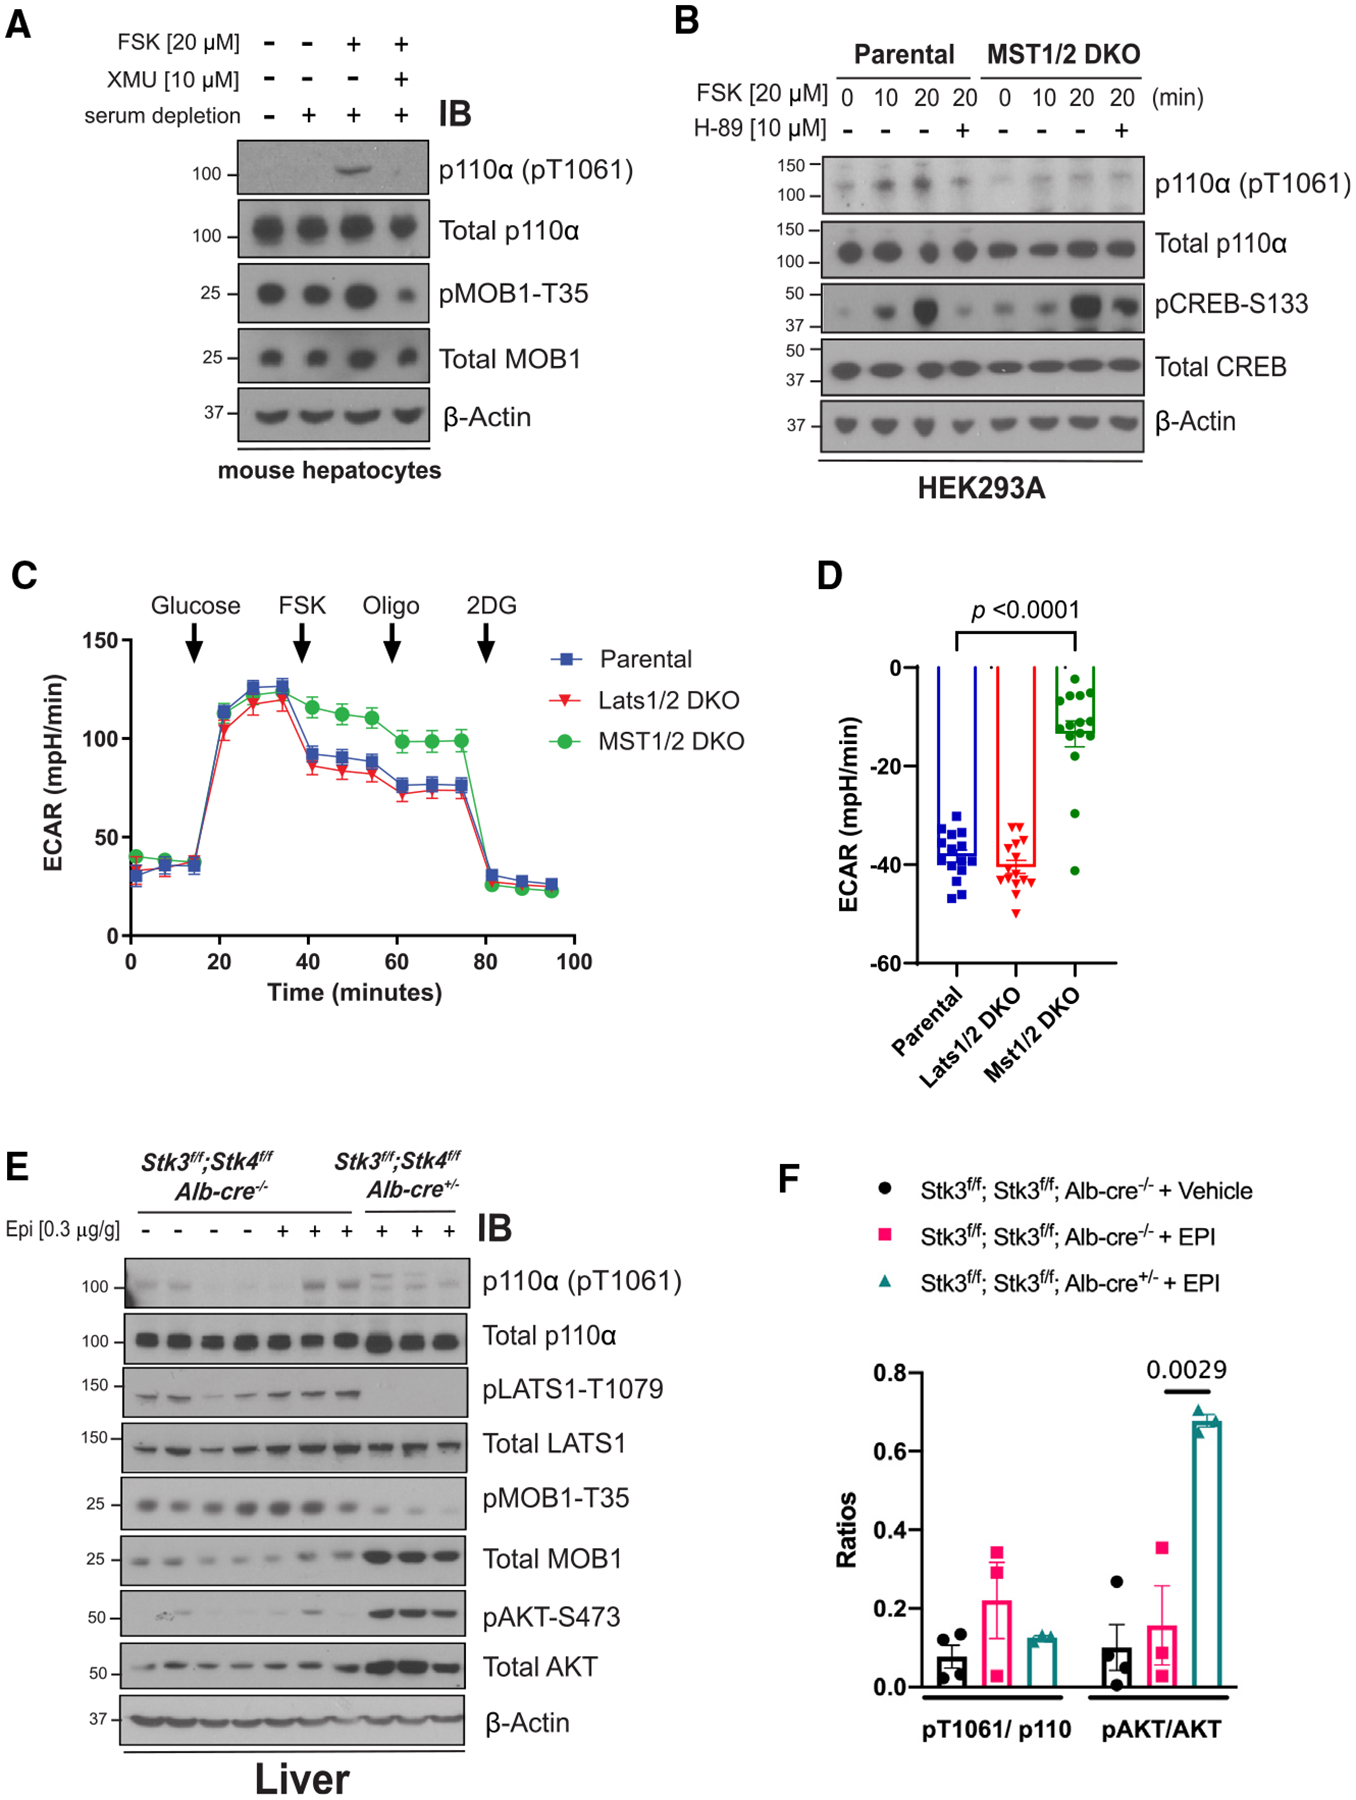
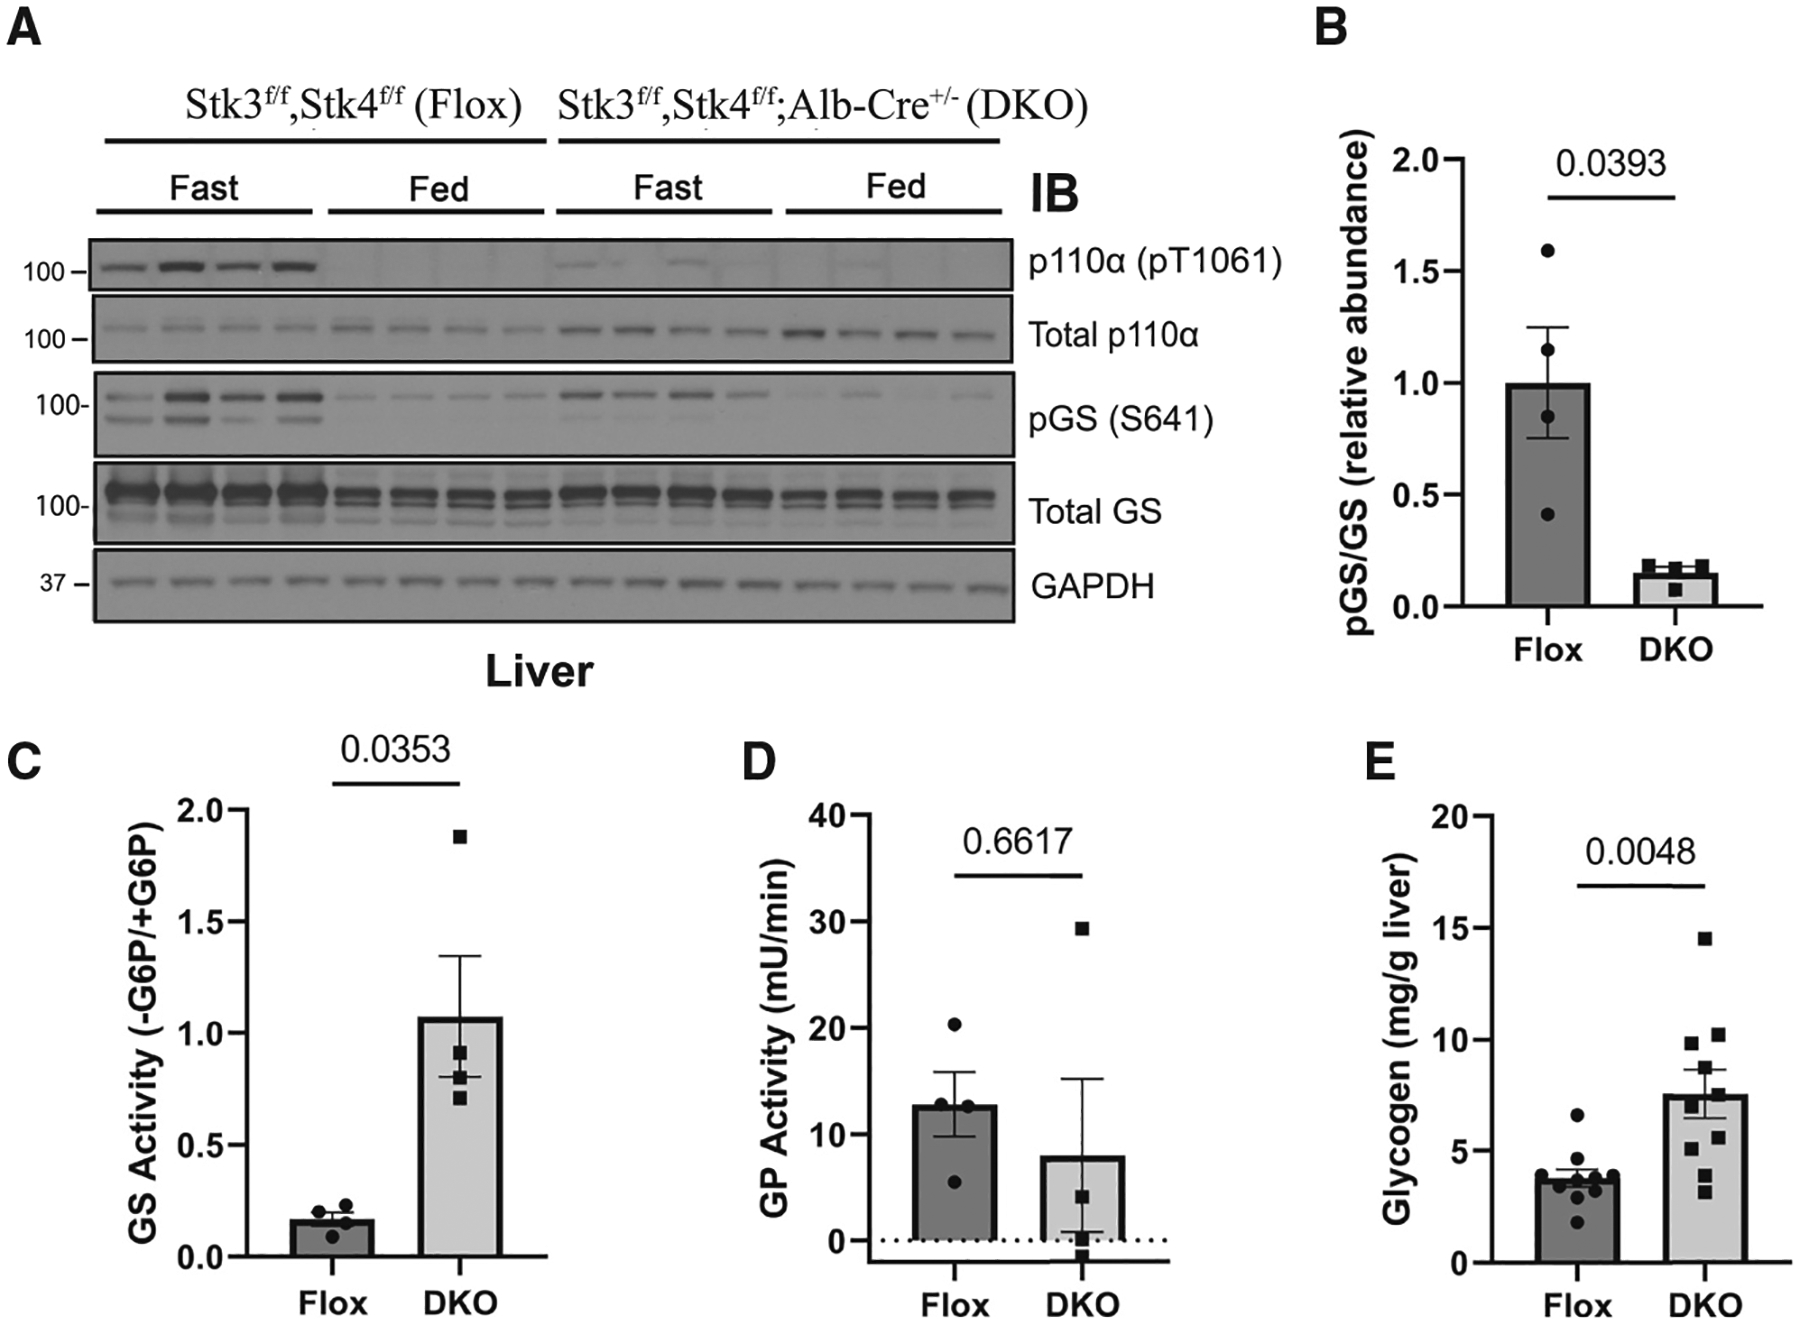
The phosphoinositide 3-kinase p110α is an essential mediator of insulin signaling and glucose homeostasis. We interrogated the human serine, threonine, and tyrosine kinome to search for novel regulators of p110α and found that the Hippo kinases phosphorylate p110α at T1061, which inhibits its activity. This inhibitory state corresponds to a conformational change of a membrane-binding domain on p110α, which impairs its ability to engage membranes. In human primary hepatocytes, cancer cell lines, and rodent tissues, activation of the Hippo kinases MST1/2 using forskolin or epinephrine is associated with phosphorylation of T1061 and inhibition of p110α, impairment of downstream insulin signaling, and suppression of glycolysis and glycogen synthesis. These changes are abrogated when MST1/2 are genetically deleted or inhibited with small molecules or if the T1061 is mutated to alanine. Our study defines an inhibitory pathway of PI3K signaling and a link between epinephrine and insulin signaling.

Keywords: CP: Metabolism; CP: Molecular biology; Hippo kinases; PI3K signaling; epinephrine signaling; glucose metabolism; glycogen metabolism; insulin sensitivity; liver.


Conflict of interest statement

Declaration of interests N.V. reports consultant and advisory board activities for Novartis, Petra Pharmaceuticals, Reactive Biosciences, and Magnet Biomedicine. E.A.K. is a shareholder of Eli Lilly and Company, and E.A.K. and K.K. are employees of Loxo Oncology at Lilly. L.C.C. is a founder and member of the board of directors of Agios Pharmaceuticals; is a founder and receives research support from Petra Pharmaceuticals; has equity in and consults for Cell Signaling Technologies, Volastra, Larkspur, and 1 Base Pharmaceuticals; and consults for Loxo-Lilly. J.L.J. has received consulting fees from Scorpion Therapeutics and Volastra Therapeutics. J.L.J. reports consultant activities for Scorpion Therapeutics and Volastra Therapeutics. M.D.G. reports personal fees from Novartis AG, Pfizer, Inc., and Scorpion Therapeutics. L.C.C., B.D.H., and M.D.G. are inventors on patents for Combination Therapy for PI3K-associated Disease or Disorder and The Identification of Therapeutic Interventions to Improve Response to PI3K Inhibitors for Cancer Treatment. B.D.H., L.C.C., and M.D.G. are co-founders and shareholders in Faeth Therapeutics. R.E.S. is on the sponsored advisory board for Miromatrix, Inc., and Lime Therapeutics and is a consultant and speaker for Alnylam, Inc. T.M.Y. is a stockholder and on the board of directors of DESTROKE, Inc., an early-stage start-up developing mobile technology for automated clinical stroke detection.

Figures

Figure 1.
Figure 1.. Kinase screen identifies GCK kinases as negative regulators of PI3Kα activity
(A) Experimental schema. (B) Dendrogram of the human protein kinome that highlights the kinases selected for our screen. (C) Thin-layer chromatography (TLC)-autoradiography of [32P]PIP3 produced by recombinant PI3Kα complexes (p110α/p85α, 500 nM) after incubation with the indicated recombinant protein kinases at 10 (L [low]) or 100 nM (H [high]) concentrations or with enzyme storage buffer (–). (D) PIP2 kinase assays with PI3Kα after incubation with subset of the GCK family, performed as described in (C). (E) PIP2 kinase assays with the class I PI3K isoforms (PI3Kα, PI3Kβ, PI3Kγ, and PI3Kδ, 500 nM) after incubation with MST1. (D) and (E) are representative of two independent replicates.
Figure 2.
Figure 2.. MST1/2 and HGK inhibit catalytic activity of p110α through phosphorylation at T1061
(A) (Top) Peptide phosphorylation by MST1 to characterize its substrate consensus motif. Positional scanning peptide arrays were utilized, where 22 residues (20 amino acids +2 PTM residues) were scanned across nine neighboring positions of the phospho-acceptor. The zero controls (right inset), consisting of serine only, threonine only, or a 1:1 mixture of both, were examined as phospho-acceptors. Phosphorylation was measured by autoradiography. (Bottom) Sequence logo of the substrate consensus motif of MST1 as determined on top. Letter height is proportional to favorability of corresponding amino acid. (B) p110α’s threonine residues scored by MST1’s position-specific scoring matrix obtained from (A). (C) Incubation of p110α(WT)/p85α and p110α(T1061A)/p85α with MST1. Top: autoradiography of [32P]PIP3 production by p110α. Bottom: immunoblots of total p110α and pT1061 p110α. (D) Incubation of MST1 or MST2 with increasing concentrations of neratinib, followed by incubation with PI3Kα. Top: autoradiography of [32P]PIP3 production by p110α. Second from top: autoradiography of T1061-modeled peptide substrate peptide phosphorylation by MST1 or MST2. Bottom: immunoblots of total p110α and pT1061. (E) Repeat of (D) using HGK and its specific inhibitor, DMX-5804. (F) Immunoblot of p110α (WT and T1061A) on Phos-tag gel after treatment with MST1 or HGK. (A)–(F) are representative of two independent replicates.
Figure 3.
Figure 3.. Phosphorylation at T1061 decreases p110α’s association with membranes
(A) Overlay of the crystal structure of p110α (T1061E) with six reported p110α (WT) structures where threonine 1061 was resolved. C-tails from frontside conformations (PDB: 4A55 and 5DXH) and backside conformations (PDB: 4JPS, 4AWF, 4ZOP, and 5FI4) of reported structures are shown in purple. E1061’s approximate location is indicated. Residues 1032–1048, constituting helix ka11, are displayed in yellow. (B) Catalytic residue side chains K776, H917, and H93635 are displayed as dark blue spheres. (C) ADP-Glo measurements of ATPase activity of PI3Kα ± HGK and ± 1 μM alpelisib. (D) Liposome sedimentation assays of PI3Kα ± HGK, shown as immunoblots of p110α or p110α (pT1061) recovered from membrane-enriched pellet (P) and supernatant (S). (E) Quantification of densitometries from (D) as ratios of p110α or pT1061 recovery from supernatant over pellet. Data are represented as means ± SEMs. Significance was calculated using Student’s t test (N = 3). (F) Activity assays of PI3Kα on PI in anionic and cationic liposomes after incubation with HGK. [32P]PIP3 products were resolved by TLC and measured by autoradiography. (G) Overlay of p110α (T1061E)’s crystal structure (C-tail in pink) with the 6 reported p110α(WT) structures (in purple, C-tails shown only) selected in Figure 2C. The coloring scheme corresponds to Figure 2C. W1057 side chains are represented as spheres. Catalytic site is indicated by residues K776, H917, and H936 (dark blue) and bound GDC-0077 (teal), shown as spheres. The phospholipid membrane model was obtained from RCSB PDB (PDB: 2MLR). (F) is representative of two independent replicates.
Figure 4.
Figure 4.. Forskolin and epinephrine exposure phosphorylate and inhibit p110α in cells
(A) Immunoblot for the indicated proteins using lysates from primary mouse hepatocytes that were serum starved 12 h before stimulation with forskolin (FSK; 20 μM) for 15 min or epinephrine (Epi, 10 μM) for 15 and 30 min. (B) Immunoblot for the indicated proteins using lysates from primary human hepatocytes that were serum starved for 12 h and treated with insulin (100 nM) for different time points (0, 5, 15, or 30 min) or insulin followed by FSK (20 μM) for 10 min. (C) Top: radioautograph of a TLC separation demonstrating PIP3 production of endogenous p110α that was immunoprecipitated from serum-starved MDA-MB-231 cells treated with vehicle, insulin (100 nM), or insulin plus FSK (20 μM) for 15 min. Bottom: Corresponding immunoblot for p110α using the same immunoprecipitate lysate. (D) Quantification of the radioautograph from (C) averaged over three independent experiments. Means ± SEM. Comparisons made using ANOVA with Tukey’s multiple comparisons post-test (N = 3). (E) Immunoblot for the indicated proteins using lysates from HEK293A cells that were serum starved for 2 h before being stimulated with FSK 20 μM for 0, 2, 5, 10, and 30 min. (F) The extracellular acidification rate (ECAR) was monitored in serum-starved HEK293A cells with or without insulin (0.1 mM] pre-treatment for 1 h. Arrows indicate injection of glucose (10 mM), FSK (20 μM), oligomycin (Oligo; 1 μM), and 2-deoxy-D-glucose (2DG; 50 mM). Means ± SEM, N = 19 wells. Results are representative of 3 independent experiments.
Figure 5.
Figure 5.. Epi exposure induces phosphorylation and inhibition of p110α in the liver
(A) Immunoblot for the indicated proteins using lysates from livers taken from WT mice that were injected with vehicle (normal saline) or Epi (0.3 μg/g) for 10 min (n = 4). (B) Immunoblot for the indicated proteins using lysates from livers taken from WT and β1/β2 double-knockout mice (Adrb1/2 DKO) treated with vehicle (V; saline) or Epi (E) via i.p. injection for 10 min. (C) Immunoblot for the indicated proteins using lysates from liver taken from WT mice that were fasted for 18 h (Fasted) or fasted and then exposed for food for 4 h (Fed) (n = 5). (D) Quantification of the ratios of pT1061 to total p110α, pAKT2 to total AKT2, and pAKT1 to total AKT1 using band intensity from (C). N = 5. Comparisons made via ANOVA with Dunnett’s post-test. (E) Immunoblot for the indicated proteins using lysates from WT mouse primary hepatocytes exposed to vehicle (DMSO), insulin (Ins.; 100 nM), or insulin plus Fsk for the indicated times. (F) Quantification of the ratios of pT1061 to total p110α and pAKT to total AKT using band intensity from (E). N = 3. Comparisons made via ANOVA with Dunnett’s post-test comparing to insulin group. (G) Immunoblot for the indicated proteins using lysates from mouse primary hepatocytes isolated from Pik3caT1061A/T1061A mice (T1061 AA, N = 3) or WT littermates (T1061 TT, N = 1) exposed to insulin and Fsk for the indicated times. (H) Quantification of the ratios of pT1061 to total p110α and pAKT to total AKT using band intensity from (G). N = 3. Data are presented as mean ± SEM. Comparisons made via ANOVA with Dunnett’s post-test comparing to insulin group.
Figure 6.
Figure 6.. Loss of MST1/2 activity in cells and liver reduces p110α phosphorylation
(A) Immunoblot for the indicated proteins using lysates from serum starved primary mouse hepatocytes isolated from WT mice that were stimulated with vehicle (DMSO), FSK (20 μM), or FSK and the MST1/2 inhibitor XMU (10 μM). (B) Immunoblot for the indicated proteins using lysates from HEK293A parental cells or a line with CRISPR deletion of MST1 and MST2 (MST1/2 DKO) that were serum starved for 2 h and pre-treated with vehicle (DMSO) or the PKA inhibitor H-89 (10 μM) for 1 h before stimulating with FSK (20 μM) for 10 or 20 min. (C) The ECAR was monitored in HEK293A parental, MST1/2 DKO, and Last1DKO cells for 1 h. Arrows indicate injection of glucose (10 mM), FSK (20 μM), Oligo (1 μM), and 2DG (50 mM). N = 15 wells. Results are representative of 3 independent experiments. (D) The suppression (%) of ECAR following the addition of FSK (20 μM) using data from (C). N = 15. (E) Immunoblot for the indicated proteins using lysates from livers taken from animals (Stk3f/f;Stk4f/f, Alb-Cre−/− and Stk3f/f;Stk4f/f, Alb-Cre+/−) that were injected with vehicle (normal saline) or Epi (0.3 μg/g). (F) Quantification of the ratios of pT1061 to total p110α and pAKT to total AKT using band intensity from (E). In (C), (D), and (F) data are represented as mean ± SEMs. Comparisons made via two-way ANOVA with Sidak’s multiple comparisons post-test (D) and ANOVA with Turkey’s multiple comparisons post-test (F).
Figure 7.
Figure 7.. Loss of MST1/2 alters fasting glycogen metabolism
(A) Immunoblot for the indicated proteins using lysates from livers taken from Stk3f/f;Stk4f/f, Alb-Cre−/− (Flox) and Stk3f/f;Stk4f/f, Alb-Cre+/− (DKO) that were fasted for 18 h (Fast) and then euthanized or provided food for 4 h (Fed). N = 4. (B) Quantification of the ratio of phosphorylated glycogen synthase (pGS) to total GS using band intensity for the Fasted mice in (A). The ratio was normalized to the average of the Fasted Flox mice. (C–E) Hepatic GS activity (C; N = 4), glycogen phosphorylase (GP) activity (D; N = 4), and glycogen content (E; N = 10) were measured from Fasted Flox and DKO mice. Data are presented as mean ± SEMs. Comparisons made via Student’s t test.

References

    1. Nolte RT, Eck MJ, Schlessinger J, Shoelson SE, and Harrison SC (1996). Crystal structure of the PI 3-kinase p85 amino-terminal SH2 domain and its phosphopeptide complexes. Nat. Struct. Biol 3, 364–374. - PubMed
    1. Fritsch R, de Krijger I, Fritsch K, George R, Reason B, Kumar MS, Diefenbacher M, Stamp G, and Downward J (2013). RAS and RHO families of GTPases directly regulate distinct phosphoinositide 3-kinase isoforms. Cell 153, 1050–1063. - PMC - PubMed
    1. Chen M, Choi S, Jung O, Wen T, Baum C, Thapa N, Lambert PF, Rapraeger AC, and Anderson RA (2019). The Specificity of EGF-Stimulated IQGAP1 Scaffold Towards the PI3K-Akt Pathway is Defined by the IQ3 motif. Sci. Rep 9, 9126. - PMC - PubMed
    1. Fruman DA, Chiu H, Hopkins BD, Bagrodia S, Cantley LC, and Abraham RT (2017). The PI3K Pathway in Human Disease. Cell 170, 605–635. - PMC - PubMed
    1. Hopkins BD, Goncalves MD, and Cantley LC (2020). Insulin-PI3K signalling: an evolutionarily insulated metabolic driver of cancer. Nat. Rev. Endocrinol 16, 276–283. - PMC - PubMed

Publication types

MeSH terms