. 2023 Dec 7;18(12):e0295711.
doi: 10.1371/journal.pone.0295711. eCollection 2023.

Automated, high-throughput quantification of EGFP-expressing neutrophils in zebrafish by machine learning and a highly-parallelized microscope

Affiliations

Automated, high-throughput quantification of EGFP-expressing neutrophils in zebrafish by machine learning and a highly-parallelized microscope

John Efromson et al. PLoS One. .

Abstract

Normal development of the immune system is essential for overall health and disease resistance. Bony fish, such as the zebrafish (Danio rerio), possess all the major immune cell lineages as mammals and can be employed to model human host response to immune challenge. Zebrafish neutrophils, for example, are present in the transparent larvae as early as 48 hours post fertilization and have been examined in numerous infection and immunotoxicology reports. One significant advantage of the zebrafish model is the ability to affordably generate high numbers of individual larvae that can be arrayed in multi-well plates for high throughput genetic and chemical exposure screens. However, traditional workflows for imaging individual larvae have been limited to low-throughput studies using traditional microscopes and manual analyses. Using a newly developed, parallelized microscope, the Multi-Camera Array Microscope (MCAM™), we have optimized a rapid, high-resolution algorithmic method to count fluorescently labeled cells in zebrafish larvae in vivo. Using transgenic zebrafish larvae, in which neutrophils express EGFP, we captured 18 gigapixels of images across a full 96-well plate, in 75 seconds, and processed the resulting datastream, counting individual fluorescent neutrophils in all individual larvae in 5 minutes. This automation is facilitated by a machine learning segmentation algorithm that defines the most in-focus view of each larva in each well after which pixel intensity thresholding and blob detection are employed to locate and count fluorescent cells. We validated this method by comparing algorithmic neutrophil counts to manual counts in larvae subjected to changes in neutrophil numbers, demonstrating the utility of this approach for high-throughput genetic and chemical screens where a change in neutrophil number is an endpoint metric. Using the MCAM™ we have been able to, within minutes, acquire both enough data to create an automated algorithm and execute a biological experiment with statistical significance. Finally, we present this open-source software package which allows the user to train and evaluate a custom machine learning segmentation model and use it to localize zebrafish and analyze cell counts within the segmented region of interest. This software can be modified as needed for studies involving other zebrafish cell lineages using different transgenic reporter lines and can also be adapted for studies using other amenable model species.


Conflict of interest statement

The authors declare the following financial interests/personal relationships which may be considered as potential competing interests: AB, TJJD, CD, JE, MH, PR, and VS are employees of, have a financial interest in, and contribute intellectual property to Ramona Optics Inc., which is commercializing the multicamera array microscope. This does not alter our adherence to PLOS ONE policies on sharing data and materials.

Figures
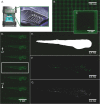
Fig 1
Fig 1. Zebrafish imaging and neutrophil quantification workflow.
Transgenic zebrafish larvae (Tg(lyz:EGFP)) expressing neutrophil-specific EGFP were anesthetized at 72 hpf and distributed into 96-well plates with low background autofluorescence and volumetrically scanned using a MCAM™ (see Materials and Methods). A) Depicts the Multi-Camera Array Microscope (MCAM™) alongside a closeup of the 48 micro camera modules that make up the microscope array. Each lens is 12 mm in diameter. B) A representative image of a 96-well plate with Tg(lyz:EGFP) transgenic zebrafish larvae is shown. C) A zoomed in image (natively 3072 x 3072 x 3 pixels2 and ~3 μm/pixel resolution) of a single well with a zebrafish larva in lateral orientation is shown. D) Following image acquisition, the Z-axis was searched automatically for the most in-focus frame of each well using a pretrained segmentation model to find a region-of-interest around each zebrafish and compute the best focus of this image region. E) Using the most in-focus frame for each well, each larva was segmented from the image background and a mask was generated to represent this region-of-interest. F) Neutrophils are shown after applying a pixel intensity threshold applied to the segmented larva which highlights the cells for counting. G) Individual cells were counted using blob detection techniques and are pinpointed on each image for visualization.
Fig 2
Fig 2. Segmentation network training and evaluation.
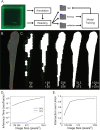
A) Data is organized for model training by annotating images, resizing images and corresponding annotations to model input dimensions, separating images randomly into training, validation and test subsets and then the training and validation subsets are used for model training while the test subset is used for model evaluation. B) Images are annotated by outlining the fish and many of these image-label pairs are fed to U-Net to train the neural network. C) Square 3072 x 3072 well images are downsampled to either 64 x 64, 128 x 128, 256 x 256, 512 x 512, or 1024 x 1024 pixels2 to reduce computation for segmentation inference and the resulting ROI mask is upsampled back to the original image shape which greatly affects segmentation accuracy. Here, segmentation masks computed at different resolutions are overlaid on the original image at native resolution and cropped to display only the fish. Labels reflect the resolution downsampled to during inference. D) Inference time per frame is plotted against image size. Inference time increases when segmenting increasing image sizes, and this computation is completed much more efficiently on a GPU rather than CPU. The Y-axis is displayed on a log scale. E) Intersection over union is plotted against image size. Intersection over union improves when images are inferred at higher resolution.
Fig 3
Fig 3. Algorithmic versus manual counting of EGFP+ neutrophils.
A) Violin plot showing similarity between distribution of manual and algorithmic neutrophil counts in 72 hpf Tg(lyz:EGFP) zebrafish expressing neutrophil-specific EGFP with highly similar mean values (N = 93 larvae). B) Orientation of anesthetized 72 hpf zebrafish (N = 192 larvae) plated in square 96-well plates suggesting that the potential discrepancy introduced by counting cells in fish in the non-lateral orientation is minimal because this sub-population accounts for such a small fraction of the whole.
Fig 4
Fig 4. Algorithmic versus manual cell counting for experimental conditions.
A) Knockdown and chemical modulation of zebrafish neutrophil counts. A csf3r antisense morpholino (MO) was injected into one-cell stage zebrafish embryos reducing neutrophil counts at 72 hpf (N = 95 larvae). Another subset of zebrafish were treated with 2 μM dibutyl phthalate (DBP), from 6 to 72 hpf, also reducing neutrophil counts but by a more subtle degree (N = 23 larvae). Neutrophil counts were obtained manually and by using the algorithmic pipeline and compared for all groups including untreated Tg(lyz:EGFP) (N = 93 larvae) fish and non-EGFP wild-type (WT) fish (N = 96 larvae). Data points show average neutrophil count and error bars represent the standard error of each experimental group. p-values were computed using a Mann-Whitney U test. * = p ≤ 0.05, ns = no significance. B) Linear regression displaying strong correlation between manual and algorithmic counts for all conditions.

Update of

References

    1. Burn GL, Foti A, Marsman G, Patel DF, Zychlinsky A. The Neutrophil. Immunity. 2021;54: 1377–1391. - PubMed
    1. Woodfin A, Voisin M-B, Beyrau M, Colom B, Caille D, Diapouli F-M, et al.. The junctional adhesion molecule JAM-C regulates polarized transendothelial migration of neutrophils in vivo. Nat Immunol. 2011;12: 761–769. doi: 10.1038/ni.2062 - DOI - PMC - PubMed
    1. Abtin A, Jain R, Mitchell AJ, Roediger B, Brzoska AJ, Tikoo S, et al.. Perivascular macrophages mediate neutrophil recruitment during bacterial skin infection. Nat Immunol. 2014;15: 45–53. doi: 10.1038/ni.2769 - DOI - PMC - PubMed
    1. Renshaw SA, Loynes CA, Trushell DMI, Elworthy S, Ingham PW, Whyte MKB. A transgenic zebrafish model of neutrophilic inflammation. Blood. 2006;108: 3976–3978. doi: 10.1182/blood-2006-05-024075 - DOI - PubMed
    1. Lin A, Loughman JA, Zinselmeyer BH, Miller MJ, Caparon MG. Streptolysin S inhibits neutrophil recruitment during the early stages of Streptococcus pyogenes infection. Infect Immun. 2009;77: 5190–5201. doi: 10.1128/IAI.00420-09 - DOI - PMC - PubMed