. 2024 Mar 12;8(5):1063-1074.
doi: 10.1182/bloodadvances.2023011213.

An inducible Cd79b mutation confers ibrutinib sensitivity in mouse models of Myd88-driven diffuse large B-cell lymphoma

Affiliations

An inducible Cd79b mutation confers ibrutinib sensitivity in mouse models of Myd88-driven diffuse large B-cell lymphoma

Ruth Flümann et al. Blood Adv. .

Abstract

Diffuse large B-cell lymphoma (DLBCL) is the most common aggressive lymphoma and constitutes a highly heterogenous disease. Recent comprehensive genomic profiling revealed the identity of numerous molecularly defined DLBCL subtypes, including a cluster which is characterized by recurrent aberrations in MYD88, CD79B, and BCL2, as well as various lesions promoting a block in plasma cell differentiation, including PRDM1, TBL1XR1, and SPIB. Here, we generated a series of autochthonous mouse models to mimic this DLBCL cluster and specifically focused on the impact of Cd79b mutations in this setting. We show that canonical Cd79b immunoreceptor tyrosine-based activation motif (ITAM) mutations do not accelerate Myd88- and BCL2-driven lymphomagenesis. Cd79b-mutant murine DLBCL were enriched for IgM surface expression, reminiscent of their human counterparts. Moreover, Cd79b-mutant lymphomas displayed a robust formation of cytoplasmic signaling complexes involving MYD88, CD79B, MALT1, and BTK. These complexes were disrupted upon pharmacological BTK inhibition. The BTK inhibitor-mediated disruption of these signaling complexes translated into a selective ibrutinib sensitivity of lymphomas harboring combined Cd79b and Myd88 mutations. Altogether, this in-depth cross-species comparison provides a framework for the development of molecularly targeted therapeutic intervention strategies in DLBCL.


Conflict of interest statement

Conflict-of-interest disclosure: H.C.R. received consulting and lecture fees from AbbVie, AstraZeneca, Roche, Janssen-Cilag, Novartis, Vertex, and Merck; research funding from Gilead and AstraZeneca; and is a cofounder of CDL Therapeutics GmbH. B.v.T. is an adviser or consultant for Allogene, BMS/Celgene, Cerus, Incyte, IQVIA, Gilead Kite, Miltenyi, Novartis, Noscendo, Pentixapharm, Roche, Amgen, Pfizer, Takeda, Merck Sharp & Dohme, and Gilead Kite; has received honoraria from AstraZeneca, BMS, Incyte, Novartis, Roche Pharma AG, Takeda, and Merck Sharp & Dohme; reports research funding from Novartis (institutional), Merck Sharp & Dohme (institutional), and Takeda (institutional); and travel support from AbbVie, AstraZeneca, Gilead Kite, Merck Sharp & Dohme, Roche, Takeda, and Novartis. The remaining authors declare no competing financial interests.

Figures

None
Graphical abstract
Figure 1.
Figure 1.
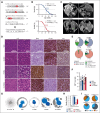
Mouse models develop clonal DLBCL-like disease. (A) Schematic visualizations of the alleles used throughout the manuscript. Triangular shapes represent loxP sites. (B) Survival was determined for both the Prdm1-proficient (MBC/79-MBC) and Prdm1-deficient (PPMBC/79-PPMBC) models. (C) Representative MRI images of overt lymphoma in the 4 mouse lines; L, lymphoma; S, spleen; and K, kidney. (D) Representative immunohistochemical stainings of lymphoma tissue isolated from MBC, 79-MBC, PPMBC, and 79-PPMBC animals. (E) Quantification of the terminal phenotypes as determined by macroscopic and histological/immunohistochemical analysis; int, intestinal. (F) Quantification of the frequency of Ki67+ cells in lymphoma sections from the indicated genotypes. Each data point represents a lesion from an individual animal. (G-I) BCR sequencing was performed on cDNA of lesions histologically characterized as tumors and PNA+ GCB cells from wildtype animals. (G) shows representative clonality plots of 1 sample per genotype. Within each sample, each circle represents a unique BCR sequence, whereas the size of the circle represents the frequency of this sequence within the sample. Sequences differing by a maximum of 2 nucleotides are considered to be clonally related and therefore connected to clones by connecting lines. The dominant clone of each sample is highlighted in blue. The size of the largest clone of each analyzed sample (PNA+ B, n = 4; MBC, n = 8; 79-MBC, n = 10; PPMBC, n = 5; and 79-PPMBC, n = 6) is plotted in panel H and the identified heavy chains are quantified in panel I; ∗P ≤ .05; Welch 2-tailed t test, Benjamini-Hochberg-correction for multihypothesis testing. cDNA, complementary DNA; PNA, peanut agglutinin.
Figure 2.
Figure 2.
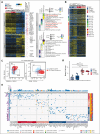
Myd88-driven mouse models display genomic and transcriptomic features reminiscent of human ABC-DLBCL. (A) A heat map was generated from genes expressed differentially between the individual pairs of genotypes. The normalized DeSeq2 counts were centered after a row-wise mean subtraction. Highlighted MGI Gene Symbols were extracted from the Hallmark NfkappaB signature, Jensen compartments of NfkappaB, Jensen B-cell receptor (BCR) complex, and WikiPathways BCR, which were also significantly enriched in cluster 1. The right panel shows dot plots of significantly altered gene sets within cluster 1 and cluster 2, respectively. The size of the dot corresponds to the number of genes overlapping between the given cluster and the gene set, whereas the adjusted P value is visualized following a color code with an individual legend being provided. Gene sets highlighted in the heat map are marked in red color (n = 60). (B) Murine lymphoma transcriptomes were clustered by the expression of genes included in a published set of gene signatures specific to different GC developmental stages; DZ, dark zone; Int, intermediate; LZ, light zone; PreM, prememory; PBL, plasmablast. (C) Flow cytometric analyses of lymphoma samples for the expression of memory (CD38+/Fas, gate “MB”) and germinal center B cell (CD38/Fas+, gate “GCB”) surface markers. The expression levels of CXCR4 and CD86 were determined to distinguish between light and dark zone profiles (gates “LZ” and “DZ”). Splenocytes from Cd19Cre/wt were used as a reference. One case representative of 9 analyzed 79-PPMBC tumors is illustrated, the full set of cases is visualized in supplemental Figure 2E-F. (D) The abundance of memory B cells across different genotypes was quantitatively estimated using mMCP-counter, a method that uses a proprietary score to estimate the abundance of specific cell types (n = 60). (E) Oncoplot from MBC, 79-MBC, PPMBC, and 79-PMBC lymphomas (n = 65). Displayed are recurrently mutated genes identified using OncodriveCLUST, a method specifically designed to identify significantly mutated genes that are subject to positive selection in cancer. These genes have been implicated in MCD DLBCL, as indicated by the “mut. in MCD” label. Moreover, mutations that are significantly enriched in any of the investigated genotypes are depicted. IL-2, interleukin 2; PDT, photodynamic therapy; TNF, tumor necrosis factor.
Figure 3.
Figure 3.
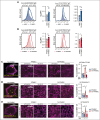
Cd79b p.Y195H augments BCR signaling. (A) Lymphoma cells of MBC and 79-MBC lymphomas were analyzed for levels of phosphorylated PLCg2 and SYK by flow cytometry. Representative cases are visualized as histograms, the geometric mean fluorescence intensity (MFI) is quantified for all analyzed cases (MBC, n = 10; and 79-MBC, n = 7). (B) The levels of phosphorylated PLCg2 and SYK in PPMBC and 79-PPMBC lymphoma cells were determined by flow cytometry. Visualized are representative cases; the MFIs of 12 PPMBC and 18 79-PPMBC lymphoma samples were quantified. (C) PLAs to detect the proximity of MYD88 and CD79B were performed on FFPE samples of PPMBC and 79-PPMBC lymphomas. Before sample collection, the animals were either left untreated or treated acutely with ibrutinib (30mg/kg orally, daily for 3 days). PLA foci are visualized in yellow, and B220 staining (violet) was used to determine cell numbers. The PLA count per cell was quantified for a minimum of 5 independent lymphomas per condition. PLAs were performed in a similar manner to detect the proximity of MYD88 with MALT1 (D) and BTK (E). ∗P ≤ .05, ∗∗P ≤ .01, ∗∗∗P ≤ .001, ∗∗∗∗P ≤ .0001. Welch's 2-tailed t test, Benjamini-Hochberg-correction for multihypothesis testing. APC, allophycocyanin; FFPE, formalin-fixed, paraffin-embedded.
Figure 4.
Figure 4.
Cd79b p.Y195H confers ibrutinib sensitivity in vivo. MBC, 79-MBC, PPMBC, and 79-PPMBC mice were monitored for lymphoma development by MRI and upon tumor diagnosis either left untreated or treated with ibrutinib. (A) MRI images illustrate a baseline scan and after 3 weeks of ibrutinib treatment for a representative animal of each genotype and cohort. (B) Volume changes of target lesions over time are visualized for all 4 genotypes. Progression-free survival (C) and OS (D) is illustrated . (E), (F) PLA detecting the proximity of MYD88 and CD79B was done on FFPE tissue sections of ibrutinib relapsed 79-MBC and 79-PPMBC lymphomas and compared with PLA counts of treatment-naïve lesions of the same genotype, as well as tumor samples isolated from acutely treated animals (30 mg/kg orally daily for 3 days). ∗P ≤ .05, ∗∗P ≤ .01, ∗∗∗P ≤ .001, ∗∗∗∗P ≤ .0001; (C-D) Log-rank test. (E-F) Welch 2-tailed t test, corrected for multihypothesis testing (Benjamini-Hochberg).

References

    1. Swerdlow SH, Campo E, Pileri SA, et al. The 2016 revision of the World Health Organization classification of lymphoid neoplasms. Blood. 2016;127(20):2375–2390. - PMC - PubMed
    1. Alizadeh AA, Eisen MB, Davis RE, et al. Distinct types of diffuse large B-cell lymphoma identified by gene expression profiling. Nature. 2000;403(6769):503–511. - PubMed
    1. Shaffer AL, 3rd, Young RM, Staudt LM. Pathogenesis of human B cell lymphomas. Annu Rev Immunol. 2012;30:565–610. - PMC - PubMed
    1. Lenz G, Wright G, Dave SS, et al. Stromal gene signatures in large-B-cell lymphomas. N Engl J Med. 2008;359(22):2313–2323. - PMC - PubMed
    1. Rosenwald A, Wright G, Chan WC, et al. The use of molecular profiling to predict survival after chemotherapy for diffuse large-B-cell lymphoma. N Engl J Med. 2002;346(25):1937–1947. - PubMed

Publication types

MeSH terms