. 2024 May 31;195(2):1180-1199.
doi: 10.1093/plphys/kiad655.

Deep proteomics reveals incorporation of unedited proteins into mitochondrial protein complexes in Arabidopsis

Affiliations

Deep proteomics reveals incorporation of unedited proteins into mitochondrial protein complexes in Arabidopsis

Nils Rugen et al. Plant Physiol. .

Abstract

The mitochondrial proteome consists of numerous types of proteins which either are encoded and synthesized in the mitochondria, or encoded in the cell nucleus, synthesized in the cytoplasm and imported into the mitochondria. Their synthesis in the mitochondria, but not in the nucleus, relies on the editing of the primary transcripts of their genes at defined sites. Here, we present an in-depth investigation of the mitochondrial proteome of Arabidopsis (Arabidopsis thaliana) and a public online platform for the exploration of the data. For the analysis of our shotgun proteomic data, an Arabidopsis sequence database was created comprising all available protein sequences from the TAIR10 and Araport11 databases, supplemented with sequences of proteins translated from edited and nonedited transcripts of mitochondria. Amino acid sequences derived from partially edited transcripts were also added to analyze proteins encoded by the mitochondrial genome. Proteins were digested in parallel with six different endoproteases to obtain maximum proteome coverage. The resulting peptide fractions were finally analyzed using liquid chromatography coupled to ion mobility spectrometry and tandem mass spectrometry. We generated a "deep mitochondrial proteome" of 4,692 proteins. 1,339 proteins assigned to mitochondria by the SUBA5 database (https://suba.live) accounted for >80% of the total protein mass of our fractions. The coverage of proteins by identified peptides was particularly high compared to single-protease digests, allowing the exploration of differential splicing and RNA editing events at the protein level. We show that proteins translated from nonedited transcripts can be incorporated into native mitoribosomes and the ATP synthase complex. We present a portal for the use of our data, based on "proteomaps" with directly linked protein data. The portal is available at www.proteomeexplorer.de.


Conflict of interest statement

Conflict of interest statement. The authors declare no conflict of interest.

Figures
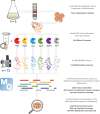
Figure 1.
Figure 1.
Schematic representation of the experimental workflow. Three independent mitochondrial isolations were performed starting from an A. thaliana liquid cell culture. Proteins of a mitochondrial fraction were extracted, purified using the SP3 workflow, and subsequently digested separately with six different proteases. Generated peptides were analyzed by LC–IMS–MS/MS on a timsTOF Pro mass spectrometer. A total of 72 LC–MS measurements were performed (3 samples * 6 digests * 4 TIMS fractions). All raw data were finally combined and analyzed in MaxQuant (MQ) to achieve deep coverage of the mitochondrial proteome. The resulting dataset was used to comprehensively characterize the mitochondrial proteins of Arabidopsis. Abbreviations: SP3, single-pot, solid-phase-enhanced sample preparation; LC–IMS–MS/MS, liquid chromatography–ion mobility spectrometry–tandem mass spectrometry; Chymo, chymotrypsin; TIMS, trapped ion mobility spectrometry; TOF, time-of-flight. Red: Arg-C; Yellow: Trypsin; Blue: Lys-C; Green: Asp-N; Purple: Chymotrypsin; Gray: Glu-C.
Figure 2.
Figure 2.
Purity estimation of the mitochondrial fraction. All proteins identified by our six-protease-proteome-approach were assigned to subcellular localizations using the SUBAcon algorithm of SUBA5 (Hooper et al. 2017). Next, protein quantities (normalized iBAQ values) were summed up for each protease digest per subcellular fraction. The bar chart indicates cumulated protein abundance of the four most prominent subcellular compartments (mitochondrion, plastid, cytosol, peroxisome; all other compartments are grouped as “others”) for the six proteases. The bars on the very left indicate the composition of the analyzed mitochondrial fraction based on combing the information from all six protease digests. Values in parentheses indicate the number of proteins identified per protease digest (number of proteins with iBAQ values >0 in all three replicates). Error bars indicate the standard deviation of the calculated protein abundance between the three replicates.
Figure 3.
Figure 3.
Dynamic range of proteome expression. Proteins are grouped by subcellular assignment as introduced in Fig. 2 and sorted by their log10-transformed abundance (based on iBAQ). Name and AGI of the most abundant protein of each assignment is given. Note that highest abundance (normalized iBAQ value) of a mitochondrial protein (the d subunit of the mitochondrial ATP synthase) is 1,000,000 (106); while the highest abundance of a putative nonmitochondrial protein (the peroxisomal B12D protein) is 250,000 (105.4). For B12D, both MULocDeep (Jiang et al. 2023) and DeepMito (Savojardo et al. 2020) predict localization in the mitochondrial inner membrane or matrix. Therefore, B12D is likely to be a (dual-targeted) mitochondrial protein. Figure generated with Instant Clue (Nolte et al. 2018).
Figure 4.
Figure 4.
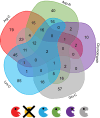
Composition of the nontryptic Arabidopsis mitochondrial subproteome. In total, 462 proteins were detected, for which no iBAQ was calculated in any of the three tryptic samples. The Venn diagram shows how many of these nontryptic proteins have been identified exclusively in each digest, as well as how many proteins have been identified in multiple digests. Most exclusive proteins have been identified in the Arg-C and Lyc-C approaches, the fewest in the Chymotrypsin approach. For each digest, we only considered protein groups with an iBAQ > 0 in 3/3 replicates. The Venn diagram was generated online at https://bioinformatics.psb.ugent.be/webtools/Venn/. Red: Arg-C; Yellow: Trypsin; Blue: Lys-C; Green: Asp-N; Purple: Chymotrypsin; Grey: Glu-C.
Figure 5.
Figure 5.
Comparison of sequence coverage for each of the identified proteins by tryptic peptides and by combined peptides of all proteases. Proteins are ranked by their sequence coverage by tryptic peptides (yellow line). Dots show the sequence coverage by the combined protease digests including trypsin. Red dots show proteins assigned to Mitochondria by SUBA, gray dots show proteins assigned to other compartments. The greater the distance of a dot from the yellow line, the greater the gain in sequence coverage.
Figure 6.
Figure 6.
Abundance profiles of editing-specific peptides in the mitochondrial ATP synthase complex upon large-pore complexome profiling analysis. Mitochondrial protein complexes were resolved on a one-dimensional large pore Blue-native gel as described previously (Rugen et al. 2021). The resulting gel lane was dissected into 46 gel pieces from top to bottom and used for label-free quantitative shotgun proteome analyses as described before (Rugen et al. 2021). A) Heatmap of clustered proteins belonging to the mitochondrial ATP synthase complex (original data from Rugen et al. 2021). Each row of the heatmap indicates abundance of a single protein (accession number and name to the right) along the Blue-native gel lane (rows were hierarchically clustered). Color indicates protein abundance and is normalized for each protein individually: Red: maximum, light yellow: minimum; black: no detection. A molecular mass standard is given above the heatmap. B) Abundance profiles of two peptides of the ATP4 subunit (encoded by ATMG00640) along the lane of the large pore Blue-native gel. Both peptides are generated by translation of regions of the ATP4 mRNA that carry the RNA editing site atp4eU416TIp98. The editing site is labeled according to Rüdinger et al. (2009): atp4eU416TIp98—The nucleotide “U” results from editing of the original “C” at the position 416 of the corresponding mRNA; counting starts with the first nucleotide of the AUG start codon; upon translation, the edited protein carries Isoleucine (I) instead of Threonine (T); editing efficiency has been reported to be 98%. Blue graph: Abundance profile of the edited peptide. Orange graph: Abundance profile of the nonedited peptide. Editing efficiency as reported by Bentolila et al. (2013). y-Axis not at the same scale.
Figure 7.
Figure 7.
Abundance profiles of editing-specific peptides in the small mitoribosomal subunit upon large-pore complexome profiling analysis. Experimental approach: see the legend of Fig. 6. A) Heatmap of clustered proteins belonging to the small mitoribosomal subunit (original data from Rugen et al. (2021), classification of mitoribosomal proteins according to Rugen et al. (2019) and Waltz et al. (2019)). Each row of the heatmap indicates abundance of a single protein (accession number and name to the right) along the Blue-native gel lane (rows were hierarchically clustered). Color indicates protein abundance and is normalized for each protein individually: Red: maximum, light yellow: minimum; black: no detection). A molecular mass standard is given above the heatmap. B) Averaged abundance profile of all RPS3 peptides along the lane of the large pore Blue native gel. C) Abundance profiles of editing-specific peptides of the RPS3 subunit (encoded by AtMg00090) along the lane of the large pore Blue native gel. Editing sites are labeled according to Rüdinger et al. (2009): (I) rps3eU887SLp73—The nucleotide “U” results from editing of the original “C” at the position 887 of the corresponding mRNA; counting starts with the first nucleotide of the AUG start codon; upon translation, the edited peptide carries Leucine (L), while the nonedited peptide carries a Serine (S); editing efficiency has been reported to be 73% (Bentolila et al. 2013). Orange graph: abundance profile of the nonedited peptide; blue graph: abundance profile of the edited peptide; (II) rps3eU1571AVp97/rps3eU1580SFp11—The mRNA is edited at two sites in the region encoding this peptide, resulting in possible Alanine (A) to Valine (V) and/or Serine (S) to Phenylalanine (F) exchanges (editing efficiencies are 97% and 11%). Orange graph: Abundance profile of the fully nonedited peptide; blue graph: Abundance profile of the fully edited peptide; Green: Abundance profile of a peptide edited at rps3eU1571AVp97 but not at rps3eU1580SFp11. Editing efficiency as reported by Bentolila et al. (2013).
Figure 8.
Figure 8.
Sequence comparison of two proteoforms of the 40 kDa subunit of the preprotein translocase of the outer mitochondrial membrane (TOM) the E2 subunit of the oxoglutarate dehydrogenase complex (OGDC), respectively. Amino acid sequences are arranged using the Protter software tool (Omasits et al. 2014). Horizontal black lines indicate cleavage sites for trypsin. A, B) Proteoforms of TOM40. Two tryptic peptides unique to one or the other proteoform are given in green (the shorter peptide in TOM40-1 is the result of removed exons during splicing). Peptides only present in TOM40-1 are given in orange; peptides present in both proteoforms in gray; nondetected peptides in light gray. C, D) Proteforms of OGDC-E2. Two tryptic peptides unique to one or the other proteoform are given in green (the shorter peptide in OGDCE2-3 is the result of removed exons during splicing). Peptides present in both proteoforms in gray; nondetected peptides in light gray.
Figure 9.
Figure 9.
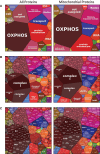
Proteomaps of the Arabidopsis mitochondrial fraction. Proteins are grouped according to functional categories (A) or more detailed functional subcategories, e.g. affiliation with a protein complex (B + C). The proteomaps were generated at the proteomaps portal (https://www.proteomaps.net/; Liebermeister et al. 2014). In all three proteomaps, each protein is represented by a polygon whose size reflects the abundance according to its iBAQ value. Assignment of proteins to functional categories according to Heinemann et al. (2021). Functional information on a few known mitochondrial proteins not assigned to categories in this reference was manually supplemented. Left column: proteomap showing all proteins identified; right column: proteomap only showing proteins assigned to mitochondria by the SUBA5 database (https://suba.live/index.html). Both data sets can be fully explored in Proteome Explorer (www.proteomeexplorer.de).
Figure 10.
Figure 10.
Localization of peptides of the RPS3 protein translated from nonedited transcripts (Fig. 7) in the structure of the small mitoribosomal subunit from plants. Structural data from Electron Microscopy Data Bank (EMDB-10654) (Waltz et al. 2020). The entire plant mitoribosome is shown to the right. The region enlarged to the left is indicated. Cyan: 18S rRNA; Red: RPS3; Green: positions in the RPS3 protein in which partial RNA editing leads to amino acid exchanges. The structure was analyzed with PyMOL (The PyMOL Molecular Graphics System, Version 2.5.4 Schrödinger, LLC). A PyMOL showfile allowing exploration of the structure in 3D is attached to this manuscript (Supplementary Data Set 1).

References

    1. Armenteros JJA, Salvatore M, Emanuelsson O, Winther O, Von Heijne G, Elofsson A, Nielsen H. Detecting sequence signals in targeting peptides using deep learning. Life Sci Alliance. 2019:2(5):e201900429. 10.26508/lsa.201900429 - DOI - PMC - PubMed
    1. Arnold S, Braun HP. The complexome profiling approach for direct biochemical analysis of multiprotein assemblies. Biochim Biophys Acta Bioenerg. 2022:1863(3):148522. 10.1016/j.bbabio.2021.148522 - DOI - PubMed
    1. Baker PR, Chalkley RJ. MS-Viewer: a web-based spectral viewer for proteomics results. Mol Cell Proteomics. 2014:13(5):1392–1396. 10.1074/mcp.O113.037200 - DOI - PMC - PubMed
    1. Bentolila S, Oh J, Hanson MR, Bukowski R. Comprehensive high-resolution analysis of the role of an Arabidopsis gene family in RNA editing. PLoS Genet. 2013:9(6):e1003584. 10.1371/journal.pgen.1003584 - DOI - PMC - PubMed
    1. Chu D, Wei L. Reduced C-to-U RNA editing rates might play a regulatory role in stress response of Arabidopsis. J Plant Physiol. 2020:244:153081. 10.1016/j.jplph.2019.153081 - DOI - PubMed

MeSH terms