. 2023;55(2):2290213.
doi: 10.1080/07853890.2023.2290213. Epub 2023 Dec 7.

Lycium barbarum polysaccharide alleviates DSS-induced chronic ulcerative colitis by restoring intestinal barrier function and modulating gut microbiota

Affiliations

Lycium barbarum polysaccharide alleviates DSS-induced chronic ulcerative colitis by restoring intestinal barrier function and modulating gut microbiota

Zhi-Yu Li et al. Ann Med. 2023.

Abstract

Purpose: This study examined the protective effects and mechanism of Lycium barbarum polysaccharides (LBP) in the context of intestinal barrier function and intestinal microbiota in mice with dextran sulfate sodium (DSS)-induced chronic ulcerative colitis (UC).

Methods: C57BL/6J male mice were assigned to a standard normal diet without DSS (control group), a normal diet with DSS (DSS group, 2% DSS given discontinuously for 3 weeks) or a normal diet supplemented with LBP (1% dry feed weight, LBP group, 2% DSS given discontinuously for 3 weeks) for a total of 8 weeks, at which point colonic tissues and caecal contents were collected.

Results: LBP exerted a significant effect against colitis by increasing body weight, colon length, DAI and histopathological scores. LBP inhibited proinflammatory cytokines (IL-1β, IL-6, iNOS and TNF-α) expression, improved anti-inflammatory cytokine (IL-10) expression, promoted the expression of tight junction proteins (Occludin and ZO-1) via nuclear factor erythroid 2-related factor 2 (Nrf2) activation and decreased Claudin-2 expression to maintain the intestinal mucosal barrier. In addition, the abundances of some probiotics (Ruminococcaceae, Lactobacillus, Butyricicoccus, and Akkermansia) were decreased with DSS treatment but increased obviously with LBP treatment. And LBP reduced the abundance of conditional pathogens associated with UC (Mucispirillum and Sutterella). Furthermore, LBP improved the production of short-chain fatty acids (SCFAs), including acetic acid, propionic acid, butyric acid and isobutyric acid.

Conclusion: LBP can alleviate DSS-induced UC by regulating inflammatory cytokines and tight junction proteins. Moreover, LBP promotes probiotics, suppresses conditional pathogens and increases SCFAs production, showing a strong prebiotic effect.

Keywords: Lycium barbarum polysaccharides; gut microbiota; tight junction proteins; ulcerative colitis.


Conflict of interest statement

No potential conflict of interest was reported by the author(s).

Figures
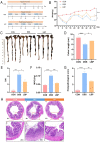
Figure 1.
Figure 1.
The symptoms and inflammation of DSS-induced colitis can be ameliorated by LBP supplementation. (A) Schematic diagram illustrating the animal study design. (B) Changes in body weight were recorded every six days during the disease process. (C, D) Representative pictures of colon gross appearance and colon length. (E) DAI scoring of DSS-induced colitis. (F) Distal colonic MPO levels were measured by a MPO colorimetric assay kit. (G, H) Distal colon tissues were collected for histopathologic examination after haematoxylin and eosin (HE) staining at 40× and 200×; a and b: the colonic structure of the control group was normal, the glands were neatly arranged, the crypts were normal, and there were no inflammatory cell infiltration; c and d: the DSS groups indicated disturbed architecture of colon and extensive glandular defects, crypt destruction and inflammatory cell infiltration; e and f: the LBP groups showed reduced numbers of infiltrating cells, a lesser degree of glandular and crypt damage and repaired partial mucosal injury. Statistical analysis was performed using two-way ANOVA (weight) and one-way ANOVA (post hoc analysis: Tukey’s multiple comparison test). Data indicate the mean ± SEM. *p < 0.05, **p < 0.01, ***p < 0.001, ****p < 0.0001.
Figure 2.
Figure 2.
LBP inhibited the expression of pro-inflammatory factors and improved the expression of anti-inflammatory factors. (A-E) Levels of pro-inflammatory factors (IL-1β, IL-6, iNOS and TNF-α) and anti-inflammatory factors (IL-10) were measured by RTq-PCR in distal colon tissues from the DSS and LBP groups. (F-J) Levels of pro-inflammatory factors (IL-1β, IL-6, iNOS and TNF-α) and anti-inflammatory factors (IL-10) were measured by RTq-PCR in Caco-2 cells that were treated with LPS (1 μg/mL) or LBP (100, 200, and 400 μg/mL) + LPS for 24 h. NC: negative control. Statistical analysis used unpaired t-test and one-way ANOVA (post hoc analysis: Tukey’s multiple comparison test). Data indicate the mean ± SEM. ns: p > 0.05, * p < 0.05, **p < 0.01, ***p < 0.001.
Figure 3.
Figure 3.
LBP mitigated intestinal microflora dysbiosis in DSS-treated mice. (A-D) Alpha diversity boxplot (Chao1, Shannon, and Simpson indices and observed species). (E) Principal coordinate analysis (PCoA) using Bray-Curtis metric distances of beta diversity. (F) Venn graph of the OTUs from gut microbiota of CON (orange), DSS (purple), and LBP (green) groups. (G) Average percentage of community abundance at the phylum level in the CON, DSS and LBP groups. (H-K) Relative abundance of Firmicutes, Deferribacterias, Verrucomicrobia and Bacteroidetes in the CON, DSS and LBP groups. Statistical analysis used the Kruskal-Wallis test. Data indicate the mean ± SEM. ns: p > 0.05,*p < 0.05, **p < 0.01.
Figure 4.
Figure 4.
LBP treatment regulated the gut microbiota at the genus level. (A) The dominant genera were compared between the different groups. (B-F) Changes in the relative abundances of Lactobacillus, Butyricicoccus, Akkermansia, Mucispirillum and Sutterella. (G) LEfSe analysis of the gut microbiota differed among the three groups. The statistical test was performed using the LDA effect size method. Statistical analysis used the Kruskal-Wallis test. Data indicate the mean ± SEM. ns: p > 0.05, *p < 0.05, **p < 0.01.
Figure 5.
Figure 5.
LBP treatment increased the production of microbial SCFA metabolites. Concentration differences measured by GC-MS among the CON, DSS and LBP groups in fecal levels of (A) acetic acid, (B) propionic acid, (C) butyrate acid, (D) isobutyric acid, (E) valeric acid, (F) isovaleric acid and (G) hexanoic acid (boxplot). Statistical analysis used the Kruskal-Wallis test. ns: p > 0.05, *p < 0.05, **p < 0.01, ***p < 0.001, ****p < 0.0001.
Figure 6.
Figure 6.
LBP treatment decreased intestinal permeability in vivo and Caco-2 cell monolayer permeability in vitro. (A) The gut barrier permeability of the DSS and LBP groups was measured by detection of FD4 in serum 3 h post FD4 gavage. (B) Effect of LBP on Caco-2 cell monolayer permeability to FD4. (C) The F-actin filaments of Caco-2 cells were labeled with Alexa Fluor 594-phalloidin after treatment with 400 μg/mL LBP for 24 h. Scale bar = 50 μm. NC: negative control. Statistical analysis was performed using one-way ANOVA (post hoc analysis: Tukey’s multiple comparison test). Data indicate the mean ± SEM. **p < 0.01, ****p < 0.0001.
Figure 7.
Figure 7.
LBP upregulated TJ protein expression in Caco-2 cells via activation of Nrf2. (A, B) Relative expression of TJ proteins (ZO-1, Occludin, and Claudin-2) was measured by Western blotting in the distal colon mucosa of the DSS and LBP groups. (C, D) Relative expression of TJ protein (ZO-1, Occludin, Claudin-2) were measured by Western blotting in Caco-2 cells after treatment with LBP 0, 100, 200, or 400 μg/mL for 24 h. (E, F) Caco-2 cells were pretreated with 20 μmol/L and 50 μmol/L ML385 (Nrf2 inhibitor) respectively for 1 h and then treated with 400 μg/mL LBP for 24 h. Relative expression of TJ proteins (ZO-1 and Occludin) and Nrf2 in Caco-2 cells was measured by Western blot. The gray value was calculated using ImageJ software. Statistical analysis was performed using one-way ANOVA (post hoc analysis: Tukey’s multiple comparison test). Data indicate the mean ± SEM. *p < 0.05, **p < 0.01.
Figure 8.
Figure 8.
The schematic diagram of LBP relieving colitis. Schematic diagram showing that the LBP modulates gut microbiota and restores intestinal barrier function to alleviate DSS-induced colitis.

References

    1. Dejban P, Rahimi N, Takzare N, et al. . Biochemical and histopathological evidence for the beneficial effects of modafinil on the rat model of inflammatory bowel disease: involvement of nitric oxide pathway. Pharmacol Rep. 2020;72(1):1–17. doi: 10.1007/s43440-019-00054-5. - DOI - PubMed
    1. Ng SC, Shi HY, Hamidi N, et al. . Worldwide incidence and prevalence of inflammatory bowel disease in the 21st century: a systematic review of population-based studies. Lancet. 2017;390(10114):2769–2778. doi: 10.1016/S0140-6736(17)32448-0. - DOI - PubMed
    1. Kaplan GG. The global burden of IBD: from 2015 to 2025. Nat Rev Gastroenterol Hepatol. 2015;12(12):720–727. doi: 10.1038/nrgastro.2015.150. - DOI - PubMed
    1. Windsor JW, Kaplan GG.. Evolving epidemiology of IBD. Curr Gastroenterol Rep. 2019;21(8):40. doi: 10.1007/s11894-019-0705-6. - DOI - PubMed
    1. Shen B, Kochhar G, Navaneethan U, et al. . Role of interventional inflammatory bowel disease in the era of biologic therapy: a position statement from the global interventional IBD group. Gastrointest Endosc. 2019;89(2):215–237. doi: 10.1016/j.gie.2018.09.045. - DOI - PubMed

Publication types