. 2023 Dec 7;14(1):8101.
doi: 10.1038/s41467-023-43849-0.

Outward-oriented sites within clustered CTCF boundaries are key for intra-TAD chromatin interactions and gene regulation

Affiliations

Outward-oriented sites within clustered CTCF boundaries are key for intra-TAD chromatin interactions and gene regulation

Xiao Ge et al. Nat Commun. .

Abstract

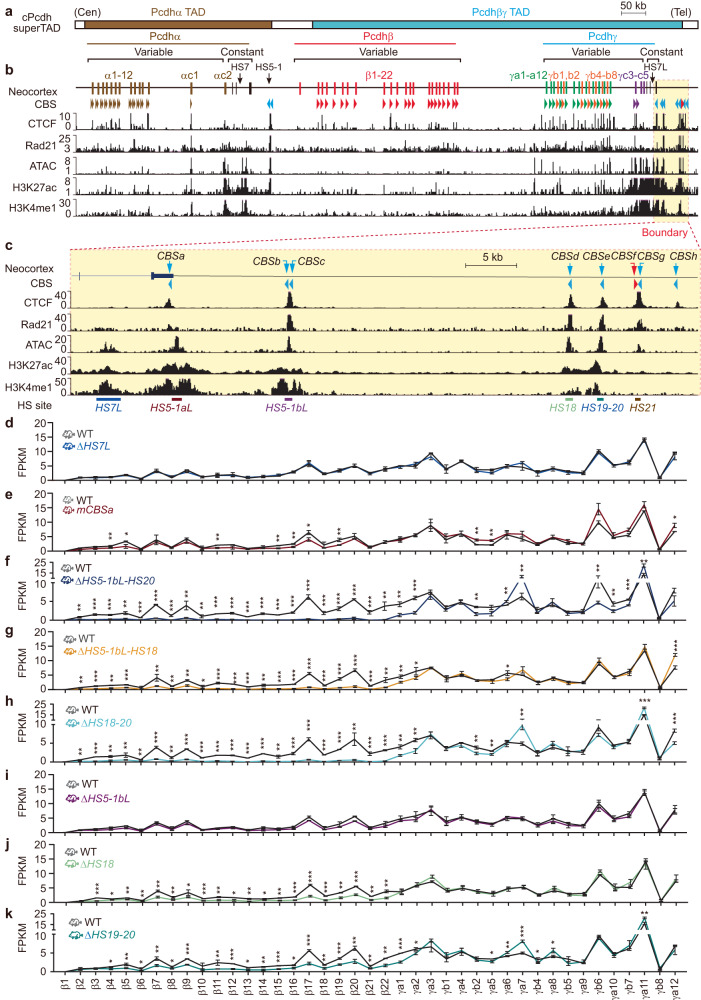
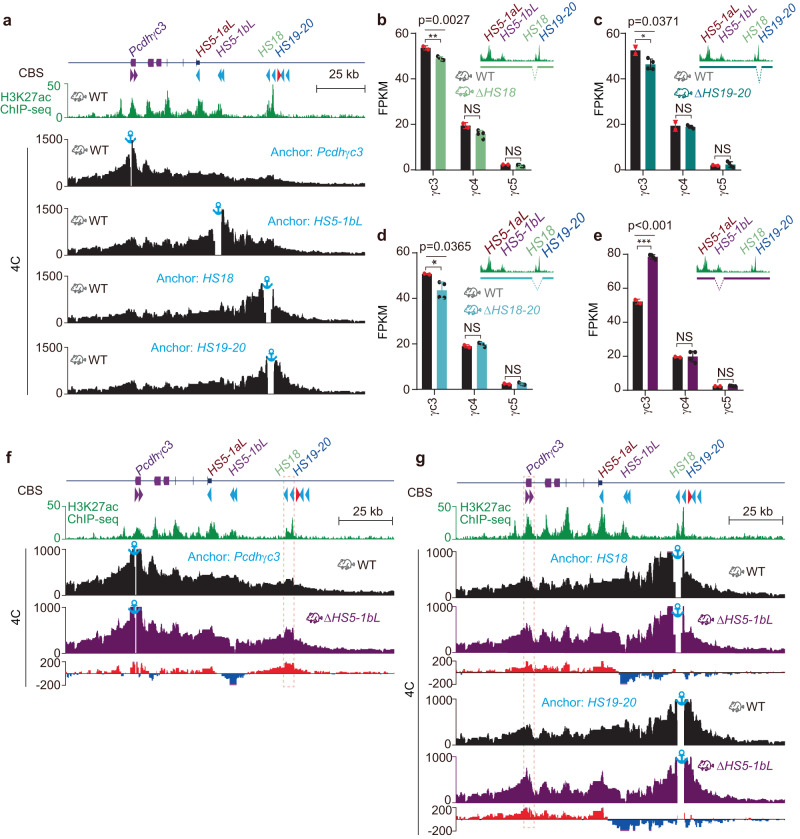
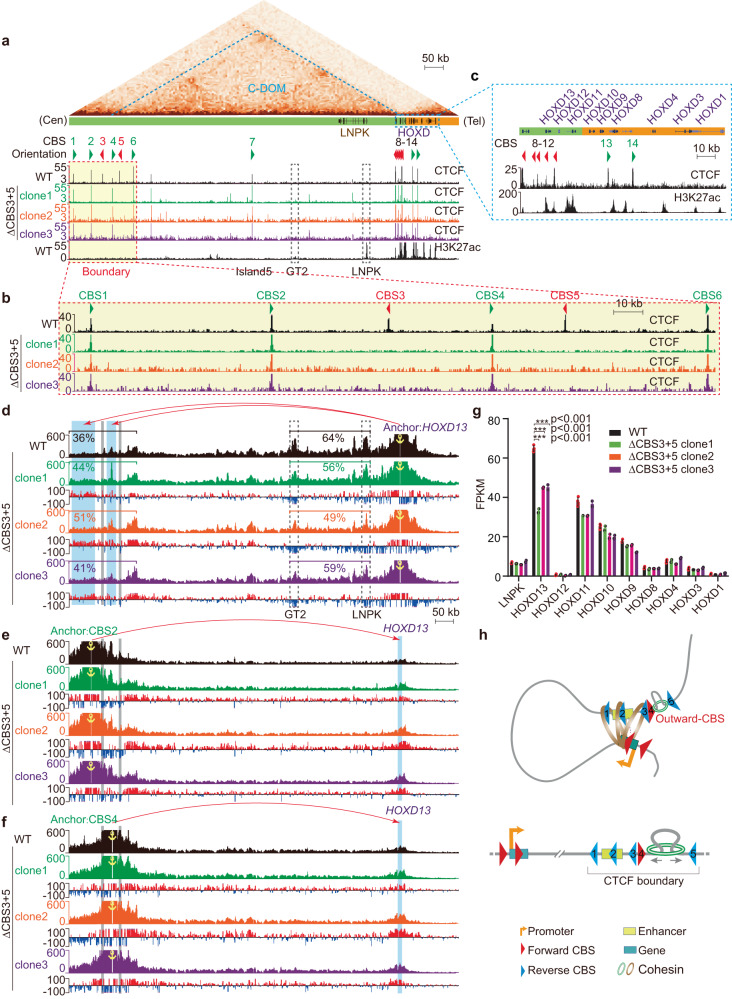
CTCF plays an important role in 3D genome organization by adjusting the strength of chromatin insulation at TAD boundaries, where clustered CBS (CTCF-binding site) elements are often arranged in a tandem array with a complex divergent or convergent orientation. Here, using Pcdh and HOXD loci as a paradigm, we look into the clustered CTCF TAD boundaries and find that, counterintuitively, outward-oriented CBS elements are crucial for inward enhancer-promoter interactions as well as for gene regulation. Specifically, by combinatorial deletions of a series of putative enhancer elements in mice in vivo or CBS elements in cultured cells in vitro, in conjunction with chromosome conformation capture and RNA-seq analyses, we show that deletions of outward-oriented CBS elements weaken the strength of long-distance intra-TAD promoter-enhancer interactions and enhancer activation of target genes. Our data highlight the crucial role of outward-oriented CBS elements within the clustered CTCF TAD boundaries in developmental gene regulation and have interesting implications on the organization principles of clustered CTCF sites within TAD boundaries.


Conflict of interest statement

The authors declare no competing interests

Figures

Fig. 1
Fig. 1. The downstream cPcdh superTAD boundary comprises clustered enhancers for Pcdhβγ gene regulation.
a Schematics of the mouse cPcdh locus. The mouse Pcdh α, β, and γ gene clusters are closely-linked within the cPcdh superTAD, which is divided into two TADs of Pcdhα and Pcdhβγ. Pcdh α and γ gene clusters contain 14 and 22 variable first exons, respectively, each of which is alternatively spliced to a single set of three downstream constant exons. The Pcdhβ gene cluster contains 22 variable exons but with no constant exon. Two Pcdhα enhancers, HS5-1 and HS7, are indicated by vertical black arrows. b ChIP-seq of CTCF, Rad21, H3K27ac, and H3K4me1 as well as ATAC-seq profiles of the cPcdh locus in the mouse neocortex. Arrowheads indicate CBS elements with orientations. Within the Pcdhα TAD, each Pcdhα alternate promoter is flanked by two forward CBS elements, the downstream enhancer of HS5-1 is flanked by two reverse CBS elements. Within the Pcdhβγ TAD, each Pcdh β or γ promoter is associated with one forward CBS, except for β1, γc4, and γc5 which have no CBS, as well as γc3 which has two forward CBS elements. c Close-up of the cPcdh superTAD downstream boundary marked by a red dotted rectangle in (a, b). This boundary comprises eight CBS elements, of which only CBSf is in the reverse orientation, and six ATAC-seq peaks, of which HS7L, HS5-1bL, HS18, and HS19-20 are knocked out individually or in combinations in mice. HS5-1aL is mutated at the CBSa motif (mCBSa) due to its location in the coding region. dk Expression levels of members of the Pcdh β and γ gene clusters in the mouse neocortex from ΔHS7L, mCBSa, ΔHS5-1bL-HS20, ΔHS5-1bL-HS18, ΔHS18-20, ΔHS5-1bL, ΔHS18, or ΔHS19-20 homozygous mice compared to their wild-type (WT) littermates. FPKM, fragments per kilobase of exon per million fragments mapped. Data as mean ± SD; two-tailed Student’s t test. *p < 0.05, **p < 0.01, ***p < 0.001. For each mouse line, n = 4 biologically independent samples; for their WT littermate controls, n = 2. Source data are provided as a Source Data file.
Fig. 2
Fig. 2. HS5-1bL is an insulator specific for Pcdhγc3.
a 4C profiles using a repertoire of elements as anchors showing close contacts between Pcdhγc3 and HS5-1bL, HS18, or HS19-20 in wild-type (WT) mice. be Expression levels of the Pcdhγ c-type genes in the mouse neocortex from ΔHS18 (b), ΔHS19-20 (c), ΔHS18-20 (d), or ΔHS5-1bL (e) homozygous mice compared to their wild-type littermates. Note the significant increase of expression levels of Pcdhγc3 upon deletion of HS5-1bL. Data as mean ± SD; two-tailed Student’s t test. *p < 0.05, **p < 0.01, ***p < 0.001. For each mouse line, n = 4 biologically independent samples; for their WT littermate controls, n = 2. Source data are provided as a Source Data file. f 4C profiles using the Pcdhγc3 promoter as an anchor, showing increased chromatin interactions between Pcdhγc3 and its HS18-20 enhancers in ΔHS5-1bL homozygous mice compared to their WT littermates. Differences (ΔHS5-1bL versus WT) are shown under the 4 C profiles. g 4C profiles using HS18 or HS19-20 as an anchor, showing increased chromatin interactions between Pcdhγc3 and HS18-20 in ΔHS5-1bL mice compared to their WT littermates. Differences (ΔHS5-1bL versus WT) are shown under the 4C profiles.
Fig. 3
Fig. 3. The cPcdh genes are expressed from H3K9me3/H3K36me3-enriched facultative heterochromatin domains.
a H3K9me3 and H3K36me3 ChIP-seq profiles of the three Pcdh clusters in mouse neocortex, showing colocalization of both the active mark of H3K36me3 and inactive mark of H3K9me3. b RNA-seq as well as H3K4me3 and H3K9ac ChIP-seq profiles of the cPcdh clusters in mouse neocortex, showing a strong correlation between each cPcdh gene and the enrichment of active marks. c The H3K9me2 ChIP-seq and MeDIP-seq profiles of the cPcdh clusters, showing enrichments of the repressive mark of H3K9me2 and DNA methylation at most cPcdh genes in the mouse neocortex.
Fig. 4
Fig. 4. Outward-oriented CBSf regulates Pcdhβγ by blocking their aberrant looping from the outside of the TAD boundary.
a CTCF and Rad21 ChIP-seq profiles of the Pcdhβγ downstream TAD boundary in CBSf-deleted (ΔCBSf) homozygous mice compared to their wild-type (WT) littermates. b Close-up of CTCF and Rad21 ChIP-seq as well as ATAC-seq profiles in ΔCBSf mice compared to their WT littermates. c RNA-seq showing decreased expression levels of Pcdhβγ upon CBSf deletion. Data as mean ± SD, *p < 0.05, **p < 0.01, ***p < 0.001; two-tailed Student’s t test. For CBSf deletion mouse line, n = 4 biologically independent samples; for their WT littermate controls, n = 2. Source data are provided as a Source Data file. d, e 4C profiles using a repertoire of Pcdhβγ promoters as anchors, showing decreased chromatin interactions with HS18-20 enhancers (highlighted in blue, (e)) and increased chromatin interactions beyond CBSf (highlighted in pink, (e)). Note a sharp edge for the transition from decrease to increase at the location of CBSf. Differences (ΔCBSf versus WT) are shown under the 4C profiles.
Fig. 5
Fig. 5. Double knockout of outward-oriented CBS3 and CBS5 elements downregulates HOXD13 gene expression.
a CTCF and H3K27ac ChIP-seq profiles of the HOXD centromeric regulatory TAD (C-DOM) in wild-type (WT) and in CBS3 and CBS5 double knockout (ΔCBS3 + 5) homozygous single-cell clones. The left boundary (red-dotted rectangle) comprises a cluster of CTCF sites, CBS1-6, of which CBS3 and CBS5 are in the outward orientation. Arrowheads indicate CBS elements with orientations. b Close-up of CTCF ChIP-seq profiles at the C-DOM left boundary marked by red dotted rectangle in (a). Note the abolishment of CTCF peaks at the locations of CBS3 and CBS5 in the three single-cell deletion clones. c Close-up of CTCF and H3K27ac ChIP-seq profiles at the HOXD cluster in (a). Note that the five reverse-oriented CBS elements are associated with HOXD13 but not with other HOXD genes. d 4C profiles using HOXD13 as an anchor in ΔCBS3 + 5 single-cell clones compared to WT clones, showing increased chromatin interactions with the left boundary and decreased chromatin interactions with the H3K27ac-enriched GT2 or LNPK element upon double knockout. e, f 4C profiles using CBS2 (e) or CBS4 (f) as an anchor confirming increased chromatin interactions with HOXD13. g Expression levels of HOXD genes in three ΔCBS3 + 5 single-cell clones compared to WT clones. Data as mean ± SD, *p < 0.05, **p < 0.01, ***p < 0.001; two-tailed Student’s t test. For each deletion clone, n = 2 biologically independent samples; for their WT controls, n = 4. Source data are provided as a Source Data file. h A boundary model illustrating the role of outward-oriented CTCF sites (CBS elements) in intra-TAD chromatin contacts and gene regulation. TAD boundary normally contains clustered CTCF sites with complex orientations of both divergence and convergence. The outward-oriented CTCF sites function as an important barrier for outside cohesin to ensure proper and balanced intra-TAD chromatin interactions and gene expression.

Similar articles

Cited by

References

    1. Mirny L, Dekker J. Mechanisms of chromosome folding and nuclear organization: their interplay and open questions. Cold Spring Harb. Perspect. Biol. 2022;14:1–20. doi: 10.1101/cshperspect.a040147. - DOI - PMC - PubMed
    1. Phillips JE, Corces VG. CTCF: master weaver of the genome. Cell. 2009;137:1194–1211. doi: 10.1016/j.cell.2009.06.001. - DOI - PMC - PubMed
    1. Hansen AS, Cattoglio C, Darzacq X, Tjian R. Recent evidence that TADs and chromatin loops are dynamic structures. Nucleus. 2018;9:20–32. doi: 10.1080/19491034.2017.1389365. - DOI - PMC - PubMed
    1. Wu Q, Liu P, Wang L. Many facades of CTCF unified by its coding for three-dimensional genome architecture. J. Genet. Genom. 2020;47:407–424. doi: 10.1016/j.jgg.2020.06.008. - DOI - PubMed
    1. Nichols MH, Corces VG. A CTCF code for 3D genome architecture. Cell. 2015;162:703–705. doi: 10.1016/j.cell.2015.07.053. - DOI - PMC - PubMed

Publication types

Associated data