. 2023 Dec 7;14(1):8111.
doi: 10.1038/s41467-023-43841-8.

TAD evolutionary and functional characterization reveals diversity in mammalian TAD boundary properties and function

Affiliations

TAD evolutionary and functional characterization reveals diversity in mammalian TAD boundary properties and function

Mariam Okhovat et al. Nat Commun. .

Abstract

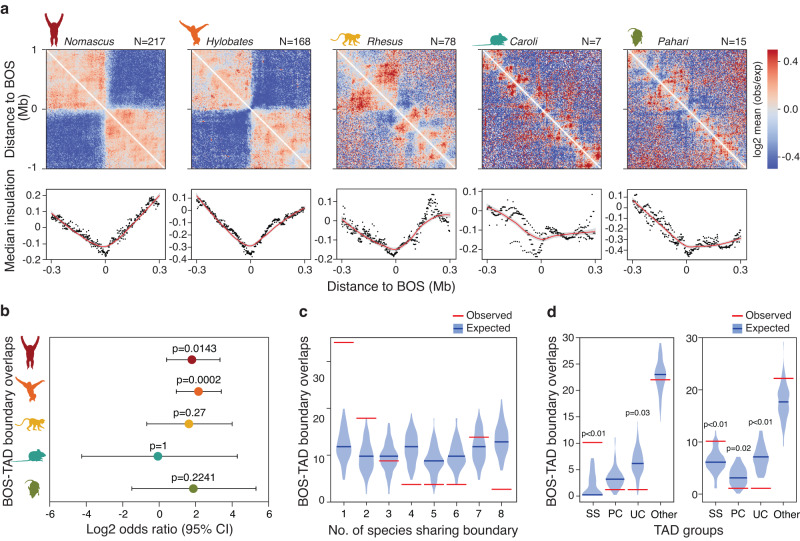
Topological associating domains (TADs) are self-interacting genomic units crucial for shaping gene regulation patterns. Despite their importance, the extent of their evolutionary conservation and its functional implications remain largely unknown. In this study, we generate Hi-C and ChIP-seq data and compare TAD organization across four primate and four rodent species and characterize the genetic and epigenetic properties of TAD boundaries in correspondence to their evolutionary conservation. We find 14% of all human TAD boundaries to be shared among all eight species (ultraconserved), while 15% are human-specific. Ultraconserved TAD boundaries have stronger insulation strength, CTCF binding, and enrichment of older retrotransposons compared to species-specific boundaries. CRISPR-Cas9 knockouts of an ultraconserved boundary in a mouse model lead to tissue-specific gene expression changes and morphological phenotypes. Deletion of a human-specific boundary near the autism-related AUTS2 gene results in the upregulation of this gene in neurons. Overall, our study provides pertinent TAD boundary evolutionary conservation annotations and showcases the functional importance of TAD evolution.


Conflict of interest statement

E.E.E. is a scientific advisory board (SAB) member of Variant Bio, Inc. N.A. is the cofounder and on the scientific advisory board of Regel Therapeutics and receives funding from BioMarin Pharmaceutical Incorporated. The remaining authors declare no competing interests.

Figures

Fig. 1
Fig. 1. Direct multi-species comparisons shed light on the evolutionary conservation of TAD boundaries.
Flowchart of the study design is shown, along with a scheme of the union boundary approach and our evolutionary criteria for annotating human-specific (HS), primate-conserved (PC) and ultraconserved (UC) TAD boundaries. The following artwork is licensed and modified from iStock.com/Alex_Doubovitsky (liver icon), iStock.com/VectorMine (CRISPR icon), iStock.com/Atlas Studio (human icon), iStock.com/Bullet_Chained (gibbon icons), iStock.com/AlonzoDesign (macaque icon), iStock.com/Nedea (mouse, Caroli, Pahari icons), iStock.com/ ~Userba9fe9ab_931 (rat icon).
Fig. 2
Fig. 2. Genetic and epigenetic features of TAD boundaries vary as a function of their evolutionary conservation.
a Heatmaps of Hi-C interaction show differences in genomic interactions across evolutionary TAD boundary groups. b Violin plots show insulation score differences across evolutionary TAD boundary groups in human (left) and mouse (right). Number of boundaries included in each category in the human genome is as follows: nAll = 7401, nUC = 1023, nPC = 491, and nHS = 1130. In the mouse genome, the number of boundaries are nAll = 5354, nUC = 1023, nRC = 115 and nMS = 807. The ends and center lines of boxplots demonstrate the 1st, 2nd (median) and 3rd quartiles, while whiskers represent minimum and maximum insulation scores. P-values are based on two-sided Wilcoxon rank sum test and are only reported when <0.05. In human, WHS vs. All = 5167940, pHS vs. All < 2.2e-16; WHS vs. PC = 338547, p = 2.133e-12; WHS vs. UC = 863127, p < 2.2e-16; WUC vs. All= 2806392, p < 2.2e-16; WUC vs. PCl = 179565, p < 2.2e-16. In mouse, WMS vs. All = 2435686, p = 5.045e-09; WMS vs. UC = 522658, p < 2.2e-16; WUC vs All = 2351016, p = 6.821e-13; WUC vs. RC = 47850, p = 0.001026. c Fold-enrichment of chromatin states at evolutionary TAD boundary groups in human (red) and mouse genome (blue). d Percent of TAD boundaries harboring CTCF binding sites across evolutionary groups. e Class composition of TEs overlapping CTCF binding sites in TAD boundaries is shown for boundaries in the human (left) and mouse genomes (right). Significantly over-represented TE classes based on a negative binomial test are marked with asterisks (***p < 0.0005, **p < 0.005, *p < 0.05). Low abundance TE classes are grouped as “Other”, with only those that are significantly enriched mentioned on top. f Observed/Expected values for TE families significantly over-represented (p < 0.05) at TAD boundary CTCF binding sites. Bar colors represent TE class membership, based on colors used in panel (e). g UCSC genome browser screenshots of a MIR-derived CTCF binding site inside an ultraconserved boundary (left) and an ERV-derived CTCF binding site within human-specific TAD boundary (right). CTCF ChIP-seq fold-enrichment (CTCF-FE) track appears in blue. Hsap human, Mmus mouse, G genome-wide, All All TAD boundaries, US ultraconserved, PC primate-conserved, HS human-specific, RC rodent-conserved, MS mouse-specific; ***p < 0.0005, **p < 0.005, *p < 0.05. No multiple comparisons adjustments were made.
Fig. 3
Fig. 3. BOS are associated with species-specific TAD boundaries.
a Heatmaps show the frequency of genomic interactions around BOS. Dot plots show median insulation scores, along with loess smoothed curves in red. Error bands represent 95% confidence intervals and are shaded in gray. b Log2 odds ratio for the overlap between BOS and TAD boundaries is shown across genomes and error bars represent 95% lower and higher confidence interval. P-values based on Fisher’s exact test without multiple tests adjustments (Nomascus nBOS = 217, hylobates nBOS = 168, rhesus nBOS = 78, caroli nBOS = 7, pahari nBOS = 15). c Violin plots show the expected distribution of cross-species conservation levels of TAD boundaries overlapping BOS in all species (n = 90). Blue lines represent median random expectation, and red lines represent observed values in each category. d Observed and expected frequency distribution of evolutionary conservation level of TAD boundaries overlapping BOS in Nomascus (n = 34) and Hylobates (n = 43) is shown. Blue lines represent the median expected value, and red lines represent the observed value in each category. Empirical p-values are calculated based on one-sided permutation tests. SS Species-specific, PC primate-conserved, US ultraconserved. P-values reported only when <0.05 and no adjustments were made for multiple comparisons.
Fig. 4
Fig. 4. Hearts of B5234−/− mice exhibit changes in Meis2 gene interactions, expression and histology.
a Schema of the deletion in B5234−/− mice. b RT-qPCR reveal increased Meis2 expression in hearts of B5234−/− mice. Data is presented as mean +/- stdev (two-tailed Student’s t-test p-value < 0.0001; n = 3 biological replicates). c Top to bottom, heatmaps correspond to Hi-C matrix of mouse liver, Capture Hi-C of B5234+/+ and B5234−/− hearts, and log2 fold-change of B5234−/− vs. B5234+/+. Difference in TAD boundary annotations from mouse liver are marked with purple bars below. Deleted ultraconserved boundary is shaded gray. d H&E staining of longitudinal sections of B5234−/− and B5234+/+ mouse hearts show differences in LV compaction (blue arrow) and trabecular structures (black arrows). e Box and whisker blot based on H&E images confirms increased compaction (decreased extracellular space) in hearts of B5234−/− in comparison to B5234+/+ mouse hearts. The ends and center line of the box represent 1st, 2nd (median) and 3rd quartiles. Whiskers extend to minimum and maximum values (two-tailed Student’s t-test p-value = 0.0004; n = 4 per genotype). LV Left ventricle, RV Right ventricle, LA Left atrium, RA Right atrium. No p-value adjustments were made for multiple comparisons.
Fig. 5
Fig. 5. iPSC-differentiated B14804−/− neurons have lower AUTS2 expression and higher local insulation score.
a Flowchart shows steps involved in generating B14804−/− neurons. b Differentiated B14804 cells show higher expression of neuronal markers, MAP2 and TUBB3. B14804−/−neurons show no change in HPRT1 expression but have higher AUTS2 expression based on two-tailed Student’s t-test. Data presented as mean ± stdev (n = 2 biological replicates, measured over 3 technical replicates). P-values were not adjusted for multiple comparisons. c A local increase in insulation score (i.e., more interaction passing) is observed at the AUTS2 locus downstream of the B14804 deletion.

Update of

References

    1. Pombo A, Dillon N. Three-dimensional genome architecture: players and mechanisms. Nat. Rev. Mol. Cell Biol. 2015;16:245–257. doi: 10.1038/nrm3965. - DOI - PubMed
    1. Rao SS, et al. A 3D map of the human genome at kilobase resolution reveals principles of chromatin looping. Cell. 2014;159:1665–1680. doi: 10.1016/j.cell.2014.11.021. - DOI - PMC - PubMed
    1. Hong S, Kim D. Computational characterization of chromatin domain boundary-associated genomic elements. Nucleic Acids Res. 2017;45:10403–10414. doi: 10.1093/nar/gkx738. - DOI - PMC - PubMed
    1. Hnisz D, et al. Activation of proto-oncogenes by disruption of chromosome neighborhoods. Science. 2016;351:1454–1458. doi: 10.1126/science.aad9024. - DOI - PMC - PubMed
    1. Lupianez DG, et al. Disruptions of topological chromatin domains cause pathogenic rewiring of gene-enhancer interactions. Cell. 2015;161:1012–1025. doi: 10.1016/j.cell.2015.04.004. - DOI - PMC - PubMed

Publication types

Associated data