. 2023 Dec 7;14(1):8097.
doi: 10.1038/s41467-023-43820-z.

SEMA6A drives GnRH neuron-dependent puberty onset by tuning median eminence vascular permeability

Affiliations

SEMA6A drives GnRH neuron-dependent puberty onset by tuning median eminence vascular permeability

Antonella Lettieri et al. Nat Commun. .

Abstract

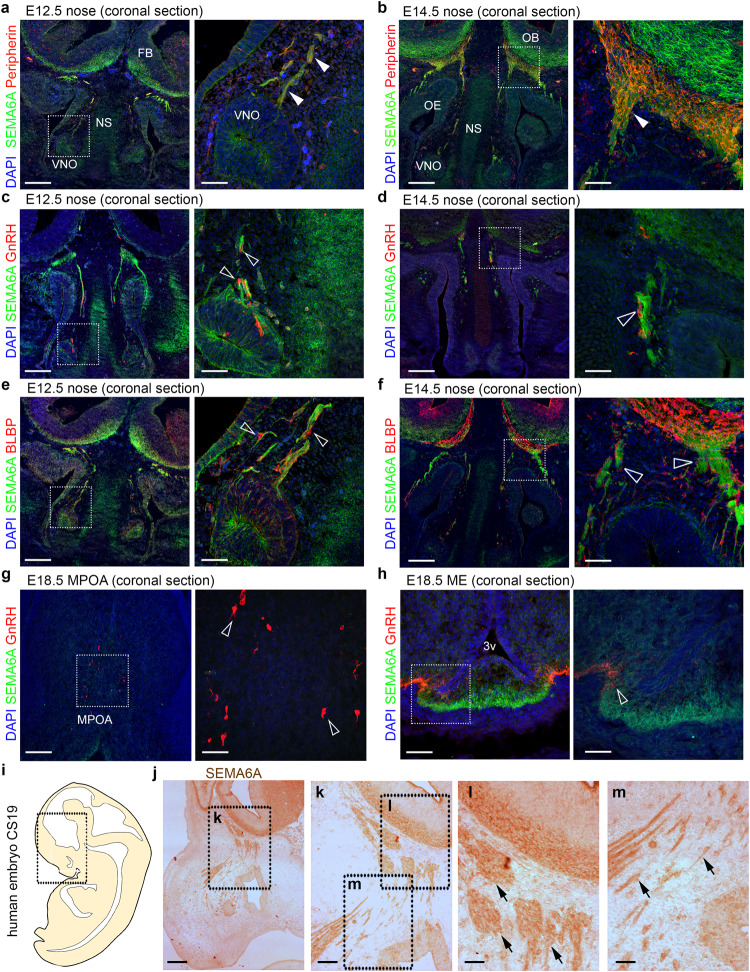
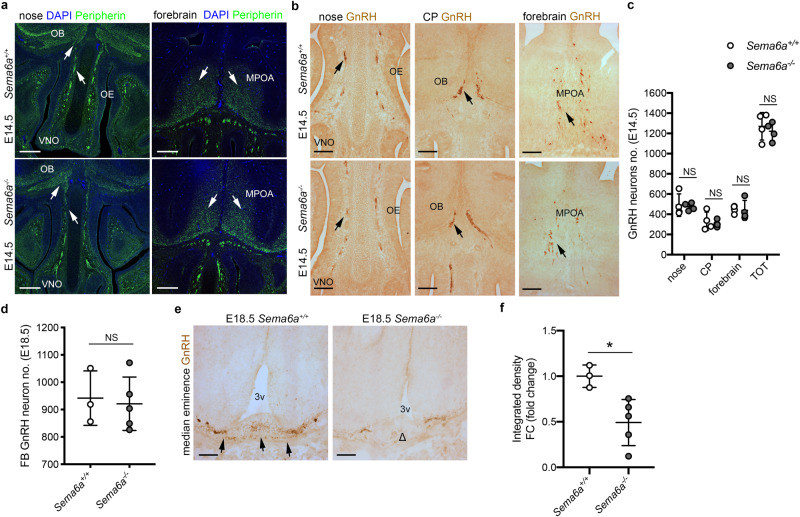
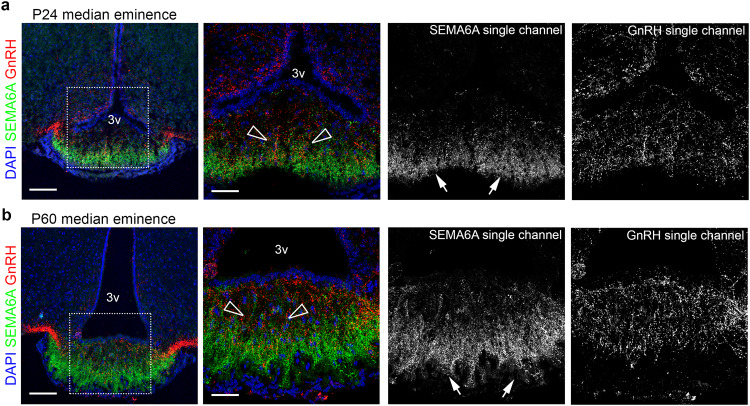
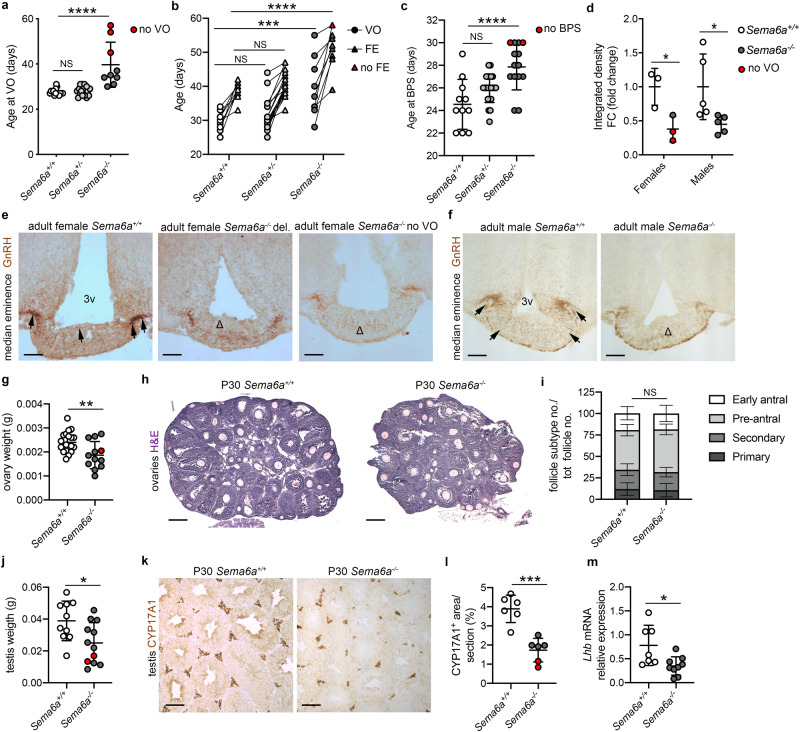
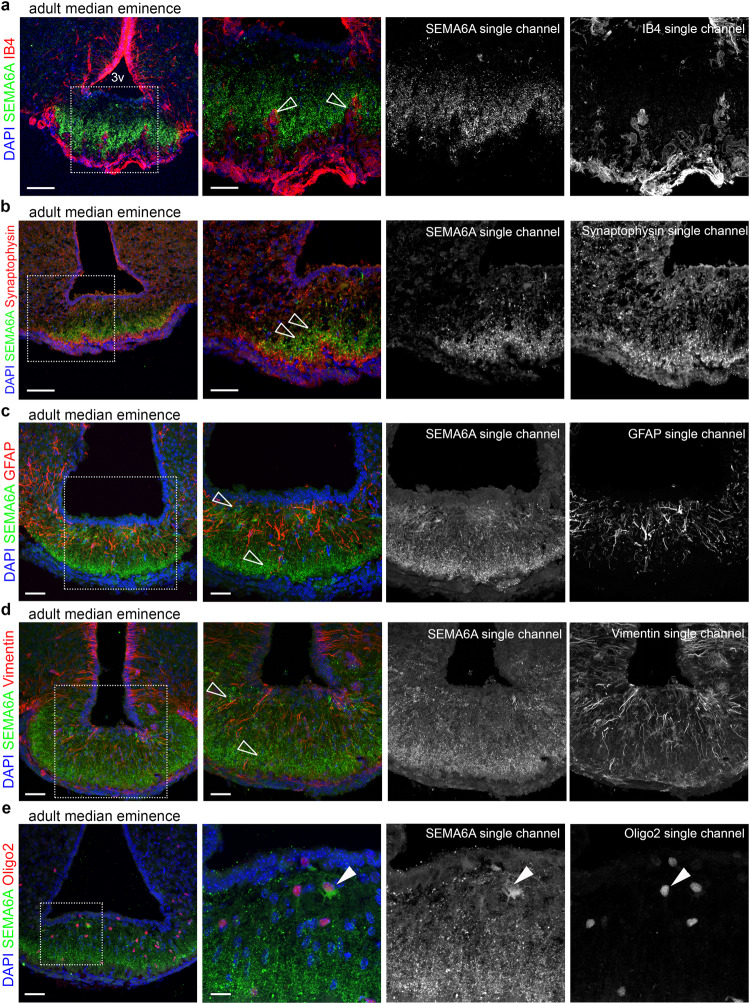
Innervation of the hypothalamic median eminence by Gonadotropin-Releasing Hormone (GnRH) neurons is vital to ensure puberty onset and successful reproduction. However, the molecular and cellular mechanisms underlying median eminence development and pubertal timing are incompletely understood. Here we show that Semaphorin-6A is strongly expressed by median eminence-resident oligodendrocytes positioned adjacent to GnRH neuron projections and fenestrated capillaries, and that Semaphorin-6A is required for GnRH neuron innervation and puberty onset. In vitro and in vivo experiments reveal an unexpected function for Semaphorin-6A, via its receptor Plexin-A2, in the control of median eminence vascular permeability to maintain neuroendocrine homeostasis. To support the significance of these findings in humans, we identify patients with delayed puberty carrying a novel pathogenic variant of SEMA6A. In all, our data reveal a role for Semaphorin-6A in regulating GnRH neuron patterning by tuning the median eminence vascular barrier and thereby controlling puberty onset.


Conflict of interest statement

The authors declare no competing interests.

Figures

Fig. 1
Fig. 1. SEMA6A is expressed in territories relevant for embryonic GnRH neuron development.
Coronal sections of E12.5 (a) and E14.5 (b) mouse heads at the nose level were immunolabelled for SEMA6A (green) and Peripherin (red). Solid arrowheads indicate examples of Peripherin-positive axons that express SEMA6A at the VNO level and in the nasal parenchyma. Coronal sections of E12.5 (c) and E14.5 (d) mouse heads at the nose level were immunolabelled for SEMA6A (green) and GnRH (red). Empty arrowheads indicate examples of GnRH neurons that lack SEMA6A expression at the VNO level and in the nasal parenchyma. Coronal sections of E12.5 (e) and E14.5 (f) mouse heads at the nose level were immunolabelled for SEMA6A (green) and BLBP (red). Empty arrowheads indicate examples of OECs that lack SEMA6A expression at the VNO level and in the nasal parenchyma. Coronal sections of E18.5 mouse brains at the MPOA (g) and ME (h) levels were immunolabelled for SEMA6A (green) and GnRH (red). Empty arrowheads indicate examples of GnRH neurons that lack SEMA6A expression in the cell body (g) and neurite (h). Sagittal view of a CS19 human embryo in a schematic drawing (i) and sagittal sections of schematics squared area immunolabeled for SEMA6A (jm). Black arrows indicate examples of SEMA6A-expressing axons in the nasal parenchyma. Sections in (ah) were counterstained with DAPI. Dotted boxes indicate areas shown at higher magnification next to the corresponding panel. Abbreviations: VNO vomeronasal organ, NS nasal septum, FB forebrain, OE olfactory epithelium, OB olfactory bulb, MPOA medial preoptic area, ME median eminence, 3v third ventricle, CS Carnegie Stage. Scale bars: 500 μm (j), 250 μm (k), 200 μm (a, c, e, g, low magnifications), 125 μm (l, m), 100 μm (h, low magnification), 50 μm (a, c, e, g, h, high magnifications).
Fig. 2
Fig. 2. SEMA6A loss does not impair nasal axon patterning and GnRH neuron migration, but reduces GnRH innervation of the ME.
a Coronal sections of E14.5 mouse heads of the indicated genotypes at the level of the nose and forebrain were immunolabeled for Peripherin (green) to mark nasal axons. White arrows indicate normal nasal axon development in the nose and normal TN fibers in the MPOA. Sections were counterstained with DAPI. b Coronal sections of E14.5 mouse heads with the indicated genotypes were immunolabelled for GnRH. Black arrows indicate examples of normal GnRH neuron distribution in the nasal parenchyma at the CP and in the forebrain. c Quantification of the distribution and total number of GnRH neuron in E14.5 heads (n = 4 per group; nose p = 0.7974, CP p = 0.6360, forebrain p = 0.8596, TOT p = 0.5670). d Quantification of GnRH neuron number in E18.5 brains (from OB to MPOA) (Sema6a+/+: n = 3; Sema6a-/-: n = 5; p = 0.7819). e Coronal sections of E18.5 brains with the indicated genotypes at the level of the ME were immunolabelled for GnRH. Black arrows indicate normal presence of GnRH neuron axon terminals in Sema6a+/+ embryos, whereas the decreased presence of GnRH neuron axon terminals is indicated with Δ. f Quantification of GnRH intensity at ME in E18.5 brains (Sema6a+/+: n = 3; Sema6a-/-: n = 5; p = 0.0189). *p < 0.05 and NS (not significant) after two-tailed unpaired Student’s t test. Abbreviations: VNO vomeronasal organ, OE olfactory epithelium, OB olfactory bulb, CP cribriform plate, FB forebrain, MPOA medial preoptic area, 3 v third ventricle. Scale bars: 200 μm (a), 125 μm (b, e). Data are presented as mean ± SD. Source data are provided as a Source Data file.
Fig. 3
Fig. 3. SEMA6A is expressed in the postnatal ME in close proximity to GnRH neuron terminals.
Coronal sections of P24 (a) and P60 (b) ME were immunolabelled for SEMA6A (green) and GnRH (red) to reveal GnRH axon terminals. White boxes in (a, b) indicate areas shown at higher magnification in the adjacent panels together with single channels for SEMA6A and GnRH. Empty arrowheads indicate examples of GnRH neuron axon terminals that lack SEMA6A expression. White arrows indicate the expression of SEMA6A in the basal part of the ME. All sections were counterstained with DAPI. Abbreviations: 3v, third ventricle. Scale bars: 100 μm (low magnifications), 50 μm (high magnifications).
Fig. 4
Fig. 4. SEMA6A loss delays puberty and gonadal maturation in female and male mice.
a Age at VO in adult females of indicated genotypes (Sema6a+/+ n = 15; Sema6a+/- n = 17; Sema6a-/- n = 9. Sema6a+/- p = 0.9376, Sema6a-/- p < 0.0001 and delayed Sema6a-/- only p < 0.0001 vs. Sema6a+/+). Red dots indicate Sema6a-/- females without VO at sacrifice. b Ages at VO and FE in adult females of indicated genotypes (Sema6a+/+ n = 9; Sema6a+/- n = 18; Sema6a-/- n = 9. VO: Sema6a+/- p = 0.5186 and Sema6a-/- p = 0.0002 vs. Sema6a+/+. FE: Sema6a+/- p = 0.5550 and Sema6a-/- p < 0.0001 vs. Sema6a+/+). Red triangle indicates Sema6a-/- female without FE at sacrifice. c Age at BPS in adult males of indicated genotypes (Sema6a+/+ n = 11; Sema6a+/- n = 22; Sema6a-/- n = 14. Sema6a+/- p = 0.0615 and Sema6a-/- p < 0.0001 vs. Sema6a+/+). Red dots indicate Sema6a-/- males without BPS at sacrifice. d Quantification of ME innervation (as in e, f) in adult female and male brains at VO/BPS revealed a significant decreased GnRH staining in Sema6a-/- compared to Sema6a+/+ in both sexes (females: n = 3 per group; p = 0.0311 males: n = 5 per group; p = 0.0389). Red dots indicate Sema6a-/- females without VO. Coronal sections of female (e) and male (f) ME immunolabelled for GnRH. Presence of GnRH neuron axon terminals in Sema6a+/+ brains (black arrows) is reduced in Sema6a-/- (Δ). gi Weight (g) and H&E histological analysis (h) of adult female ovaries. Sema6a-/- mice exhibited significantly smaller ovaries (Sema6a+/+ n = 20, Sema6a-/- n = 12; p = 0.0049) but normal folliculogenesis (i, n = 6 per group; primary p = 0.7666, secondary p = 0.6837, pre-antral p = 0.3500, early antral p = 0.8205). Red dot indicates Sema6a-/- female without FE. jl Weight (j) and immunostaining for Leydig cell marker CYP17A1 (k) of adult male testes. Sema6a-/- mice exhibited significant smaller testes (Sema6a+/+ n = 10, Sema6a-/- n = 12) and reduced number of Leydig cell evaluated as CYP17A1+ area (l, n = 6 per group; p = 0.0002). Red dots indicate Sema6a-/- males without BPS at sacrifice. m RT-qPCR analysis for Lhb transcript in male pituitaries (Sema6a+/+ n = 7, Sema6a-/- n = 9; p = 0.0161) calculated relative to controls using Gapdh-normalized Cq threshold values. *p < 0.05, **p < 0.01, ***p < 0.001, ****p < 0.0001 and NS (not significant) after One- (a, c) or Two-way (b) ANOVA followed by Dunnett’s post-hoc test, or Two-tailed unpaired Student’s t test (d, g, i, j, l, m) Abbreviations: VO vagina opening, FE first estrous, BPS balanopreputial separation, 3v third ventricle, del. delayed. Scale bars: 500 μm (h), 250 μm (e, f, k). Data are presented as mean ± SD. Source data are provided as a Source Data file.
Fig. 5
Fig. 5. SEMA6A is detected in OLs in the ME and not by other cell types composing the NGE unit.
ae Coronal sections of adult ME were immunolabelled for SEMA6A (green) together with IB4, Synaptophysin, GFAP, Vimentin and Oligo2 (red) to label blood vessels, neuroendocrine neurons, astrocytes, tanycytes and oligodendrocytes, respectively. White boxes indicate areas shown at higher magnification next to each corresponding panel together with single channels for SEMA6A and different cell markers. Empty arrowheads indicate examples of blood vessels penetrating in the ME that lack SEMA6A expression (a) and the lack of SEMA6A expression on neuroendocrine axon terminals (b), astrocytes (c), tanycytes (d). Solid arrowheads indicate the expression of SEMA6A on oligodendrocytes (e). All sections were counterstained with DAPI. Abbreviations: 3v third ventricle. Scale bars: 100 μm (a, b low magnifications), 50 μm (a, b, high magnifications; ce, low magnifications), 25 μm (c, d, high magnifications), 12 μm (e, high magnification).
Fig. 6
Fig. 6. Abluminal SEMA6A regulates vascular permeability via Plexin-A2.
a Schematic of vascular permeability measurement by TEER. Apical (red) and basal (blue) compartments represent luminal and parenchymal sides of a blood vessel, respectively. Created with BioRender.com. b TEER quantification in mBECs apically (red) or basally (blue) treated with conditioned media from SEMA6AECTO or mock-transfected COS-7 cells. TEER values are expressed as percentage of TEER at T0, ranging 46–80 Ωcm2. Graph shows one out of n = 2 independent experiments (n = 3 per group; SEMA6AECTO basal vs mock basal: 30 min p = 0.9982, 60 min p = 0.0653, 120 min p = 0.0314, 180 min p = 0.0078, 240 min p = 0.0508). ce scRNA-seq analysis of adult mBECs from the EC atlas dataset. UMAP plots show distinct cell types and Plxna2 transcript levels (c). Violin plots compare Plxna2 transcript levels in different EC subsets (d). Plxna1, Plxna3 and Plxna4 transcripts could not be detected (ND) in any EC subpopulation (e). f, g X,y maximum intensity projections (MIP) of mBECs immunolabelled for Plexin-A2 (green) and luminal EC marker ICAM-2 (red) counterstained with DAPI, including control staining for the secondary antibody used to detect Plexin-A2 (anti-goat). Yellow line indicates the single optical y,z cross section displayed on the side (f). 3D surface rendering of the z-stack used to generate the x,y MIP is shown in (g). h TEER quantification in HUVECs treated basally with conditioned media from SEMA6AECTO or mock-transfected COS-7 cells, following knockdown of PLXNA2 (shRNA B, green; C, orange) or in controls (shScr, blue). TEER values are expressed as percentage of TEER at T0, ranging 36–44 Ωcm2. Graph shows one out of n = 2 independent experiments (n = 3 per group). * refers to SEMA6AECTO vs mock (shScr: 30 min p = 0.0001, 60–240 min p < 0.0001. shPLXNA2 (B): 30 min p = 0.0517, 60 min p = 0.9994, 120 min p = 0.3132, 180 min p = 0.8817, 240 min p = 0.1738; shPLXNA2 (C): 30 min p > 0.9999, 60 min p = 0.5015, 120 min p = 0.7981, 180 min p = 0.0149, 240 min p = 0.0089.). # refers to SEMA6AECTO shScr vs SEMA6AECTO shPLXNA2 (shPLXNA2 (B): 30 min p = 0.2205, 60–180 min p < 0.0001, 240 min p = 0.0051; shPLXNA2 (C): 30 min p = 0.0006, 60–180 min p < 0.0001, 240 min p = 0.0049.) *p < 0.05, ** or ##p < 0.01, *** or ###p < 0.001 and **** or ####p < 0.0001 after Two-way ANOVA followed by Tukey post-hoc test. Scale bars: 8 μm (f). Abbreviations: mBECs mouse brain endothelial cells, aECs arterial ECs, cECs capillary ECs, vECs venous ECs, fECs fenestrated capillary ECs, UMAP uniform manifold approximation and projection, ND not detected. Data are presented as mean ± SD. Source data are provided as a Source Data file.
Fig. 7
Fig. 7. SEMA6A loss prevents ME barrier opening and induces structural rearrangements in the ME capillary bed.
a Coronal sections of adult ME were immunolabelled for Plexin-A2 (green) together with PECAM1 (red) to label blood vessels. The white box indicates the area shown at higher magnification next to each corresponding panel together with single channels for Plexin-A2 and PECAM1. Solid arrowheads indicate the expression of Plexin-A2 on capillaries of the basal portion of the ME. b Coronal sections of brains from EB-injected females of the indicated genotypes. White boxes indicate areas shown at higher magnification next to each corresponding panel. Δ indicates areas of no EB leakage in Sema6a-/- ME parenchyma. c Quantification of EB diffusion in the ME parenchyma of female brains (n = 5 per group; p = 0.0212). d Coronal sections of female brains with the indicated genotypes were immunolabelled for PLVAP (green) to reveal capillary loops invading the ME parenchyma. White boxes indicate areas shown at higher magnification next to each corresponding panel together with a single channel for PLVAP. White arrows or Δ indicate the normal or decreased presence of capillary loops in Sema6a+/+ and Sema6a-/- ME parenchyma, respectively. e Quantification of capillary loops in the ME of female brains (n = 3 per group; p = 0.0230). All sections were counterstained with DAPI. *p < 0.05 after two-tailed unpaired Student’s t test. Abbreviations: 3v third ventricle, EB Evans Blue. Scale bars: 100 μm (b, d low magnifications), 50 μm (a, low magnification; b and d, high magnifications), 25 μm (a, high magnification). Data are presented as mean ± SD. Source data are provided as a Source Data file.
Fig. 8
Fig. 8. Exome sequencing identifies a SEMA6A variant with effects on protein stability in DP patients.
a Family tree of proband A (III.2, arrow) presenting DP. Symbols: DP phenotype (black), unknown phenotype (gray); unaffected individual (white). Horizontal black lines indicate the presence of heterozygous p.I423T variant identified by WES and verified by Sanger sequencing. US signifies that DNA was unavailable for sequencing. b Chromosome (Chr) position, nucleotide substitution (nt sub), amino acid substitution (aa sub), and bioinformatic predictions of the p.I423T SEMA6A variant according to Poly-Phen, SIFT, REVEL and CADD software. c Partial protein sequence alignment of vertebrate SEMA6A orthologs shows that I423 conservation in mouse and zebrafish. d Genomic evolutionary rate profiling of sequence constraint for SEMA6A variant using GERP + + analysis (RS score = 6.0). Side (e) and top (f) 3D views of modeled human SEMA6A monomer. Red asterisks indicate the I423 residue within the central cavity of SEMA domain 6th beta-propeller blade. g High magnification images of I423 and T423 residues and their interactions. h Lysates from untransfected (UT) COS-7 cells and cells transfected with an empty control expression vector (CTRL) or vectors encoding c-myc tagged human SEMA6AWT or mutant SEMA6AI423T were immunoblotted for c-myc to recognize human (SEMA6A: 120 kDa). GAPDH (37 kDa) was used as a loading control. i Quantification of relative abundance of SEMA6AI423T protein compared to SEMA6AWT after normalization with GAPDH (n = 3 independent experiments; p < 0.0001). j COS-7 cells transfected with vectors encoding c-myc tagged SEMA6AWT or SEMA6AI423T were immunolabeled for c-myc (green) and F-actin (red). Solid arrowheads indicate cell surface SEMA6AWT expression, whereas empty arrowheads indicate lack of surface SEMA6AI423T but intracellular and perinuclear expression. k COS-7 cells co-transfected with vectors encoding SEMA6AI423T and ER-emerald, visualizing ER (green), were immunolabeled for c-myc (red) and counterstained with DAPI. Solid arrowheads indicate examples of SEMA6AI423T ER retention. ****p < 0.0001 after two-tailed unpaired Student’s t test. Abbreviations: ER endoplasmic reticulum. Scale bars: 50 μm (j, k). Data are presented as mean ± SD. Source data are provided as a Source Data file.
Fig. 9
Fig. 9. SEMA6A modulates GnRH neuron homeostasis by tuning ME vascular permeability.
Schematic drawing representing the proposed cellular mechanisms through which SEMA6A is expressed by OLs to modulate GnRH homeostasis. In the ME of WT mice, SEMA6A (green dots) is produced by OLs (green cells) and distributed close to fenestrated ECs (red cells). In our model, SEMA6A acts on fenestrated ECs expressing Plexin-A2 (blue receptors) to increase the number of capillary loops in the brain parenchyma and maintain a permissive vascular barrier (1). Such permissive vascular barrier may ensure optimal GnRH peptide (gray dots) release in ME blood vessels either directly (2) or indirectly, via entry of molecules from the periphery (e.g., IGF-1, FGF-21; black triangles) in the ME (3) where they can act on GnRH neurons (in gray), by modulating the extension of axon terminals towards ME and ECs (4). This mechanism will ensure a normal release of GnRH peptide (5) (gray dots) and therefore a physiological puberty onset. Conversely, in Sema6a-/- mice, the lack of SEMA6A production by OLs (gray cells) in the basal part of the ME leads to fewer capillary loops and reduced vascular permeability. Consequently, direct GnRH release to the pituitary or entry of peripheral signals that normally sustain axon terminal elongation and GnRH secretion do not occur, resulting in a less innervated ME and ultimately in delayed puberty onset. Created with BioRender.com.

References

    1. Herbison AE. Control of puberty onset and fertility by gonadotropin-releasing hormone neurons. Nat. Rev. Endocrinol. 2016;12:452–466. doi: 10.1038/nrendo.2016.70. - DOI - PubMed
    1. Abreu AP, Kaiser UB. Pubertal development and regulation. Lancet. Diabetes Endocrinol. 2016;4:254–264. doi: 10.1016/S2213-8587(15)00418-0. - DOI - PMC - PubMed
    1. Wierman ME, Kiseljak-Vassiliades K, Tobet S. Gonadotropin-releasing hormone (GnRH) neuron migration: initiation, maintenance and cessation as critical steps to ensure normal reproductive function. Front. Neuroendocrinol. 2011;32:43–52. doi: 10.1016/j.yfrne.2010.07.005. - DOI - PMC - PubMed
    1. Cho H-J, Shan Y, Whittington NC, Wray S. Nasal placode development, GnRH neuronal migration and kallmann syndrome. Front. Cell Dev. Biol. 2019;7:1–27. doi: 10.3389/fcell.2019.00121. - DOI - PMC - PubMed
    1. Prevot V, et al. Definitive evidence for the existence of morphological plasticity in the external zone of the median eminence during the rat estrous cycle: implication of neuro-glio-endothelial interactions in gonadotropin-releasing hormone release. Neuroscience. 1999;94:809–819. doi: 10.1016/S0306-4522(99)00383-8. - DOI - PubMed

Publication types

Associated data