. 2023 Dec 7;9(1):93.
doi: 10.1038/s41522-023-00462-9.

Periodontitis salivary microbiota exacerbates colitis-induced anxiety-like behavior via gut microbiota

Affiliations

Periodontitis salivary microbiota exacerbates colitis-induced anxiety-like behavior via gut microbiota

Jun Qian et al. NPJ Biofilms Microbiomes. .

Abstract

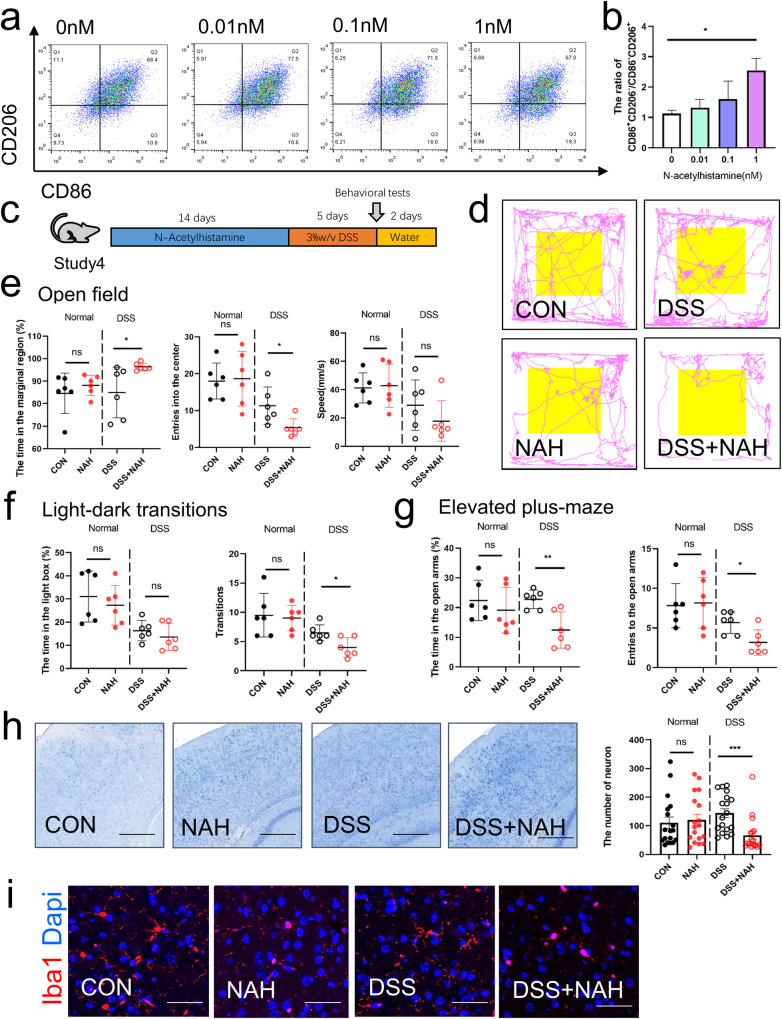
The gut-brain axis is a bidirectional communication system between the gut and central nervous system. Many host-related factors can affect gut microbiota, including oral bacteria, making the brain a vulnerable target via the gut-brain axis. Saliva contains a large number of oral bacteria, and periodontitis, a common oral disease, can change the composition of salivary microbiota. However, the role and mechanism of periodontitis salivary microbiota (PSM) on the gut-brain axis remain unclear. Herein, we investigated the nature and mechanisms of this relationship using the mice with dextran sulfate sodium salt (DSS)-induced anxiety-like behavior. Compared with healthy salivary microbiota, PSM worsened anxiety-like behavior; it significantly reduced the number of normal neurons and activated microglia in DSS mice. Antibiotic treatment eliminated the effect of PSM on anxiety-like behavior, and transplantation of fecal microbiota from PSM-gavaged mice exacerbated anxiety-like behavior. These observations indicated that the anxiety-exacerbating effect of PSM was dependent on the gut microbiota. Moreover, the PSM effect on anxiety-like behavior was not present in non-DSS mice, indicating that DSS treatment was a prerequisite for PSM to exacerbate anxiety. Mechanistically, PSM altered the histidine metabolism in both gut and brain metabolomics. Supplementation of histidine-related metabolites had a similar anxiety-exacerbating effect as that of PSM, suggesting that histidine metabolism may be a critical pathway in this process. Our results demonstrate that PSM can exacerbate colitis-induced anxiety-like behavior by directly affecting the host gut microbiota, emphasizing the importance of oral diseases in the gut-brain axis.


Conflict of interest statement

The authors declare no competing interests.

Figures

Fig. 1
Fig. 1. Periodontitis salivary microbiota exacerbate anxiety-like behavior in dextran sulphate sodium (DSS) mice.
a Principal coordination analysis of the healthy salivary microbiota (HSM) and periodontitis salivary microbiota (PSM) (Bray-Curtis; HSM:n = 10, PSM:n = 9). b α-diversity (Shannon, and observed species) of HSM and PSM; each box plot represents the median, interquartile range, minimum, and maximum values (Wilcoxon). c Composition of the gut microbiota at the phylum level in HSM and PSM. d Composition of the gut microbiota at the family level in HSM and PSM groups. e The discriminative biomarkers in the group of HSM (bule) and PSM (red) according to the LEfSe analysis. f Schematic representation and study design. A detailed description is provided in study 1 of the Methods section (n = 6 per group). g Representative image of the open-field track diagram. h Time spent in the marginal region, speed in the marginal region, and frequency of entering the centre zone in the open field. i Time spent in the light box and the frequency of light-dark transitions. j Time spent in the open arm and the number of times the subjects entered the open arms in the elevated plus-maze. Statistical analysis was performed by the ordinary one-way ANOVA test with Tukey’s correction. Results are shown as mean ± standard error of mean. *p < 0.05, **p < 0.01, ***p < 0.001.
Fig. 2
Fig. 2. Gut microbiota is key in periodontitis, and salivary microbiota exacerbate dextran sulphate sodium-induced anxiety-like behavior.
a Study design for study 2. A detailed description is provided in the Methods section (n = 6 per group). b Representative image of the open-field track diagram after antibiotic treatment. c Time spent in the marginal region, speed in the marginal region, and number of times entering the centre zone in the open field. d Time spent in the light box and frequency of light-dark transitions. e Time spent in the open arm and the number of times the mice entered the open arms in the elevated plus-maze. f Schematic representation and study design of faecal microbiota transplantation. The faecal microbiota was from study 1. The details are presented in the Methods section (n = 6 per group). g Representative open-field track diagram of the faecal microbiota transplantation. h Time spent in the marginal region, the frequency of the mice entered the centre zone, and speed in the marginal region in the open field. i Time spent in the light box and frequency of light-dark transitions. j Time in the open arm and the number of times the mice entered the open arms in the elevated plus-maze. Statistical analysis was performed by the ordinary one-way ANOVA test with Tukey’s correction. Results are shown as mean ± standard error of mean. *p < 0.05, **p < 0.01.
Fig. 3
Fig. 3. Periodontitis salivary microbiota reduce neuronal numbers and activate cerebral cortex microglia via gut microbiota.
a Representative image of Nissl staining and the number of neurons in the CON, DSS, H-DSS, and P-DSS groups, scale bar = 150 μm. b Representative image of iba1 (red) and DAPI (blue) staining of microglial cells in the CON, DSS, H-DSS, and P-DSS groups, scale bar = 50 μm. c Representative image of Nissl staining and number of neurons after antibiotic treatment in the H-ABX and P-ABX groups, scale bar = 150 μm. d Representative image of iba1 (red) and DAPI (blue) staining of microglial cells in the H-ABX and P-ABX groups, scale bar = 50 μm. e Representative image of Nissl staining and the number of neurons after faecal microbiota transplantation, scale bar = 150 μm. f Representative image of iba1 (red) and DAPI (blue) staining of microglial cells in the faecal microbiota transplantation experiment, scale bar = 50 μm. Statistical analysis was performed by the one-way ANOVA test with Tukey’s correction (a, e) and two-tailed t test (c). Results are shown as mean ± standard error of mean. *p < 0.05, ***p < 0.001. n = 6 per group; For normal neurons counting,6 mice per group, and 3 views of the same site were selected for each mouse to be counted.
Fig. 4
Fig. 4. Periodontitis salivary microbiota alter the composition of gut microbiota.
a α-Diversity (Shannon, observed species) of bacterial species in the H-DSS and P-DSSgroups; each box plot represents the median, interquartile range, minimum, and maximum values (Wilcoxon; n = 6 per group). b Principal coordination analysis of the H-DSS and P-DSS groups (Bray-Curtis). c Composition of the gut microbiota at the phylum level in the H-DSS and P-DSS groups. d Composition of the gut microbiota at the family level in the H-DSS and P-DSS groups. e The discriminative biomarkers in the group of H-DSS (bule) and P-DSS (red) groups indicated by LEfSe analysis. f Important bacteria based on the random forest analysis. g Functional prediction of gut microbiota according to PICRUSt2 in the H-DSS and P-DSS groups.
Fig. 5
Fig. 5. Alteration of gut metabolites after gavage with periodontitis salivary microbiota.
a OPLS-DA score plots of positive and negative ion modes (n = 5 per group). b Z-score analysis showing metabolite expression in the P-DSS and H-DSS groups. c Spearman correlation coefficient analysis of the different metabolites in the P-DSS and H-DSS groups. d Enrichment analysis of the gut metabolites in the P-DSS and H-DSS groups. The impact of the pathway shown on the horizontal axis. e Network for different metabolites and their pathways. Each blue plot represents a pathway and the size of the blue plot means the number of metabolites contained in the pathway. The other plot represents the metabolite and the colour of the other plot represents the log2(FC) of the P-DSS group to the H-DSS group.
Fig. 6
Fig. 6. Periodontitis salivary microbiota led to alterations in brain metabolism.
a OPLS-DA score plots of positive and negative ion modes (n = 5 per group). b Scatter diagram of metabolite set enrichment analysis. Each plot represents a pathway, plotted by pathway impact on the horizontal axis and log(p) on the vertical axis. c Heat map of differential metabolite expression between the P-DSS and H-DSS groups in brain metabolism. d Enrichment analysis of brain metabolites in the P-DSS and H-DSS groups. e Expression of histamine-related metabolites in the brain, including N-Methylhistamine and N-Acetyl-L-histidine. f Expression of N-acetylhistamine in the gut. Statistical analysis was performed by the two-tail t test.
Fig. 7
Fig. 7. N-acetylhistamine may be a mediator of PSM that promote anxiety through the gut-brain axis.
a Representative flow cytometry plots of CD86 and CD206 expression in BV-2 cells. b Ratio of CD86+CD206/CD86CD206+ of BV-2 cells at 0,0.01,0.1 and 1 nM concentrations of N-acetylhistamine treatment (n = 4). c Study design of study 4. A detailed description is provided in the Methods section. d Representative image of the open-field track diagram after N-acetylhistamine treatment (n = 6 per group). e Time spent in the marginal region, frequency of the mice entered the centre zone, and speed in the marginal region in the open field. f Time spent in the light box and frequency of light-dark transitions. g Time spent in the open arm and the frequency of the mice entered the open arms in the elevated plus-maze. h Representative image of Nissl staining and the number of neurons in the N-acetylhistamine treatment experiment, scale bar = 150 μm (For normal neurons counting,6 mice per group, and 3 views of the same site were selected for each mouse to be counted). i Representative image of iba1 (red) and DAPI (blue) staining of microglial cells in the N-acetylhistamine treatment experiment, scale bar = 50 μm. Statistical analysis was performed by the one-way ANOVA test with Tukey’s correction (b) and two-tailed t test (eh). Results are shown as mean ± standard error of mean. *p < 0.05, **p < 0.01, ***p < 0. 001.

Similar articles

Cited by

References

    1. Agirman G, Yu KB, Hsiao EY. Signaling inflammation across the gut-brain axis. Science. 2021;374:1087–1092. doi: 10.1126/science.abi6087. - DOI - PubMed
    1. Foster JA. Modulating brain function with microbiota. Science. 2022;376:936–937. doi: 10.1126/science.abo4220. - DOI - PubMed
    1. Needham BD, et al. A gut-derived metabolite alters brain activity and anxiety behaviour in mice. Nature. 2022;602:647–653. doi: 10.1038/s41586-022-04396-8. - DOI - PMC - PubMed
    1. Margolis KG, Cryan JF, Mayer EA. The microbiota-gut-brain axis: from motility to mood. Gastroenterology. 2021;160:1486–1501. doi: 10.1053/j.gastro.2020.10.066. - DOI - PMC - PubMed
    1. Sharon G, Sampson TR, Geschwind DH, Mazmanian SK. The Central Nervous System and the Gut Microbiome. Cell. 2016;167:915–932. doi: 10.1016/j.cell.2016.10.027. - DOI - PMC - PubMed

LinkOut - more resources