. 2023 Dec 8;7(1):127.
doi: 10.1038/s41698-023-00478-6.

Endometrial cancer PDX-derived organoids (PDXOs) and PDXs with FGFR2c isoform expression are sensitive to FGFR inhibition

Affiliations

Endometrial cancer PDX-derived organoids (PDXOs) and PDXs with FGFR2c isoform expression are sensitive to FGFR inhibition

Asmerom T Sengal et al. NPJ Precis Oncol. .

Abstract

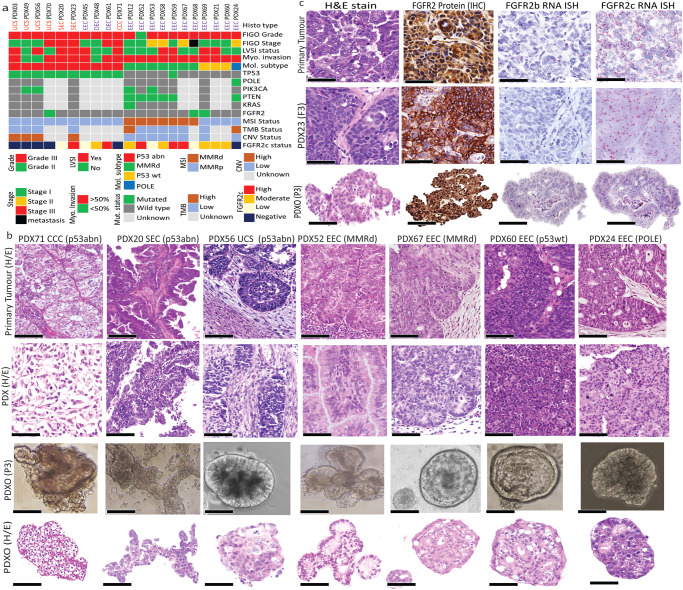
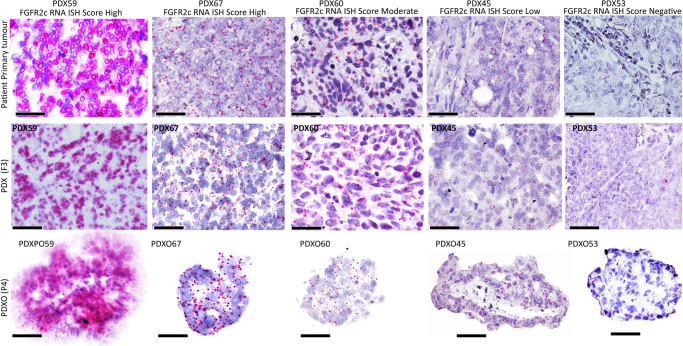
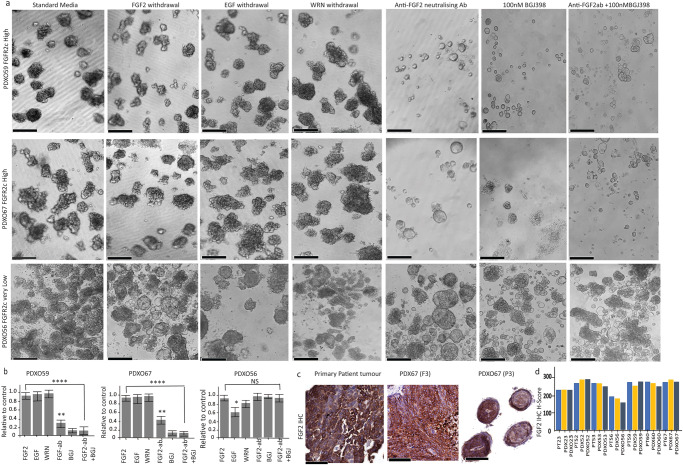
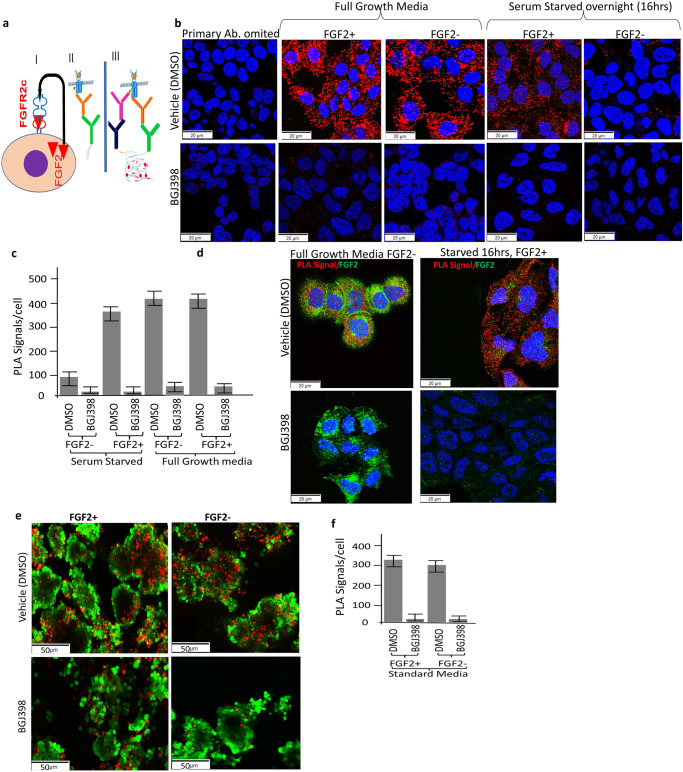
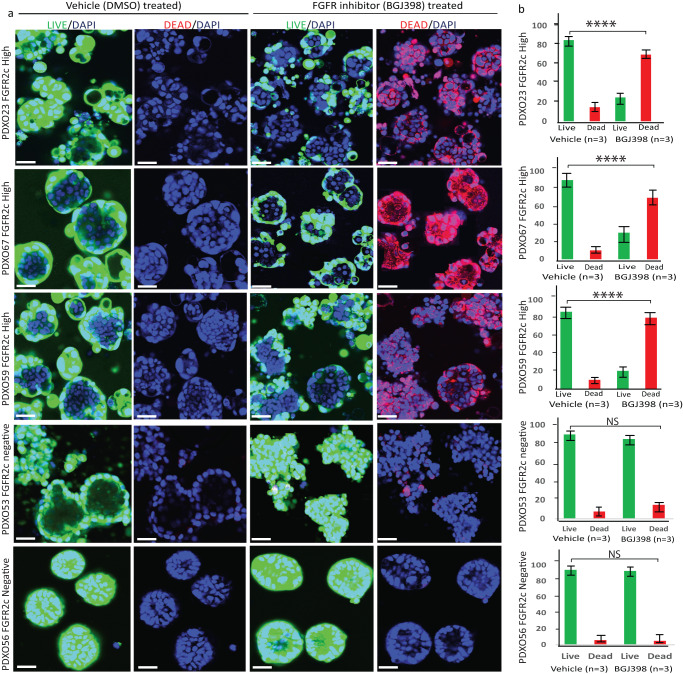
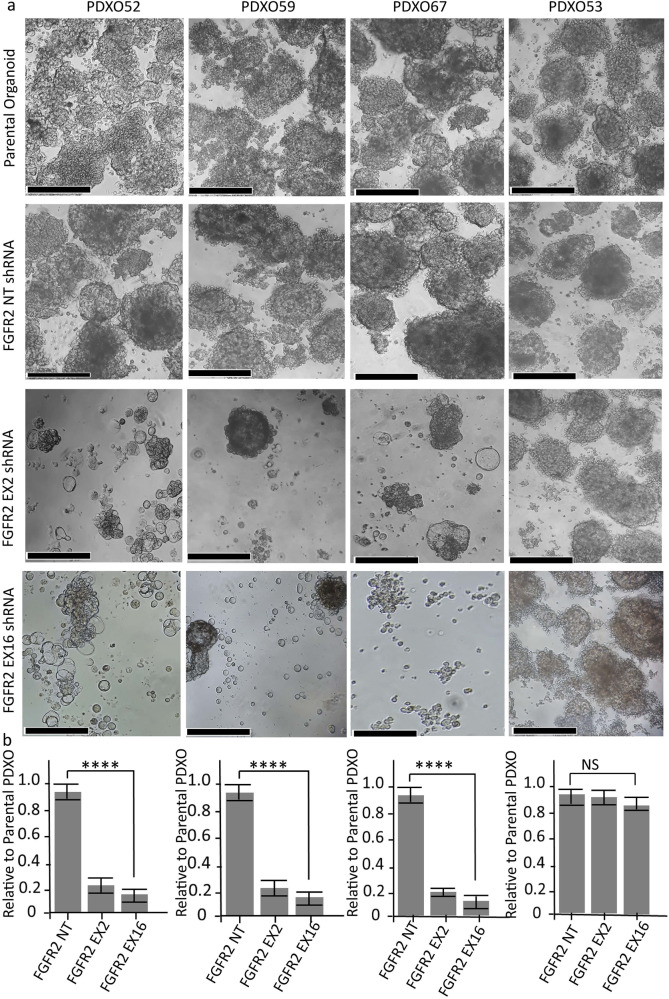
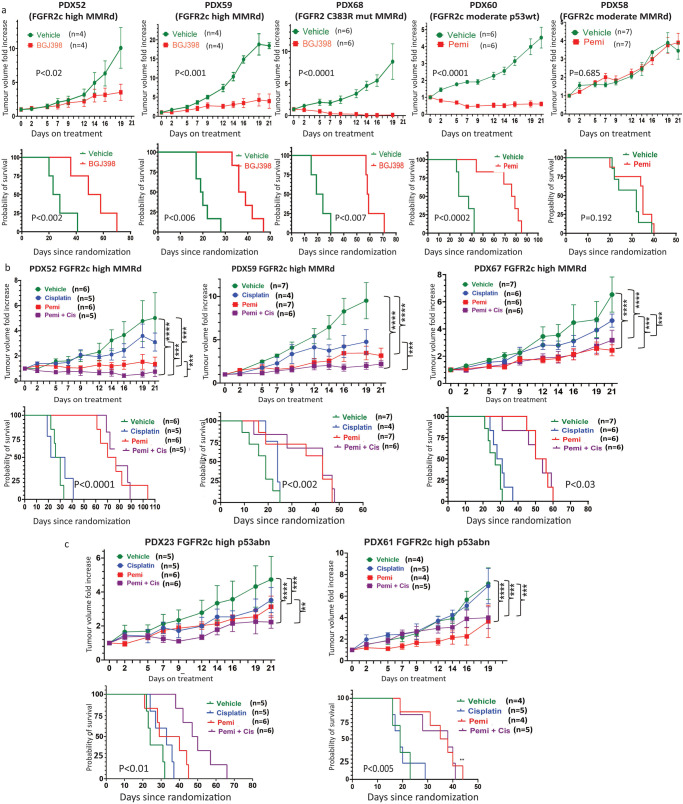
Endometrial cancer (EC) patients with metastatic/recurrent disease have limited treatment options and poor survival outcomes. Recently, we discovered the FGFR2c splice isoform is associated with poor prognosis in EC patients. Here we report the establishment of 16 EC patient-derived xenografts (PDX)-derived organoids (PDXOs) with or without FGFR2c expression. In vitro treatment of 5 EC PDXOs with BGJ398 showed significant cell death in 3 models with FGFR2c expression. PDXs with high/moderate FGFR2c expression showed significant tumour growth inhibition (TGI) following 21-day treatment with FGFR inhibitors (BGJ398 or pemigatinib) and significantly prolonged survival in 4/5 models. Pemigatinib + cisplatin combination therapy (n = 5) resulted in significant TGI and prolonged survival in one of two p53abn PDXs. All five models treated with cisplatin alone showed de novo resistance and no survival benefit. Seven-day treatment with BGJ398 revealed a significant reduction in angiogenesis and CD206 + M2 macrophages. These data collectively support the evaluation of FGFR inhibitors in a clinical trial.


Conflict of interest statement

Asmerom Sengal and Pamela Pollock received funding support from Incyte through an investigator-initiated study (IIS) grant scheme. The rest of the authors declare that there are no competing interests.

Figures

Fig. 1
Fig. 1. Characterization of patients’ primary endometrial cancer, PDXs and PDX-derived organoids (PDXOs).
a Histologic and molecular characterization of 21 endometrial cancer PDXs b Representative images from different histologic and molecular subtypes of endometrial cancer showing 7 primary patients’ tumour with different histologic and molecular types (top panel) recapitulated their morphology in corresponding PDXs (upper middle panel) and PDXOs (light microscope captured micrography of individual PDXOs, lower middle panel) and (H/E stained morphology of PDXOs, bottom panel). c Representative images for PDX23 demonstrating tumour histologic morphology (H/E), FGFR2 protein expression detected via IHC with a pan-FGFR2 antibody and FGFR2b and FGFR2c mRNA expression in patients’ primary tumour (upper panel), PDX 23 tumour passage 3 (F3) (middle panel) and corresponding PDXO23 at passage 3 (P3) (lower panel); Scale bar indicates 50 µm. EEC endometrioid endometrial carcinoma, DEC dedifferentiated endometrial carcinoma, CC Clear cell carcinoma, UCS uterine carcinosarcoma, CNV Copy number variation, FIGO International Federation Gynaecological Oncology, FGFR2c Fibroblast growth factor receptor 2c splice isoform, MSI microsatellite instability, MMRd mismatch repair deficient, LVSI Lymphovascular space invasion, Mol Molecular, Myo, Myometrial, TMB Tumour mutation burden, PDX patient-derived xenograft, PDXO patient-derived xenograft organoid, IHC Immunohistochemistry, H/E haematoxylin/eosin.
Fig. 2
Fig. 2. Different levels of expression of FGFR2c revealed by RNA ISH showing FGFR2c expression in PDXs and PDXOs recapitulate corresponding patient tumours.
The micrograph images illustrate five EC patients and corresponding PDXs and PDXOs representing the different patterns of FGFR2c splice isoform expression. The first column represents the single model with very high FGFR2c splice isoform expression with an RNA ISH signal score of 4+ (cluster of signals without distinct dots or >10 clusters). The second column represents models with high FGFR2c expression (RNA ISH score of 3+ (>10 signals/cell with ≤10 clusters). The third column represents a model of moderate FGFR2c expression with an RNA ISH score of 2+ (4-10 signals/cell without clustered dots) the fourth column represents a model with a low FGFR2c splice isoform RNA ISH score of 1 (2-3 signals/cell or >1 signals/10 tumour cells) and the fifth column is a model with negative FGFR2c splice isoform with RNA ISH score of 0 (<1 signal/10 tumour cells).
Fig. 3
Fig. 3. Regeneration and growth of EC PDXOs expressing FGFR2c are independent of exogenous growth factors but dependent on endogenous FGF2.
a Representative images of EC PDXO59 (upper panel), PDXO67 (middle panel) and PDXO56 (lower panels) cultured for 14 days in standard organoid media with the indicated withdrawal of growth factors and treatment with neutralising anti-FGF2 antibody alone or in combination with FGFR inhibitor (BGJ398). b Quantitation of relative growth reduction in three PDXOs cultured with the indicated withdrawal of growth factors or treatment with anti-FGF2 neutralising antibody, BGJ398 and both anti-FGF2 neutralising antibody and BGJ398. This experiment was performed in independent biological triplicate using independent PDXOs established from three different mice carrying each PDX. Organoid counting was performed by capturing 3 independent fields at a 10X microscopic objective view of each experiment. The error bar indicates the standard error of the mean (SEM) of the biological triplicates. Significance was assessed using a one-way ANOVA with Dunnett’s multiple comparison test. * P < 0.01, ** P < 0.001, **** P < 0.00001. c Representative IHC images showing expression of FGF2 in primary tumours and corresponding PDX and PDXO. d FGF2 IHC H-Score of primary patient tumour and matched PDXs and PDXOs. The scale bar indicates 200 µm for the PDXOs and 50 µm for the IHC. Ab antibody, PDX Patient-Derived Xenograft.
Fig. 4
Fig. 4. In situ detection of phosphorylated FGFR2c using PLA to demonstrate FGF2/FGFR2c autocrine loop signal activation in PDXO-derived cell line and PDXO.
a Schematic diagram illustrating the principle of PLA assay and autocrine loop mode of activation in carcinoma cells with FGFR2c splice isoform expression (I); In situ indirect PLA assay design, with one primary antibody omitted (technical negative control) without signal formation (II) and positive signal formation with incubation of both primary antibodies (III). b Representative images of PLA assay in ASPDX67_CL primary EC cell line grown in DMEM/F12 with 10% FBS or 16 hr of serum starvation (0.5% FBS) followed by stimulation with and without 10 ng/ml FGF2 + 0.01% DMSO for 30 min (top panels) or 300 nM BGJ398 (bottom panels). c Representative images demonstrating co-expression of FGF2 and pFGFR2c in the vehicle and BGJ398 treated ASPDX67_CL primary EC cell line. FGF2 is markedly reduced when cells were serum starved (left panels). d Reduction in pFGFR2c PLA signal/cell in ASPDX67_CL primary endometrial cancer cell line in different conditions. e Representative images of PLA results in PDXO67 cultured in standard organoid media without GFs +/- 10 ng/ml FGF2 and either vehicle-treatment (left panels) or BGJ398-treatment (right panels). f Quantitation of pFGFR2c signal in EC PDXO67 with or without FGF2 in the vehicle and BGJ398 treated organoids. All PLA signal data analyses were performed using automated Fiji ImageJ2. Error bars indicate the standard error of the mean (SEM) from technical triplicates. Small red dots indicate PLA signals of pFGFR2c and blue indicates nuclei stained with DAPI. Green IF in the PDXOs shows Histone-3 nuclear stain. EC endometrial cancer; FGF2, Fibroblast Growth Factor; PLA, proximity ligation assay; pFGFR2c, phosphorylated Fibroblast Growth Factor Receptor 2c splice isoform.
Fig. 5
Fig. 5. Significant cell death was observed in established PDXO models expressing FGFR2c following 72 hr treatment with 300 nM BGJ398.
a Representative images from three different PDXO models expressing FGFR2c (top three panels) and two PDXO models without FGFR2c expression (bottom two panels) treated with vehicle (DMSO) or 300 nM BGJ398 for 72 h. Images were captured in XYZ stack at 10x microscopic objective view airy using an Inverted Laser rotatory Confocal Fluorescent Olympus Microscope with (FV1200 software). Green fluorescence shows esterase activity of live cells (Calcein AM), red fluorescence is generated upon binding of Ethidium homodimer-1 to DNA in damaged cells and nuclei were stained with DAPI. b Bar graph showing the proportion of live (green) and dead (red) cells in 5 independent PDO models treated with DMSO vehicle and 300 nM BGJ398. The experiment was performed in independent biological triplicate using independent PDXOs established from three different mice carrying each PDX as well as in technical triplicate. Live and Dead image analyses were performed using automated Fiji ImageJ2 software. **** two-sided student’s T-test P < 0.0001; Error bars indicate standard error of the mean (SEM), Scale bar 20 µm. DMSO Dimethyl-sulphoxide, DAPI Diamidino-2-phenylindole, FR2c + , Fibroblast Growth Factor Receptor 2c positive, FR2c- Fibroblast Growth Factor Receptor 2c negative, PDOs Patient-Derived Organoids, PDX Patient Derived Xenograft. NS not statistically significant.
Fig. 6
Fig. 6. FGFR2c expression relative to Peptidylprolyl isomerase B (PPIB) a housekeeping gene following FGFR2 shRNA mediated knockdown in four endometrial cancer PDXO models.
a Representative micrography images of FGFR2c mRNA expression (first, third and fourth column) and PPIB a housekeeping gene (second and fifth column) detected via BaseScope RNA ISH on indicated endometrial PDXO models. b Analyses showing FGFR2c RNA ISH signals relative to PPIB (a housekeeping gene) in four endometrial cancer PDXOs. BaseScope RNA ISH was performed on FFPE organoid blocks collected 6 days after antibiotic selection. The scale bar indicates 50 µm. EX Exon, FFPE Formalin fixed paraffin embaded, FGFR2c Fibroblast growth factor receptor 2c splice isoform, NT nontargeting; PDXO Patient-derived xenograft organoids, PPIB Peptidylprolyl isomerase B.
Fig. 7
Fig. 7. shRNA mediated FGFR2 knockdown significantly reduces endometrial cancer PDXOs growth and viability.
a Representative micrography images of three indicated EC PDXOs with high expression of FGFR2c mRNA and one without FGFR2c expression (biological control). Lentiviral transduction of PDXOs with two independent FGFR2 shRNA knockdown constructs targeting exon 2 and exon 16 showed a significant reduction in the growth of EC PDXOs (52, 59 and 67) which was not evident in PDXO53 (right panel). Untransduced PDXOs and those transduced with non-targeting (NT) shRNA have similar patterns of growth (upper 1st and 2nd panels) indicating lentiviral transduction alone has no off-target impact on the PDXO growth. b Quantitation of PDXO size and number 10 days following transduction of NT or FGFR2 shRNA relative to untransduced organoids for each PDXO model from 3 biologically independent experiments. Significant reduction **** P < 00001 (one-way ANOVA test) was noted in PDXO52, PDXO59 and PDXO67 with high FGFR2c expression in contrast to that seen in PDXO53 without FGFR2c expression. Viability was determined using Live/Dead assay and quantification was performed using ImageJ2. A scale bar indicates 100 µm, error bar indicates the standard error of the mean (SEM). EC endometrial cancer, EX exon, NS not significant, NT non-targeting, PDXO Patient-Derived Xenograft Organoids, sh short hairpin.
Fig. 8
Fig. 8. In vivo data showing significant tumour growth inhibition (TGI) and longer survival in EC PDXs with FGFR2 activation treated with FGFRi alone or in combination with Cisplatin.
a Five independent EC PDX models treated with either BGJ398/infigratinib (PDX52, PDX59 and PDX68) or pemigatinib (PDX60 and PDX58). For each model, tumour growth inhibition (upper panel) and survival data (lower panel) are shown. b Three independent EC PDX models with FGFR2c expression representing the MMRd molecular subtype were treated with cisplatin alone, pemigatinib alone or pemigatinib plus cisplatin with tumour growth inhibition (upper panel) and survival data (lower panel) presented for each PDX model. c Two independent EC PDX models with FGFR2c expression and representing the p53abn molecular subtype were treated with cisplatin alone, pemigatinib alone or pemigatinib plus cisplatin and tumour growth inhibition (upper panel) and survival data (lower panel) are presented. Significance for TGI was assessed with a two-way ANOVA for models without any missing tumour measurements and a mixed model for those with one or more missing tumour measurements. A Tukey correction was performed for multiple comparisons and the Geisser Greenhouse correction was used for unequal variance. Significance for survival curves was assessed with a log-rank test * P < 0.05, ** P < 0.001 *** P < 0.0001, **** P < 0.00001. ANOVA, Analysis of variance; cis, cisplatin; EC, endometrial cancer, PDX, patient-derived xenograft.
Fig. 9
Fig. 9. FGFR inhibitor significantly reduced tumour microvessel density (MVD) and CD206 + M2 Macrophages in EC PDXs with FGFR2 dysregulation.
a Representative microphotography images of CD31 IHC stain on tumours from four independent PDX models treated for 7 days with either vehicle (left panel) or BGJ398 (right panel) b Quantification of CD31+ microvessel density (MVD) in BGJ398 versus vehicle-treated tumours for each indicated model. c Representative microphotography images of CD206 + M2 polarised Macrophages in tumours from four independent PDX models treated for 7 days with either vehicle (left panel) or BGJ398 (right panel) d Quantification of CD206 + M2 polarised macrophages in BGJ398 versus vehicle-treated tumours for each indicated model. PDX68 carries mutationally activated FGFR2 (C383R) while PDX52, PDX59 and PDX67 express FGFR2c. MVD and CD206 were counted using automated image analyses (Qu Path) and the score was reported as an average count of MVD or CD206+ cells/0.5mm2. Significant differences were assessed with a two-sided student’s T-test (**** P < 0.0001) and error bars indicate standard error of the mean (SEM), Scale bar 50 µm. # areas of differentiation with glandular formation.

References

    1. Sung H, et al. Global Cancer Statistics 2020: GLOBOCAN Estimates of Incidence and Mortality Worldwide for 36 Cancers in 185 Countries. CA: A Cancer J. Clin. 2021;71:209–249. - PubMed
    1. The Cancer Genome Atlas. Integrated genomic characterization of endometrial carcinoma. Nature. 2013;497:67–73. doi: 10.1038/nature12113. - DOI - PMC - PubMed
    1. Talhouk A, et al. A clinically applicable molecular-based classification for endometrial cancers. Br. J. Cancer. 2015;113:299–310. doi: 10.1038/bjc.2015.190. - DOI - PMC - PubMed
    1. Stelloo E, et al. Refining prognosis and identifying targetable pathways for high-risk endometrial cancer; a TransPORTEC initiative. Mod. Pathol. 2015;28:836–844. doi: 10.1038/modpathol.2015.43. - DOI - PubMed
    1. Stelloo E, et al. Improved Risk Assessment by Integrating Molecular and Clinicopathological Factors in Early-stage Endometrial Cancer-Combined Analysis of the PORTEC Cohorts. Clin. Cancer Res. 2016;22:4215–4224. doi: 10.1158/1078-0432.CCR-15-2878. - DOI - PubMed