. 2024 Jan;21(1):60-79.
doi: 10.1038/s41423-023-01112-y. Epub 2023 Dec 7.

The BCL-2 inhibitor APG-2575 resets tumor-associated macrophages toward the M1 phenotype, promoting a favorable response to anti-PD-1 therapy via NLRP3 activation

Affiliations

The BCL-2 inhibitor APG-2575 resets tumor-associated macrophages toward the M1 phenotype, promoting a favorable response to anti-PD-1 therapy via NLRP3 activation

Fan Luo et al. Cell Mol Immunol. 2024 Jan.

Abstract

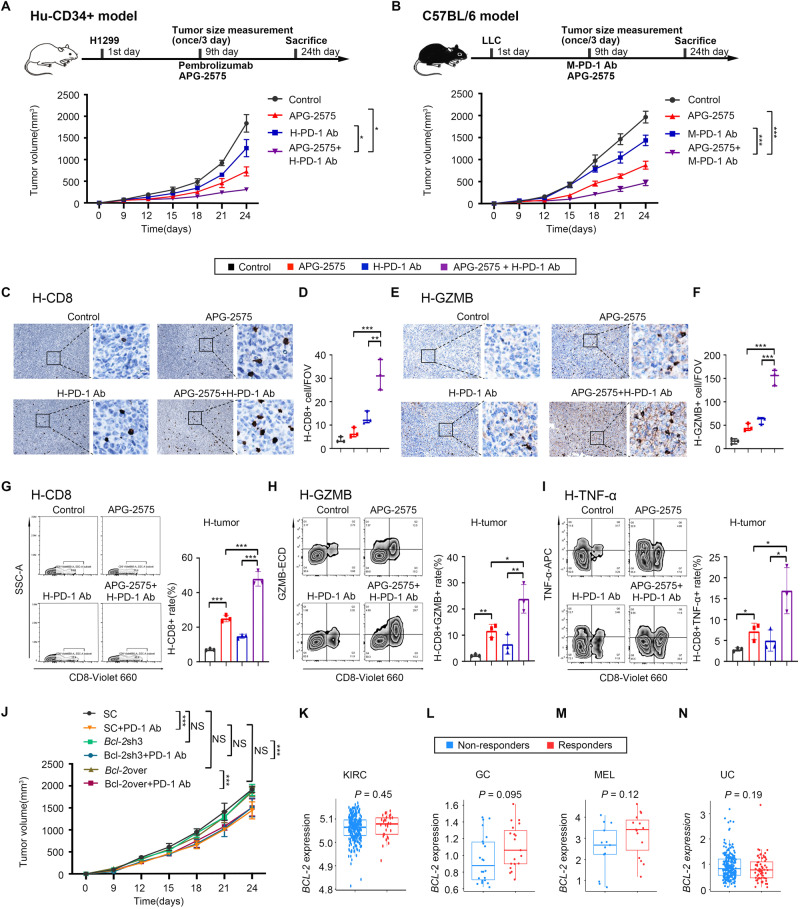
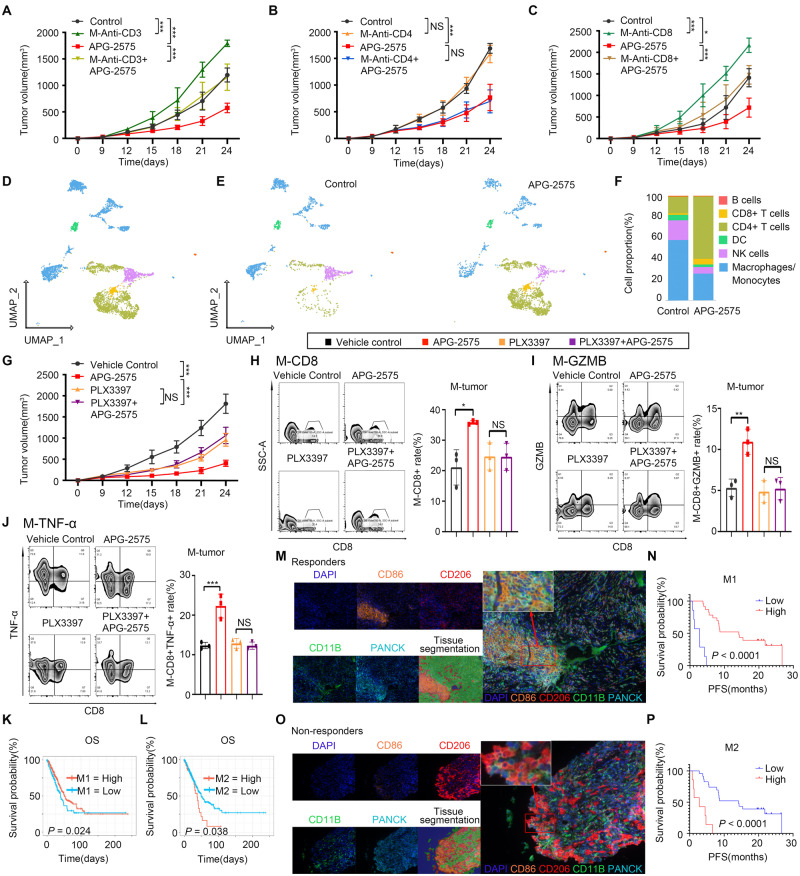
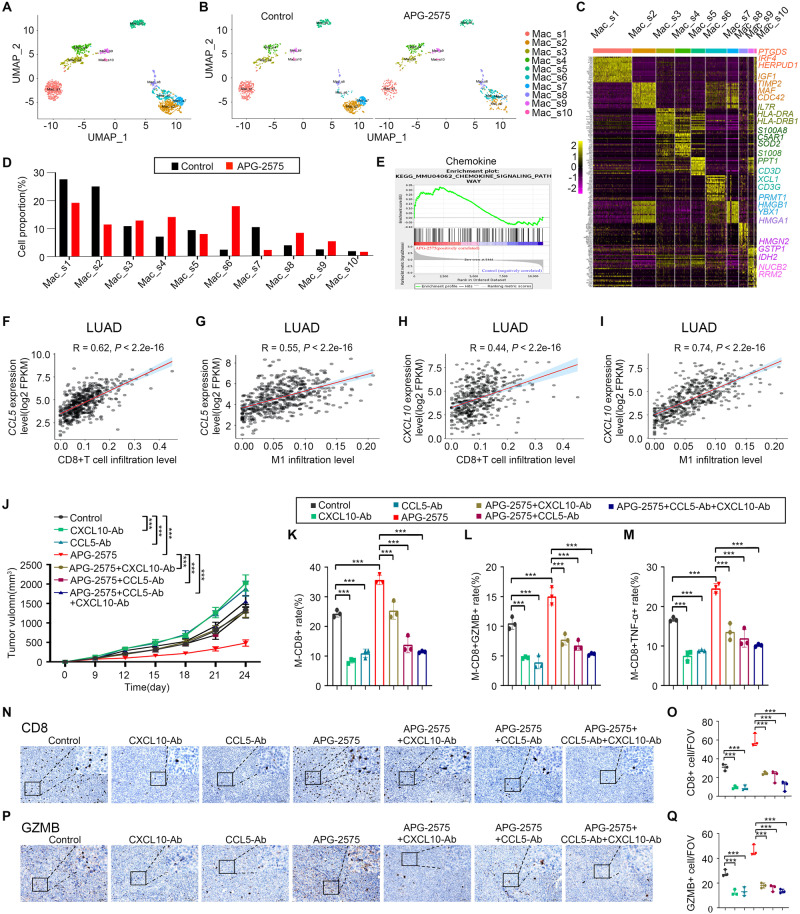
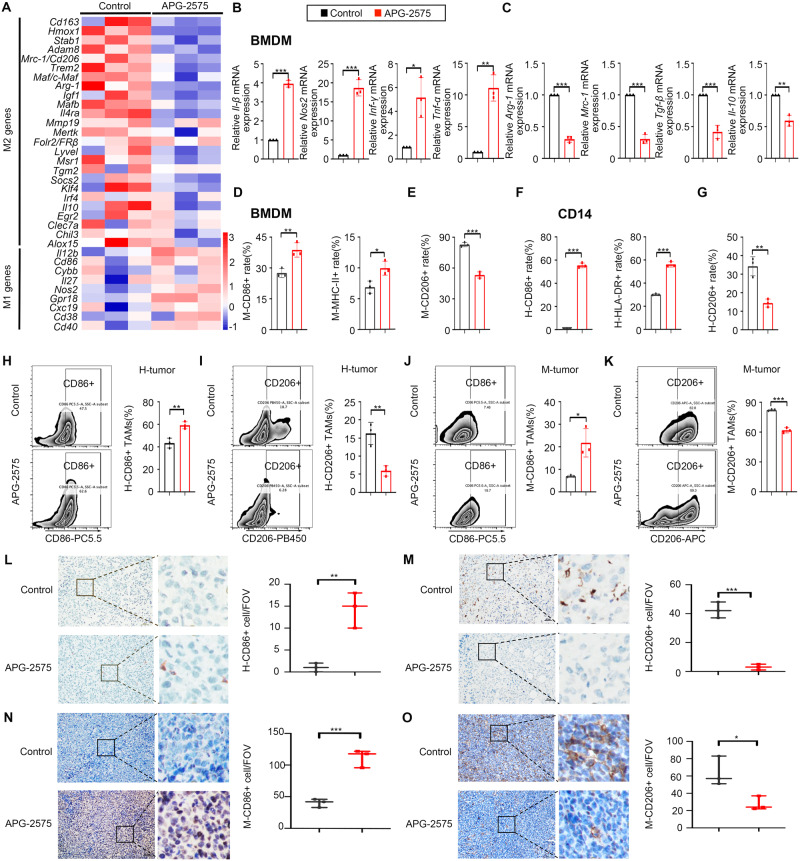
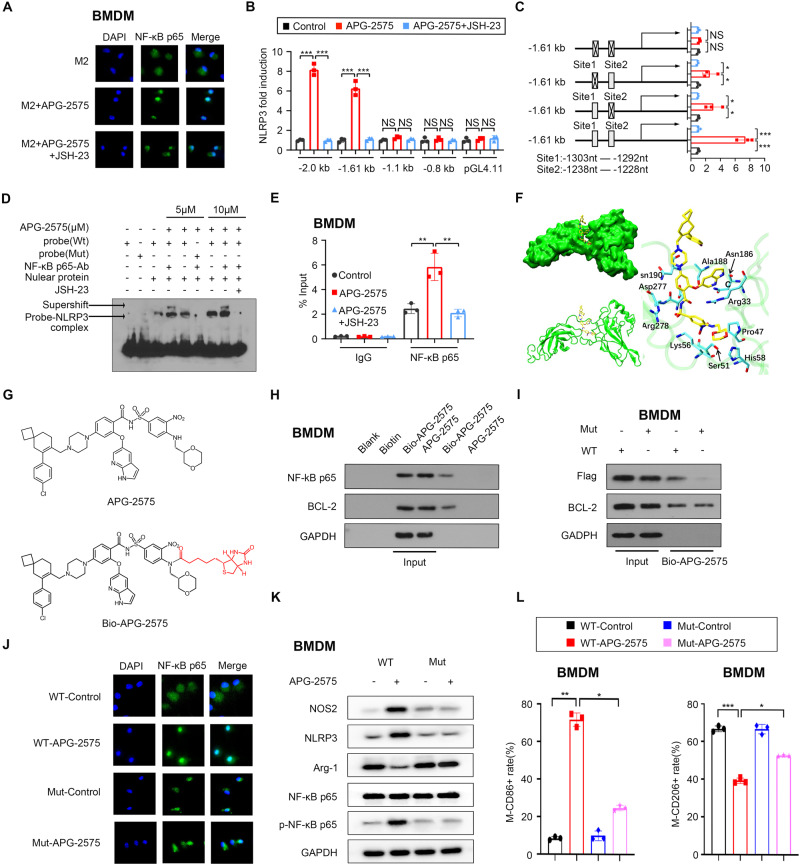
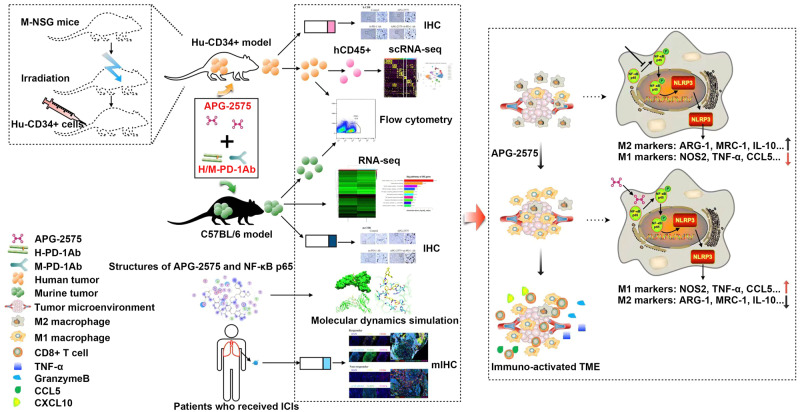
The main challenges in the use of immune checkpoint inhibitors (ICIs) are ascribed to the immunosuppressive tumor microenvironment and the lack of sufficient infiltration of activated CD8+ T cells. Transforming the tumor microenvironment (TME) from "cold" to "hot" and thus more likely to potentiate the effects of ICIs is a promising strategy for cancer treatment. We found that the selective BCL-2 inhibitor APG-2575 can enhance the antitumor efficacy of anti-PD-1 therapy in syngeneic and humanized CD34+ mouse models. Using single-cell RNA sequencing, we found that APG-2575 polarized M2-like immunosuppressive macrophages toward the M1-like immunostimulatory phenotype with increased CCL5 and CXCL10 secretion, restoring T-cell function and promoting a favorable immunotherapy response. Mechanistically, we demonstrated that APG-2575 directly binds to NF-κB p65 to activate NLRP3 signaling, thereby mediating macrophage repolarization and the activation of proinflammatory caspases and subsequently increasing CCL5 and CXCL10 chemokine production. As a result, APG-2575-induced macrophage repolarization could remodel the tumor immune microenvironment, thus improving tumor immunosuppression and further enhancing antitumor T-cell immunity. Multiplex immunohistochemistry confirmed that patients with better immunotherapeutic efficacy had higher CD86, p-NF-κB p65 and NLRP3 levels, accompanied by lower CD206 expression on macrophages. Collectively, these data provide evidence that further study on APG-2575 in combination with immunotherapy for tumor treatment is required.

Keywords: APG-2575; BCL-2; ICIs; Macrophages; NLRP3.


Conflict of interest statement

D.J.Y. has an ownership interest (including patents) in Ascentage Pharma Group Corp. Limited. W.T.P. is an employee of Ascentage Pharma Group Corp. Limited. All other authors declare no potential competing interests.

Figures

Fig. 1
Fig. 1
APG-2575 potentiates the efficacy of an immune checkpoint inhibitor in humanized CD34+ and C57BL/6 mouse models. A, B Tumor outgrowth in different groups, including the control, APG-2575, anti-PD-1 and combination treatment groups, in H1299 tumor-bearing humanized CD34+ model mice and in LLC tumor-bearing C57BL/6 mice. CF Immunohistochemical analyses of CD8 and GZMB in hu-CD34+ mouse xenograft tumors. GI Flow cytometric analysis of CD8+, CD8+GZMB+ and CD8+ TNF-α + T cells in hu-CD34+ mouse xenograft tumors. J Tumor outgrowth in Bcl-2 knockdown and overexpression LLC tumor-bearing C57BL/6 mice in the different treatment groups. KN Differences in BCL-2 expression levels in various cancer types between nonresponders and responders who accepted immunotherapy. KIRC, kidney renal clear cell carcinoma, GC, gastric carcinoma; MEL, melanoma, UC, urothelial carcinoma
Fig. 2
Fig. 2
The antitumor activity of APG-2575 is CD8+ T-cell driven, and APG-2575 induces antitumor CD8+ T-cell immunity by regulating macrophages. AC Tumor volume comparison in APG-2575-treated LLC tumor-bearing C57BL/6 mice with or without depletion of CD3+, CD4+ or CD8+ T cells. D UMAP plot of human tumor-infiltrating CD45+ cells from the two groups merged and analyzed by scRNA-seq. E UMAP plots with annotated clusters of intratumoral immune cells from the control and APG-2575 groups. F The proportions of different immune cells in the control and APG-2575 groups. G Tumor volume comparison in APG-2575-treated LLC tumor-bearing C57BL/6 mice in the absence or presence of PLX3397. HJ Flow cytometric analysis of CD8+, CD8 + GZMB+ and CD8+ TNF-α + T cells in C57BL/6 mouse xenograft tumors. K, L Kaplan‒Meier analysis of OS in patients in TCGA cohorts based on the M1 and M2 macrophage infiltration levels. M, O Representative multiplex immunofluorescence images demonstrating the CD11B + CD86+ (M1 macrophages), CD11B+CD206+ (M2 macrophages) and pan-CK (cancer cells) expression signatures in samples from responders and nonresponders. N, P Kaplan‒Meier analysis of PFS in patients based on M1 and M2 macrophage infiltration levels detected in tumors
Fig. 3
Fig. 3
APG-2575 remodels the transcriptomic landscape of macrophages and CD8+ T cells and promotes CD8+ T-cell infiltration via the chemokines CCL5 and CXCL10. A UMAP plot from merged data of tumor-infiltrating Mo/MF populations. B UMAP plots with annotated clusters of Mo/MF cells from the control and APG-2575 groups. C A heatmap showing the differentially expressed genes (rows) among Mo/MF subpopulations (columns). Representative genes from each cluster are highlighted (right). D Ratios of the proportions of Mo/MF clusters across different regimens. E GSEA using genes differentially expressed between IL-4-activated RAW264.7 cells with control or APG-2575 treatment. FI Scatter plot showing the results of Pearson correlation analysis of CCL5 and CXCL10 expression and the infiltration of CD8+ T cells and M1 macrophages in TCGA cohorts. J Growth of LLC tumors in C57BL/6 mice treated with the indicated regimens. (KM) Flow cytometric analysis of CD8+, CD8 + GZMB+ and CD8+ TNF-α+ T cells in C57BL/6 mouse xenograft tumors treated with the indicated regimens. NQ Immunohistochemical staining of CD8 and GZMB in C57BL/6 mouse xenograft tumors
Fig. 4
Fig. 4
APG-2575 effectively repolarized M2-like macrophages to the M1 phenotype. A A heatmap of the normalized mean-centered mRNA expression levels of genes associated with M1 or M2 macrophages in the control and APG-2575 treatment groups. B, C IL-4-activated BMDMs were treated with or without APG-2575. The mRNA expression of M1/M2-related markers was analyzed. D, E Quantification of CD86, MHC-II and CD206 expression in IL-4-activated BMDMs with or without APG-2575 treatment. F, G Quantification of CD86, HLA-DR and CD206 expression in IL-4-activated CD14+ monocyte-derived macrophages with or without APG-2575 treatment. HK Flow cytometric analysis of CD86 and CD206 in TAMs from hu-CD34+ and C57BL/6 mice treated with PBS or APG-2575. L, M Immunohistochemical staining of CD86 and CD206 in humanized CD34+ mouse xenograft tumors. N, O Immunohistochemical staining of CD86 and CD206 in C57BL/6 mouse xenograft tumors
Fig. 5
Fig. 5
APG-2575 enhanced M1 polarization by upregulating NLRP3 expression. A Quantification of CD86 and CD206 expression in IL-4-activated Bcl-2-knockout or Bcl-2--overexpressing RAW264.7 cells treated with APG-2575 or control. BF KEGG pathway analysis and GSEA using genes differentially expressed between IL-4-activated RAW264.7 cells with the control or APG-2575 treatment. GL Scatter plot showing the results of Pearson correlation analysis between the estimated M1 macrophage infiltration score and NLRP3 gene expression level in various cancer types. M Representative immunofluorescence staining of NLRP3, ASC, and DAPI in IL-4-activated BMDMs after treatment with APG-2575 in combination with JSH-23 or INF39. Scale bar, 20 μm. N Western blot analysis of NOS2, NLRP3, caspase-1, Arg-1, and IL-1β in IL-4-activated BMDMs cultured with APG-2575 in the presence or absence of INF39. O, P The mRNA expression levels of M1/M2-related markers in IL-4-activated BMDMs treated with APG-2575 in the presence or absence of INF39. Q Quantification of CD86, MHC-II and CD206 expression in IL-4-activated BMDMs treated with APG-2575 in the presence or absence of INF39. R IL-4-activated CD14+ monocyte-derived macrophages treated with or without APG-2575. The TNF-α concentration in the supernatants was measured by a CBA, and the IL-10 concentration in the supernatants was measured by ELISA. S, T Western blot analysis of NOS2, NLRP3, caspase-1, Arg-1, and IL-1β in IL-4-activated BMDMs with stable Nlrp3 knockdown and overexpression and treated with APG-2575 or control. LUAD, lung adenocarcinoma, LUSC, lung squamous cell carcinoma, OV, ovarian serous cystadenocarcinoma, COAD, colon adenocarcinoma; BLCA, bladder urothelial carcinoma, ESCA, esophageal carcinoma
Fig. 6
Fig. 6
APG-2575 induced NLRP3 transcription by enhancing the nuclear localization of NF-κB. A NF-κB p65 localization in IL-4-activated BMDMs with or without APG-2575 treatment was examined using a confocal fluorescence microscope. Green, NF-κB p65; blue, DAPI. Scale bar, 20 μm. B Luciferase reporter assays with distinct Nlrp3 reporters in Raw264.7 cells activated by IL-4 and then treated with APG-2575 or control. C Luciferase reporter assays with different versions of the 1.61 kb Nlrp3 reporters in RAW264.7 cells activated by IL-4 and then treated with APG-2575 or control. D EMSAs were performed in nuclear extracts with a biotin-labeled NF-κB probe (containing the NF-κB consensus binding sequence). IL-4-activated RAW264.7 cells were treated with APG-2575 or control. E ChIP assay showing the recruitment of NF-κB p65 to the Nlrp3 promoter in IL-4-activated BMDMs. F The simulated complex structure and binding mode of APG-2575 with the RELA protein. G Chemical structures of APG-2575 and biotin-labeled APG-2575 (Bio-APG-2575). H Bio-APG-2575 was added to streptavidin-agarose beads, and the mixture was incubated. Biotin alone was used as a control. Lysates were prepared from BMDMs. I BMDMs were transfected with WT (wild type) NF-κB p65 or mutant NF-κB p65 (Arg33A/Lys56A/Asp277A/Arg278A). Lysates were used for pulldown assays to detect APG-2575 binding using the pulldown assay procedure described in (H). J NF-κB p65 localization in IL-4-activated BMDMs transfected with WT NF-κB p65 or mutant NF-κB p65 and treated with or without APG-2575 was examined using a confocal fluorescence microscope. Green, NF-κB p65; blue, DAPI. Scale bar, 20 μm. K Western blot analysis of NOS2, NLRP3, Arg-1, and NF-κB p65 in IL-4-activated BMDMs transfected with WT NF-κB p65 or mutant NF-κB p65 and treated with or without APG-2575. L Flow cytometric analysis of CD86 and CD206 in IL-4-activated BMDMs transfected with WT NF-κB p65 or mutant NF-κB p65 and treated with or without APG-2575
Fig. 7
Fig. 7
NF-κB/NLRP3 signaling pathway activity is positively related to M1-like TAM infiltration levels as well as the efficacy of an immune checkpoint inhibitor in NSCLC. A, B Representative multiplex immunofluorescence images demonstrating the protein expression of CD86, CD206, p-NF-κB p65, NLRP3 and pan-CK in samples from responders and nonresponders. CE Statistical charts showing the correlations between CD86 and NLRP3, CD86 and p-NF-κB p65, and NLRP3 and p-NF-κB p65 expression. F, H, J, L Kaplan‒Meier analysis of PFS in patients based on the level of NLRP3, p-NF-κB p65, CD86 or CD206 on macrophages detected in tumors. G, I, K, M Correlation analysis showed that NLRP3, p-NF-κB p65, CD86 and CD206 on macrophages were significantly associated with the immune response
Fig. 8
Fig. 8
Graphical summary of the results. APG-2575 can synergize with ICIs through a mechanism involving the repolarization of TAMs from the M2 to the M1 phenotype, further enhancing CD8+ T-cell recruitment into the TME via the augmentation of CCL5 and CXCL10 secretion and thereby improving tumor immunosuppression

References

    1. Yi M, Zheng X, Niu M, Zhu S, Ge H, Wu K. Combination strategies with PD-1/PD-L1 blockade: current advances and future directions. Mol Cancer. 2022;21:28. doi: 10.1186/s12943-021-01489-2. - DOI - PMC - PubMed
    1. Pitt JM, Vétizou M, Daillère R, Roberti MP, Yamazaki T, Routy B, et al. Resistance mechanisms to immune-checkpoint blockade in cancer: tumor-intrinsic and -extrinsic factors. Immunity. 2016;44:1255–69. doi: 10.1016/j.immuni.2016.06.001. - DOI - PubMed
    1. Sun Q, Wei X, Wang Z, Zhu Y, Zhao W, Dong Y, et al. Primary and acquired resistance against immune check inhibitors in non-small cell lung cancer. Cancers. 2022;14. 10.3390/cancers14143294. - PMC - PubMed
    1. Alizadeh AA, Aranda V, Bardelli A, Blanpain C, Bock C, Borowski C, et al. Toward understanding and exploiting tumor heterogeneity. Nat Med. 2015;21:846–53. doi: 10.1038/nm.3915. - DOI - PMC - PubMed
    1. Cristescu R, Mogg R, Ayers M, Albright A, Murphy E, Yearley J, et al. Pan-tumor genomic biomarkers for PD-1 checkpoint blockade-based immunotherapy. Science. 2018; 362. 10.1126/science.aar3593. - PMC - PubMed

Publication types

MeSH terms