. 2024 Jan;25(1):54-65.
doi: 10.1038/s41590-023-01672-1. Epub 2023 Dec 7.

Oleic acid availability impacts thymocyte preprogramming and subsequent peripheral Treg cell differentiation

Affiliations

Oleic acid availability impacts thymocyte preprogramming and subsequent peripheral Treg cell differentiation

Liangyu Lin et al. Nat Immunol. 2024 Jan.

Abstract

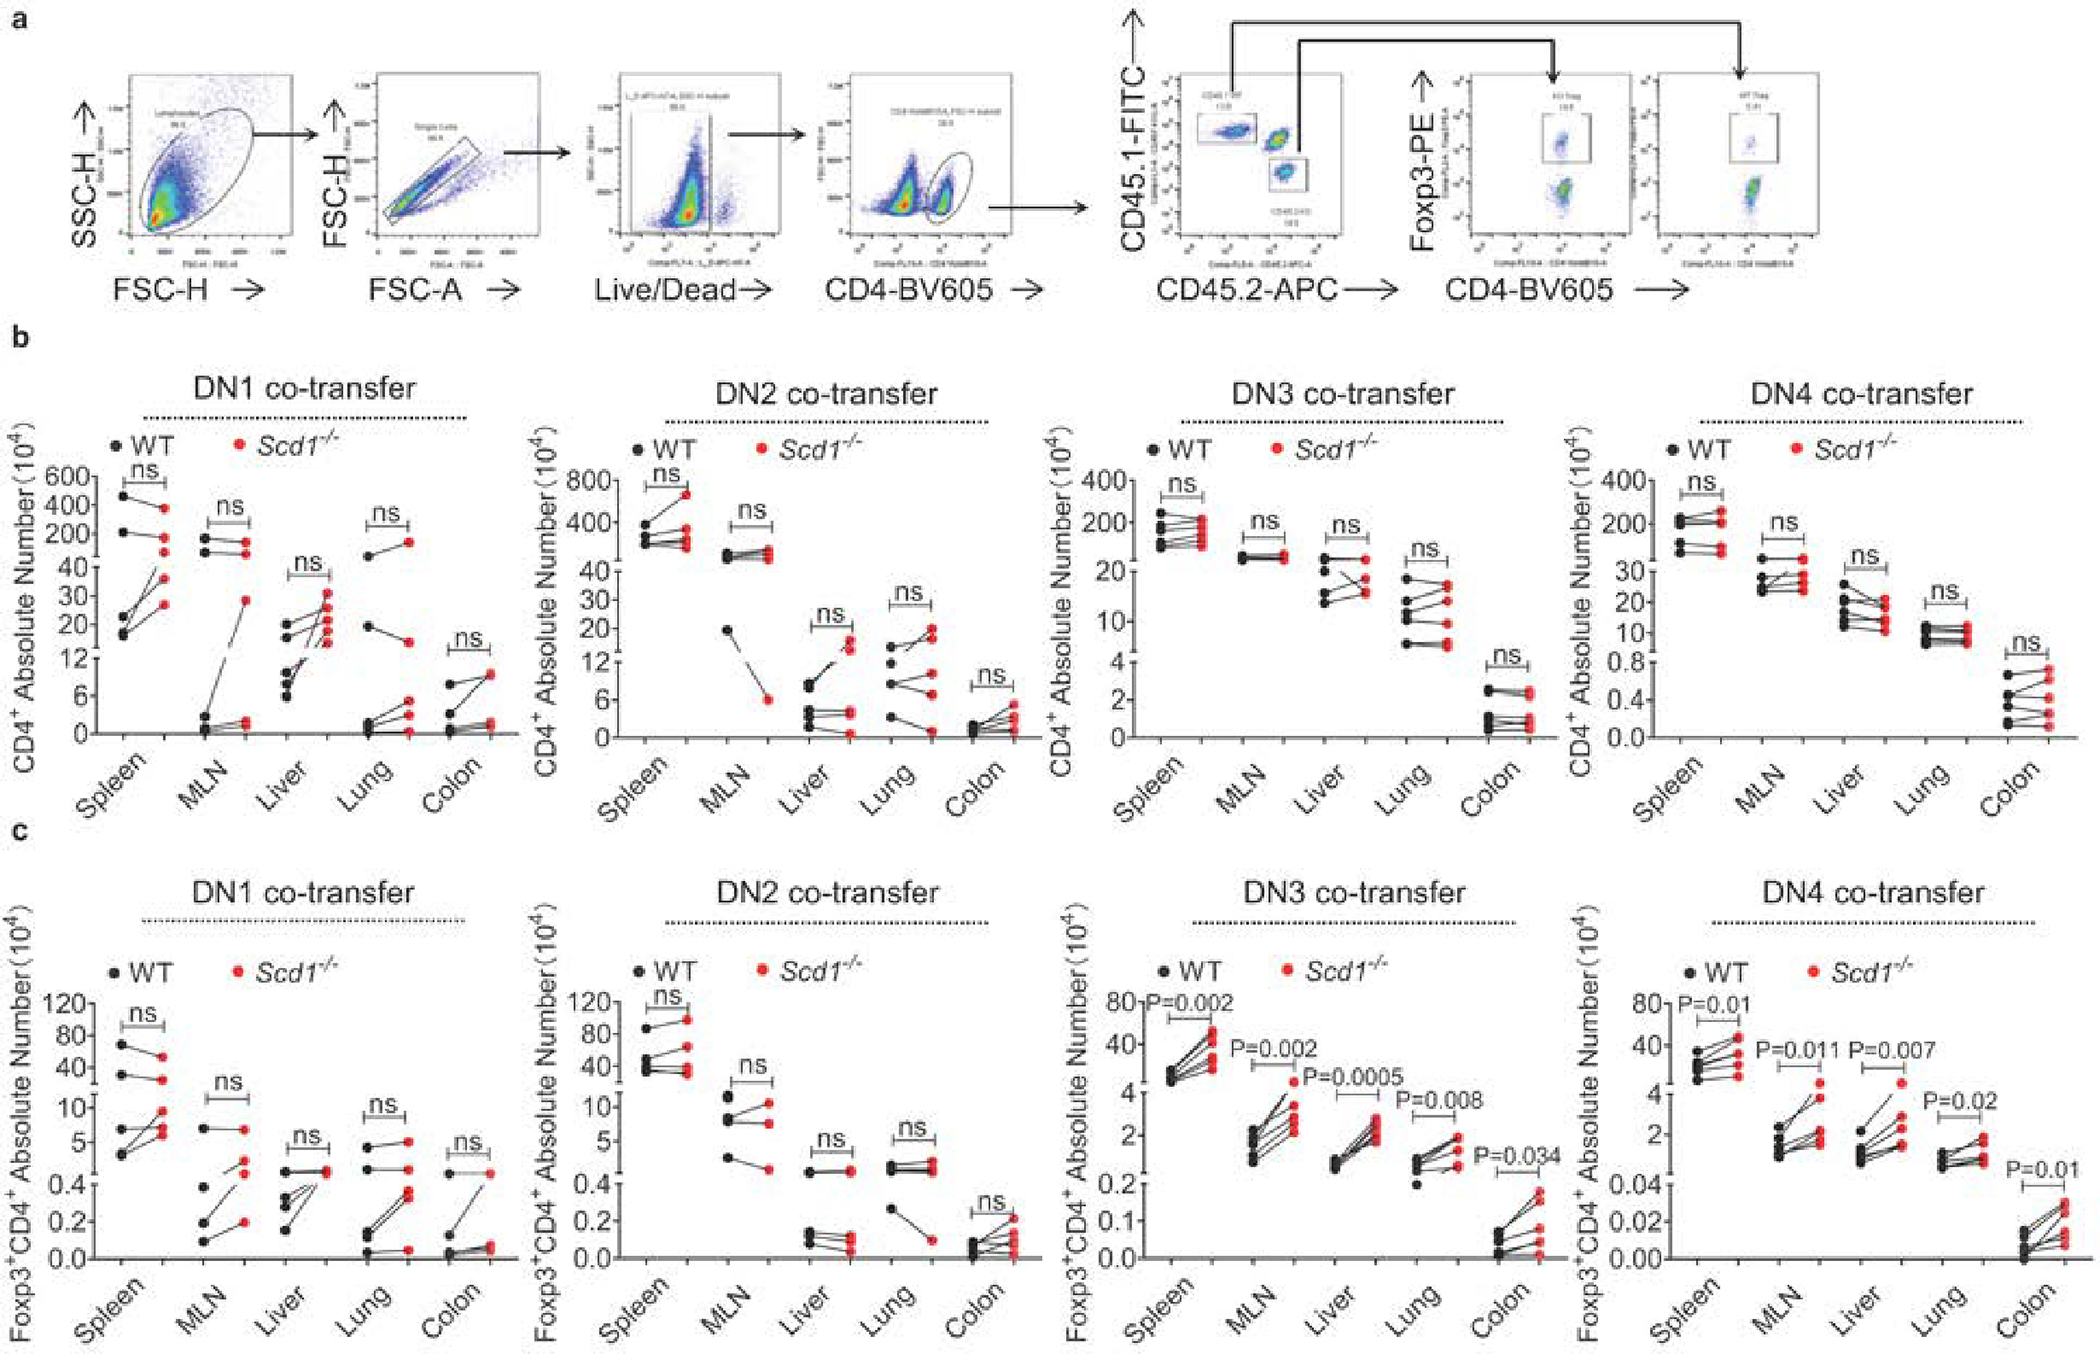
The nature of activation signals is essential in determining T cell subset differentiation; however, the features that determine T cell subset preference acquired during intrathymic development remain elusive. Here we show that naive CD4+ T cells generated in the mouse thymic microenvironment lacking Scd1, encoding the enzyme catalyzing oleic acid (OA) production, exhibit enhanced regulatory T (Treg) cell differentiation and attenuated development of experimental autoimmune encephalomyelitis. Scd1 deletion in K14+ thymic epithelia recapitulated the enhanced Treg cell differentiation phenotype of Scd1-deficient mice. The dearth of OA permitted DOT1L to increase H3K79me2 levels at the Atp2a2 locus of thymocytes at the DN2-DN3 transition stage. Such epigenetic modification persisted in naive CD4+ T cells and facilitated Atp2a2 expression. Upon T cell receptor activation, ATP2A2 enhanced the activity of the calcium-NFAT1-Foxp3 axis to promote naive CD4+ T cells to differentiate into Treg cells. Therefore, OA availability is critical for preprogramming thymocytes with Treg cell differentiation propensities in the periphery.


Conflict of interest statement

Ethics declarations

Competing interests

The authors declare no competing interests.

Figures

Extended Data Fig. 1:
Extended Data Fig. 1:. Properties of Treg cells of Scd1−/− mice.
(a) EAE was induced in Scd1−/− and Scd1+/− mice as described in Figure 1a. The levels of Th17 and Treg cells in the central nervous system (CNS) were analyzed on day 17 post EAE induction (n=7 mice for Scd1+/−+Iso, Scd1 −/−+Iso, n=5 mice for Scd1+/−+a-CD25, n=6 for Scd1−/−+a-CD25). (b) The absolute number of CD4+Foxp3+ Treg cells and CD4+Foxp3 conventional T cells in various organs of Scd1−/− and Scd1+/− mice (n= 4 mice per group). (c) CD4+CD25+ T cells were isolated from the spleen of Scd1−/− mice and Scd1+/− littermate control mice, and co-cultured with activated CFSE-labeled CD4+ T cells (1 × 10⁶) from wild type (WT) mice at indicated ratio. The proliferation of CD4+ T cells were determined by the dilution of CFSE. (d) The expression levels of CD25, CTLA-4, and GITA in CD4+Foxp3+ Treg cells were determined by flow cytometry. (e) Gating strategies (with the spleen as a representative) for analyzing Helios expression in Treg cells. (f-g) The percentage and absolute number of Helios+ and Helios Treg cells in the various tissues of Scd1−/− mice and Scd1+/− mice under steady status (n=4 mice per group). Data are presented as Mean ± SEM. ns, no significance; by unpaired two-tailed Student’s t-test.
Extended Data Fig. 2:
Extended Data Fig. 2:. Newly generated CD4+ T cells in Scd1−/− mice are prone to differentiate to Treg cells in WT recipient mice.
(a) Thymocytes were depleted of double positive and CD8 single positive cells by magnetic beads and then subjected to sort CD4+CD8CD73CD25 thymocytes by flow cytometry. The purity of sorted thymocytes was depicted. (b) The gating strategies (with the spleen as a representative) for analyzing Treg cells in CD45.1+CD45.2+ WT mice receiving the co-transfer of CD4+CD8CD73CD25 thymocytes from CD45.1+WT and CD45.2+ Scd1−/− mice. (c) The percentage of Foxp3+ cells in CD4+ cells of CD45.1+WT and CD45.2+Scd1−/− origin were determined 6 weeks post thymocyte co-transfer (n=6 mice per group). (d) The absolute number of WT CD45.1+CD4+Foxp3+ and Scd1−/− CD45.2+CD4+Foxp3+ cells in various organs of WT recipient mice were numerated (n=6 mice per group). (e) The absolute number of CD4+ T cells derived from CD45.1+ and CD45.2+ donor cells were assessed (n=6 mice per group). Data are presented as Mean ± SEM. ns, no significance; by paired two-tailed Student’s t-test.
Extended Data Fig. 3:
Extended Data Fig. 3:. Functionality of CD4+ T Cells isolated from Scd1+/− and Scd1−/− mice.
(a) The percentage of CD44CD62L+, CD44+CD62L, and CD44+CD62L+ CD4+ T cells in the spleen of Scd1+/− (n=7) and Scd1−/− mice (n=5) at steady status. (b) CFSE-labeled splenic CD4+CD25 conventional T cells from Scd1+/− and Scd1−/− mice were subjected to anti-CD3/CD28 stimulation in vitro for 3 days and cell proliferation was detected by assessing CFSE dilution. (c-f) Splenic CD4+CD62L+T cells from Scd1−/− and Scd1+/− mice were cultured in Th1, Th2, or Th17 induction medium for 3 days (n=3 for Th1 and Th17 differentiation, n=4 for Th2 differentiation). The percentages of IFN +, IL-4+, or IL-17+ CD4+T cells were determined by flow cytometry. Data are presented as Mean ± SEM. ns, no significance; by unpaired two-tailed Student’s t-test.
Extended Data Fig.4:
Extended Data Fig.4:. Treg cells are comparable in CD4creScd1loxp and Scd1loxp mice.
(a) mRNA levels of Scd1 in CD4+ T cells and hepatocytes isolated from CD4creScd1loxp mice and Scd1loxp littermate control mice (n=5 mice for each group). (b) The percentages of stearic acid (18:0) and oleic acid (18:1n9) among total fatty acids in in vitro expanded CD4+ T cells isolated from CD4creScd1loxp mice and Scd1loxp mice (n=3 for each group). (c) The CD4+ T cell reconstitution efficiency in Rag2−/− mice receiving co-transfer of CD45.1+WT CD4+ T cells and CD45.2+CD4creScd1loxp CD4+ T cells (n=4 mice per group). (d) The percentage of Treg cells among CD4+ T cells in the spleen, auxiliary lymph node and central nervous system of CD4creScd1loxp mice and Scd1loxp mice on day 0 (steady, n=3 mice per group), day 18 (peak, n=5 for Scd1loxp mice, n=3 for CD4creScd1loxp mice), and day 24 (recovery, n=5 for Scd1loxp mice, n=3 for CD4creScd1loxp mice) post EAE induction. Data are presented as Mean ± SEM. ns, no significance; by unpaired two-tailed Student’s t-test.
Extended Data Fig. 5:
Extended Data Fig. 5:. The T cell reconstitution efficiency of WT and Scd1−/− bone marrow cells were comparable.
(a) Representative gating strategies in analyzing the thymocyte populations of the recipient mice as treated in Fig. 2a. The reconstitution efficiency of CD45.1+ and CD45.1+CD45.2+ cells within thymocytes at DN, DP, and SP stages were depicted. (b) The reconstitution efficiency of CD45.1+WT and CD45.1+CD45.2+Scd1−/− bone marrow cells transplantation (BMT) in different tissues of recipient mice as treated in Fig. 2a. (c) The percentages of donor CD4+ cells among CD45+ cells in the blood and different organs of recipient mice in Fig. 2a. (d) The thymic CD4CD8 double negative (DN) subpopulation levels in Scd1+/− mice and Scd1−/− mice (n=5 mice for each group). (e) The thymic DN, CD8SP, CD4SP, and DP levels in Scd1+/− mice and Scd1−/− mice (n=6 mice for each group). Data are presented as Mean ± SEM. ns, no significance; by unpaired two-tailed Student’s t-test.
Extended Data Fig. 6:
Extended Data Fig. 6:. DN3 and DN4 cells of Scd1 deficient origin generated CD4+ T cells with intrinsic Treg propensities upon injection into the thymus of WT mice.
(a) Gating strategies (with the spleen as a representative) used to analyze the Treg cell proportion among donor-derived CD4+ T cells. (b-c) Thymocyte population from CD45.2+Scd1−/− mice and CD45.1+WT mice at the DN1, DN2, DN3, or DN4 stage were mixed at a 1:1 ratio and co-transferred into irradiated (3 Gy) CD45.1+CD45.2+ WT recipient mice via intrathymic injection (n=5 mice for DN1, DN2 transfer; n=6 mice for DN3, DN4 transfer). Four weeks post transfer, the recipient mice received WT and Scd1−/− DN thymocytes were euthanized to numerate the absolute number of CD4+ T cells (b) and CD4+Foxp3+ Treg cells (c) in various organs. Data are presented as Mean ± SEM. ns, no significance; by paired (b, c) two-tailed Student’s t-test.
Extended Data Fig. 7:
Extended Data Fig. 7:. The influence of SCD1 inhibitor on in vitro T cell development.
(a) The progression of in vitro T cell development in the OP9-DL1 and HSC co-culture system. The effect of SCD1 inhibitor at a concentration of 40 nM was tested. The expression of CD44 and CD25 was used to monitor T cell developmental stages. (b) The proliferation of OP9-DL1 cells treated with SCD1 inhibitor at indicated doses was measured by CCK8 (n=5 for each group). (c) Apoptosis in OP9-DL1 cells treated with SCD1 inhibitor at indicated doses was determined by Propidium Iodide/Annexin V staining (n=4 for each group). (d) Schematic representation of different treatment protocols employed in the in vitro T cell developmental system. HSCs with indicated background cultured on OP9-DL1 cells with different treatments were matured into DN3 stages and then co-transferred to Rag2−/− mice. (e) Representative gating strategies (with the spleen as a representative) for analyzing T cells isolated from Rag2−/− mice receiving DN3 co-transferred as described in Extended Data Fig. 7d. (f) DN3 derived Treg cells in different tissues of Rag2−/− recipient mice were analyzed by flow cytometry (n=7 mice). (g) The levels of CD4+Foxp3+ Treg cells in the blood, liver, and lungs of mice in Fig. 3e. (h-i) The percentage and absolute number of Helios RORgt+ and Helios+ RORgt cells in the colon of mice with treatment as described in Fig. 3e (n=5 mice for WT-ND, WT-OA; n=4 for KO-DN, KO-OA). Data are presented as Mean ± SEM. ns, no significance; by unpaired two-tailed Student’s t-test (b, c, g, h, i) or paired two-tailed Student’s t-test (f).
Extended Data Fig. 8:
Extended Data Fig. 8:. The impact of Scd1 deficiency on the health status and thymic epithelial cells.
(a) Weight of body, spleen, and MLN of K14creScd1loxp and Scd1loxp mice (n=5 mice for each group). (b-c) The whole image and H&E staining of various organs of K14creScd1loxp and Scd1loxp mice. (d) Gating strategies used for identifying cortical thymic epithelial cells (cTEC) and medullar thymic epithelial cells (mTEC) of Scd1+/− and Scd1−/− mice, with subsequent calculation of their absolute numbers (n=3 mice for each group). (e-f) cTEC and mTEC of Scd1+/− and Scd1−/− mice were isolated and subjected to mRNA sequencing analysis. The expression levels of critical regulators governing thymocyte migration, development, and selection in thymic epithelial cells were shown (e). The differentially expressed genes in cTEC or mTEC of Scd1+/− and Scd1−/− mice were shown in a volcano plot (f). (g) The percentage and absolute number of HeliosRORgt+Foxp3+ and Helios+ RORgtFoxp3+ cells in the colon of K14creScdloxp (n=5) and Scd1loxp (n=7) mice. (h-i) Average MALDI-TOF mass spectra of oleic acid in Figure 4a. Data are presented as Mean ± SEM. ns, no significance; by unpaired two-tailed Student’s t-test.
Extended Data Fig. 9:
Extended Data Fig. 9:. Evaluation on OT-II T cells developed in K14creScd1loxp mice.
(a) Schematic representation of the experimental design to assess the differentiation potential of OT-II cells developed in K14creScd1loxp or Scd1loxp mice. (b) Gating strategies (with the spleen as a representative) for identifying transferred OT-II T cells in the recipient mice (c) OT-II T cells developed in K14creScd1loxp or Scd1loxp mice were labeled with CFSE and co-cultured with splenocytes from CD45.1+WT mice in the presence of OVA323–339 peptide. The CFSE dilution in OT-II T cells was measured 96 hours post-stimulation. (d-g) CD45.2+CD4+CD62L+TCRVb5.1+ cells were isolated from the spleen of Scd1loxp or K14creScd1loxp mice and intravenously transferred to CD45.1+ WT recipient mice at a dose of 1 × 10⁷ cells per mouse. To test Treg generation, recipient mice were supplied with 2 mg/mL OVA in drinking water for 7 consecutive days and examined for the percentage and number of Foxp3+ OT-II T cells in the spleen, MLN and colon (n=5 mice for each group) (d). To test Th1 and Th17 cell induction, recipient mice were s.c. injected with OVA emulsified in CFA and examined for the percentage and number of IL-17- and IFNg-secreting OT-II T cells in the draining lymph nodes (DLN) and lungs (n=7 mice for each group) (e-f). To test Th2 cell induction, recipient mice were i.p. injected with OVA absorbed to alum adjuvant and examined for the percentage and number of IL-4-secreting OT-II T cells in the spleen and liver (n=4 mice for each group) (g). The percentage and absolute number of distinct OT-II cell subsets were determined. (h-k) OVA323–339 peptide was supplied to the co-culture of CD45.2+CD4+CD62L+TCRVb5.1+ cells and CD45.1+WT splenocytes to activate OT-II T cells in Th1 (n=4 biologically independent samples), Th2 (n=4 biologically independent samples), Th17 (n=3 biologically independent samples), or Treg (n=3 biologically independent samples) cell induction medium. Ninety-six hours later, the expression of IFNg, IL-4, IL-17, or Foxp3 was determined by flow cytometry. Data are presented as Mean ± SEM. ns, no significance; by unpaired two-tailed Student’s t-test.
Extended Data Fig. 10:
Extended Data Fig. 10:. Scd1 deficiency promotes ATP2A2 expression through modulating DOT1L activities.
(a) Heatmap display of ATAC-seq data from naïve CD4+ T and DN3 cells. (b) Venn diagram of overlapped differential ATAC peaks related genes. (c) Atp2a2 mRNA levels in naïve CD4+ T cells (n=4 per group). (d) SCD1 inhibitor A939572 (SCD1i, 40 nM) was supplied to the in vitro T cell developmental system. DN3 thymocytes were harvested for ATP2A2 analysis (repeated twice). (e-f) WT naïve T cells were cultured in the Treg induction medium with or without SCD1i. The ATP2A2 protein (e) and the Treg (f) levels were determined (repeated twice). (g) The statistical analysis of western blot as described in Figure 6c from 3 independent experiments. (h) Scramble siRNA (NC) or Atp2a2 siRNA was transfected to CD4+CD62L+ T cells. The knockdown efficiency was determined 24 hours post transfection (repeated twice). (i) SOCE in Scd1−/−CD4+CD62L+ T cells transfected with Atp2a2 siRNA or NC was detected. (j-k) WT CD4+CD62L+ T cells were transfected with adenovirus particles to overexpress ATP2A2 (n=3 for each group) (j). T cells were subsequently cultured in the Treg induction medium for another 3 days to evaluate Treg levels (k). (l) The heatmap showing the H3K79me2 levels at the genome of DN3 developed with or without SCD1i. (m) The H3K79me2 levels at the genetic locus of Atp2a2. (n-o) The statistical analysis of Figure 7f (n) and 7h (o) obtained from 4 independent experiments. (p) SCD1i and DOT1L inhibitor EPZ005676 were added to the in vitro T cell development system. The resultant DN3 thymocytes were examined for ATP2A2 expression (repeated twice). (q) The levels of oleic acid and stearic acid in the nucleus of thymocytes from Scd1−/− or Scd1+/− mice (n=6 for each group). (r) Palmitoleic acid (n=4) or Palmitic acid (n=3) was diluted to the indicated concentrations with 10% DMSO and supplied to an enzymatic reaction catalyzed by DOT1L. Data are presented as Mean ± SEM. ns, no significance; by unpaired two-tailed Student’s t-test (c, f, k, q) or paired two-tailed Student’s t-test (n, o).
Fig. 1:
Fig. 1:. Naïve CD4+ T cells of Scd1−/− mice, but not CD4creScd1loxp mice, have a cell-intrinsic preference for Treg differentiation.
a, EAE was induced in Scd1−/− and Scd1+/− mice, and disease scores were recorded. CD25 depleting antibody was injected on day 9 and 13 post EAE induction (n=4 mice for Scd1−/−+Iso, Scd1−/−+α-CD25; n=5 mice for Scd1+/−+Iso, Scd1+/− +α-CD25, repeated 3 times). b, CD4+Foxp3+Treg levels in Scd1−/− and Scd1+/− mice (n=5 mice per group, repeated 5 times). c, Splenic CD4+CD62L+T cells from Scd1−/− and Scd1+/− mice were cultured in Treg induction medium and evaluated for Foxp3 expression (p<0.001, n=3 biologically independent samples per group, repeated 5 times). d-e, Splenic CD4+CD45RBhigh T cells from Scd1−/− or Scd1+/− mice were transferred to Rag2−/− mice. The body weight (d), and Treg generation (e) of Rag2−/− recipients, were monitored (n=4 mice per group, repeated twice). f, Splenic CD4+CD45RBhigh T cells from CD45.2+Scd1−/− mice and CD45.1+ WT mice were co-transferred to Rag2−/− mice at a 1:1 ratio to evaluate Treg generation (n=4 mice per group, repeated twice). g, The clinical scores of EAE induced in CD4creScd1loxp and Scd1loxp mice (n=5 mice per group, repeated 3 times). h, CD4+Foxp3+ Treg levels in CD4creScd1loxp and Scd1loxp mice (n=8 mice per group, repeated for 3 times). i, Splenic CD4+CD62L+T cells of CD4creScd1loxp and Scd1loxp mice were subjected to the Treg induction medium and analyzed for Foxp3 expression (ns, n=3 biological independent samples per group, repeated 3 times). j-k, Splenic CD4+CD45RBhigh T cells of CD4creScd1loxp or Scd1loxp mice were transferred to Rag2−/− mice, and the body weight (j), as well as Treg generation in the periphery (k), were monitored in Rag2−/− recipients (n=4 mice per group, repeated twice). l, Splenic CD4+CD45RBhigh T cells isolated from CD45.2+CD4creScd1loxp and CD45.1+WT mice were co-transferred into Rag2−/− mice at a 1:1 ratio. The Treg levels were determined 8 weeks after T cell transfer (n=4 mice per group, repeated twice). Data are presented as Mean ± SEM. ns, no significance; by unpaired two-tailed Student’s t-test (a, b, c, d, e, g, h, i, j, k) or paired two-tailed Student’s t-test (f, l).
Fig. 2:
Fig. 2:. The Scd1 deficient thymic environment imprints DN3 thymocytes with subsequent Treg differentiation propensity.
a, Schematic representation of the bone marrow chimera experiment. The bone marrow cells were isolated from age- and sex-matched CD45.1+CD45.2+Scd1−/− mice and CD45.1+WT mice and mixed at a 1:1 ratio before intravenous administration to lethally irradiated (10 Gy) CD45.2+WT mice or CD45.2+Scd1−/− mice. b, The proportions of Foxp3+ Treg cells among CD4+ T cells derived from different donors (n=9 mice for WR, n=7 mice for KR, repeated twice). c, Splenic CD4+CD62L+T cells from different donors were sorted and cultured under the Treg induction medium for 72 hours and Foxp3 levels were determined (n=4 biologically independent samples per group, repeated twice). d, Schematic representation of the adoptive transfer experiments investigating the generation of Treg cells from different subsets of WT and Scd1−/− thymocytes. Each thymocyte population at the DN1, DN2, DN3, or DN4 stage from CD45.2+ Scd1−/− mice and CD45.1+ WT mice was mixed at a 1:1 ratio and co-transferred to irradiated (3 Gy) CD45.1+CD45.2+WT mice via intrathymic injection. e, The Treg cells generated from different thymocyte subsets were analyzed flowcytometrically 4 weeks post transfer (n=5 mice for DN1, DN2 transfer; n=6 mice for DN3, DN4 transfer, performed once). f, Splenic CD4+CD62L+ T cells were isolated from the recipient mice to evaluate their differentiation efficiency to Treg cells in vitro (ns for DN1 and DN2 transfer, p=0.002 for DN3 transfer, p<0.0001 for DN4 transfer, n=5 biologically independent samples per group, performed once). Data are presented as Mean ± SEM. ns, no significance; by unpaired two-tailed Student’s t-test (b, c, f) or paired two-tailed Student’s t-test (e).
Fig. 3:
Fig. 3:. Oleic acid mediates the effects of SCD1 on preprogramming DN3 thymocytes for peripheral Treg cell generation.
a, Profile of total fatty acids in the thymus of Scd1−/− (n=6) and Scd1+/− mice (n=4) using the liquid chromatography-mass spectrometry (LC/MS) method (repeated 5 times). b, Schematic representation of the co-transfer strategies of in vitro developed DN3 thymocytes with or without the SCD1 inhibitor (A939572, 40 nM). c, The levels of stearic acid (18:0) and oleic acid (18:1n9) in in vitro developed CD45.1+ WT and CD45.2+ Scd1−/−DN3 thymocytes in the presence or absence of the SCD1 inhibitor (n=4 for WT and KO, n=6 for WTI, n=8 for KOI, repeated 3 times). d, The Treg cell levels in Rag2−/− mice received in vitro developed DN3 thymocytes as shown in Fig. 3b (n=8 mice for WT+KO, n=7 mice WT+KOI, n=9 mice for WTI+KO, repeated twice). e, Schematic representation of the oleic acid-rich diet (OA) or normal diet (ND) feeding experiments with or without CD4-depleting antibody administrated on day 1 and day 7 (n=4 mice for each group, repeated 3 times). f, The stearic acid (18:0) and oleic acid (18:1n9) levels in the thymi of mice in Fig. 3e were determined. g, Splenic CD4+CD62L+ T cells isolated from mice in Fig. 3e were subjected to Treg differentiation, and the efficiency of Treg induction was analyzed (n=3 biologically independent samples, repeated 3 times). h, The proportion of Treg cells among CD4+ T cells in the spleen and MLN of mice in Fig. 3e was determined by flow cytometry. Data are presented as Mean ± SEM. ns, no significance; by unpaired two-tailed Student’s t-test (a, c, f, g, h) or paired two-tailed Student’s t-test (d).
Fig. 4:
Fig. 4:. Cre-mediated Scd1 deletion in thymic keratin14+ cells preprograms DN3 thymocytes with Treg cell propensity.
a, Mass spectrometry imaging of thymus sections of Scd1+/−, Scd1−/−, Scd1loxp, and K14creScd1loxp mice. Oleic acid signals were adjusted according to the levels of stearic acid to reflect the SCD1 activities in the thymus. b, Levels of CD4+Foxp3+ Treg cells in different organs of K14creScd1loxp and Scd1loxp mice (n=5 mice for Scd1loxp, n=4 mice for K14creScd1loxp, repeated 3 times). c, Splenic CD4+CD62L+ T cells of K14creScd1loxp and Scd1loxp mice were subjected to in vitro Treg differentiation (p<0.001, n=4 biologically independent samples for each group, repeated 3 times). d, EAE was induced in K14creScd1loxp and Scd1loxp mice, and disease scores were recorded daily (n=12 mice for Scd1loxp, n=10 mice for K14creScd1loxp, repeat twice). e, Mononuclear cells infiltrated into the spinal cords of K14creScd1loxp and Scd1loxp mice in Fig. 4d were counted on day 19 post-EAE induction. f, Foxp3 expression in CD4+ T cells isolated from the CNS of K14creScd1loxp and Scd1loxp mice with EAE induction in Fig. 4d was detected (p< 0.001, repeated twice). g, IFNγ and IL-17 expression by CD4+ T cells isolated from the CNS of K14creScd1loxp and Scd1loxp mice with EAE induction in Fig. 4d was detected (p<0.001 for both Th1 and Th17 comparisons, repeated twice). h, Thymocytes of CD45.2+ K14creScd1loxp and CD45.1+ WT mice at the DN2 or DN3 stage were mixed at a 1:1 ratio and co-transferred to irradiated (5 Gy) Rag2−/− mice. Treg cell levels in different tissues of Rag2−/− recipients were determined by flow cytometry (n=5 mice for each group, repeated twice). Data are presented as Mean ± SEM. ns, no significance; by unpaired two-tailed Student’s t-test (b, c, d, e, f, g) or paired two-tailed Student’s t-test (h).
Fig. 5:
Fig. 5:. Enhanced Treg differentiation and EAE resistance in nude mice transplanted with thymi from K14creScd1loxp mice.
a, Schematic representation of the thymus transplantation experiments. b, Gating strategies (with the spleen as a representative) employed for Treg analysis in Figure 5. c-e, Thymi of K14creScd1loxp mice and littermate controls were T cell-depleted and engrafted under the kidney capsule of C57BL/6 nude mice (n=6 mice for each group, repeated twice). Mice were euthanized 3 months post-transfer, and the total number of CD4+ T cells (c) and the ratio of CD4+Foxp3+/Total CD4+ T cells (d) in various organs were quantified. Splenic CD4+CD62L+ T cells from nude mice were subjected to Treg induction in vitro and examined for Foxp3 expression (e, n=4 biologically independent samples, p<0.001, performed once). f, EAE was induced in nude mice 3 months after thymus transplantation (n=5 mice for each group, performed once). Mice were immunized with MOG35–55 emulsified in CFA on day 1 and day 14, and disease scores were recorded daily. The incidence of EAE was also recorded. g-h, EAE mice were euthanized on day 45 post EAE induction. Splenocytes from nude mice in Fig. 5f were labeled with CFSE and stimulated with MOG35–55 (20 μg/ml) for 96 hours to assess CFSE dilution as an indicator of CD4+ T cell proliferation (g, n=3 biologically independent samples per group). The percentage of Foxp3+ T cells among total CD4+ T cells in the spleen, draining lymph node, and CNS in EAE mice from Fig. 5f was determined (h). Data are presented as Mean ± SEM. ns, no significance; by unpaired two-tailed Student’s t-test.
Fig. 6:
Fig. 6:. Scd1 deficiency augments ATP2A2 expression to facilitate Treg differentiation.
a, The screenshot of IGV browser of Atp2a2 gene locus in CD44CD25+ DN3 thymocytes and splenic CD4+CD62L+ T cells isolated from Scd1−/− and Scd1+/− mice. b, The ATP2A2 protein levels of splenic CD4+CD62L+ T cells isolated from Scd1−/− and Scd1+/− mice (repeated with 3 independent experiments). c, Western blotting analysis for the phosphorylation of Zap70, SLP76, PLCγ1, and LAT in activated naïve CD4+ T cells (repeated with 3 independent experiments). d, Naïve CD4+ T cells isolated from Scd1+/− and Scd1−/− mice were labeled with fluorescence, mixed at a 1:1 ratio, and loaded with calcium indicator for flow cytometrical detection of store-operated calcium entry induced by thapsigargin (TG) or crosslinking of anti-CD3/anti-CD28 by goat anti-hamster IgG (GAH) (repeated with 3 independent experiments). e, Store-operated calcium entry in splenic CD4+CD62L+ T cells transfected with Atp2a2 siRNA or scramble siRNA (NC) was detected by flow cytometry (repeated with 3 independent experiments). f, Naïve T cells from Scd1−/− and Scd1+/− mice were transfected with Atp2a2 siRNA or scramble siRNA (NC), rested for 24 hours, and then subjected to Treg differentiation medium for 72 hours. The efficiency of Treg induction was assessed (n=4 for each group, repeated for 3 times). g-h, Nuclear translocation of NFAT1 in CD4+ T cells isolated from Scd1−/− and Scd1+/− mice was examined by immunofluorescent staining upon anti-CD3/anti-CD28 stimulation for 120 min (repeated with 3 independent experiments). i, The binding of NFAT1 to the Foxp3 genetic locus in activated T cells was determined by the chromatin immunoprecipitation assay (n=4 biologically independent samples, repeated 3 times). Anti-Histone H3 (H3) and rabbit IgG (IgG) were served as positive control and negative control for the ChIP-qPCR analysis. Data are presented as Mean ± SEM. ns, no significance; by unpaired two-tailed Student’s t-test.
Fig. 7:
Fig. 7:. OA inadequacy unlashes DOT1L to promote H3K79me2-dependent ATP2A2 expression.
a-b, Histone modifications in DN3 thymocytes and naïve T cells isolated from Scd1+/− and Scd1−/− mice were determined by Mod Spec with 3 measurement repeats. (a) Heatmap display of the detected histone modifications. (b) The relative abundance of H3K79me2 in DN3 thymocytes and naïve CD4+ T cells. c, ChIP-qPCR analysis of histone modification levels at the Atp2a2 genetic locus of DN3 thymocytes from Scd1+/− and Scd1−/− mice (n=4 per group, repeated twice with biologically independent samples). d, ChIP-qPCR analysis of histone modification levels at the Atp2a2 genetic locus of naïve CD4+ T cells isolated from Scd1+/− and Scd1−/− mice (n=4 for H3K79me2, H3K9me3; n=3 for H3K4me2, H3K27me3, repeated twice with biologically independent samples). e-f, SCD1 inhibitor A939572 (40 nM) and oleic acid (20 μM) were supplied to the in vitro T cell development system. The resultant DN3 thymocytes were examined for the H3K79me2 levels at the Atp2a2 genetic locus (e, n=4 per group) and the protein levels of ATP2A2 (f), repeated with 3 independent experiments. g-h, SCD1 inhibitor A939572 (40 nM) and DOT1L inhibitor EPZ004777 (10 μM) were supplied to the in vitro T cell development system. The resultant DN3 thymocytes were examined for the H3K79me2 levels at the Atp2a2 genetic locus (g, n=4 per group) and the protein levels of ATP2A2 (h), repeated with 3 independent experiments. i, Oleic acid or stearic acid was diluted to the indicated concentrations with 10% DMSO and supplied to an enzymatic reaction catalyzed by DOT1L (n=4 for oleic acid, n=3 for stearic acid, repeated 3 times). The effects of oleic acid and stearic acid on the enzymatic activity of DOT1L were determined by the DOT1L Chemiluminescent Assay Kit (BPS Bioscience, cat no.52202). Data are presented as Mean ± SEM. ns, no significance; by unpaired two-tailed Student’s t-test.

References

    1. Cooper MD & Alder MN The evolution of adaptive immune systems. Cell 124, 815–822 (2006). - PubMed
    1. Irla M Instructive Cues of Thymic T Cell Selection. Annu Rev Immunol 40, 95–119 (2022). - PubMed
    1. Kadouri N, Nevo S, Goldfarb Y & Abramson J Thymic epithelial cell heterogeneity: TEC by TEC. Nat Rev Immunol 20, 239–253 (2020). - PubMed
    1. Klein L, Kyewski B, Allen PM & Hogquist KA Positive and negative selection of the T cell repertoire: what thymocytes see (and dont’ see). Nat Rev Immunol 14, 377–391 (2014). - PMC - PubMed
    1. Taniuchi I CD4 Helper and CD8 Cytotoxic T Cell Differentiation. Annu Rev Immunol 36, 579–601 (2018). - PubMed

LinkOut - more resources