. 2024 Jan;31(1):90-105.
doi: 10.1038/s41418-023-01243-9. Epub 2023 Dec 7.

The bone-liver interaction modulates immune and hematopoietic function through Pinch-Cxcl12-Mbl2 pathway

Affiliations

The bone-liver interaction modulates immune and hematopoietic function through Pinch-Cxcl12-Mbl2 pathway

Tailin He et al. Cell Death Differ. 2024 Jan.

Abstract

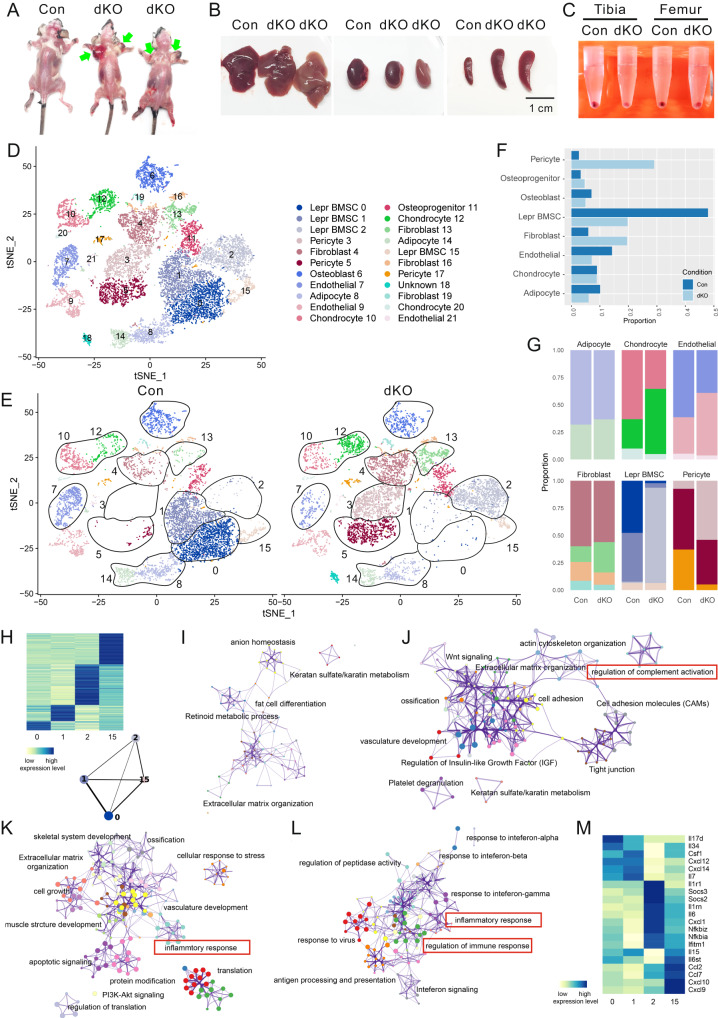
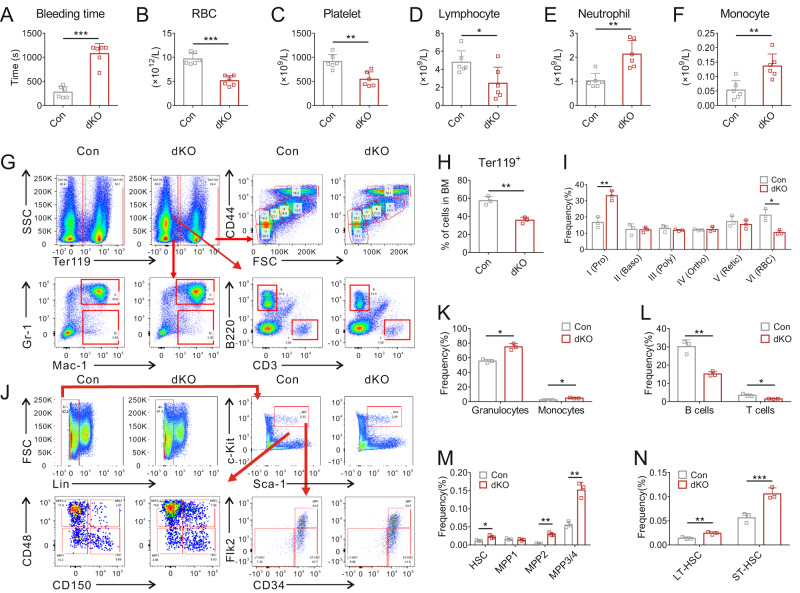
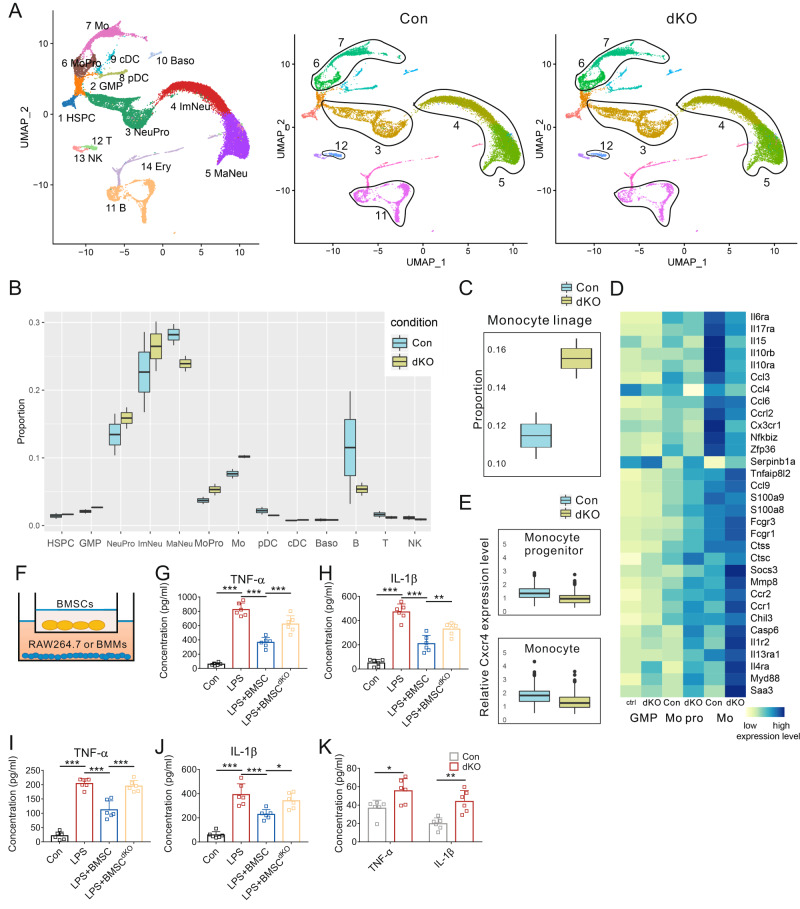
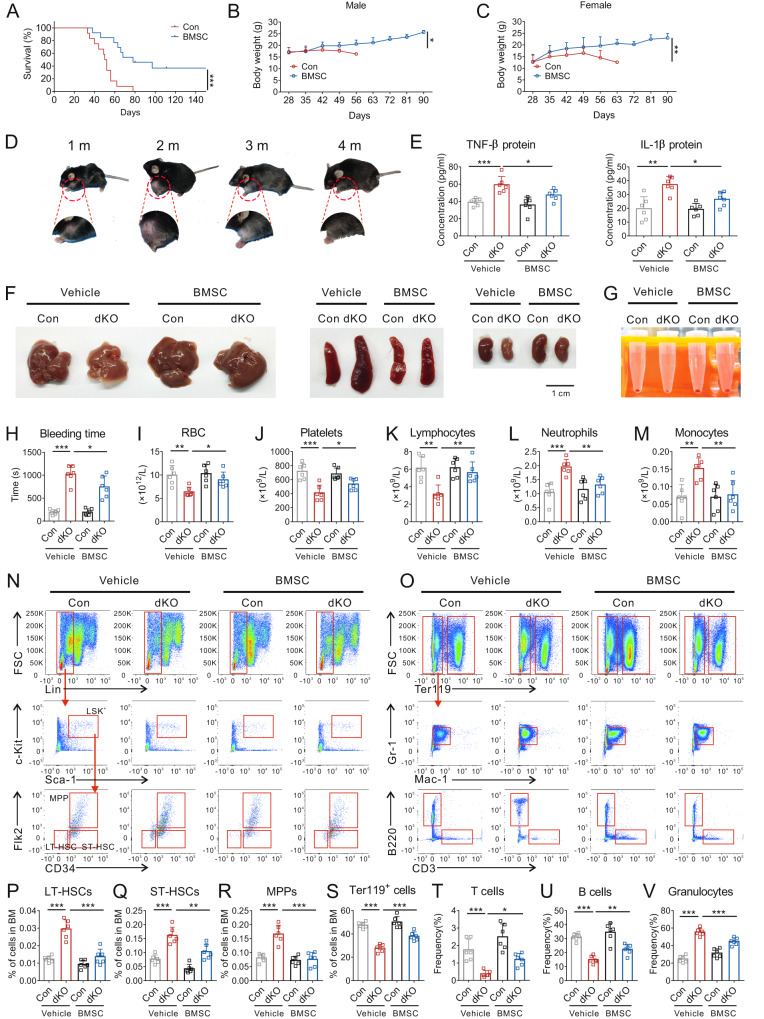
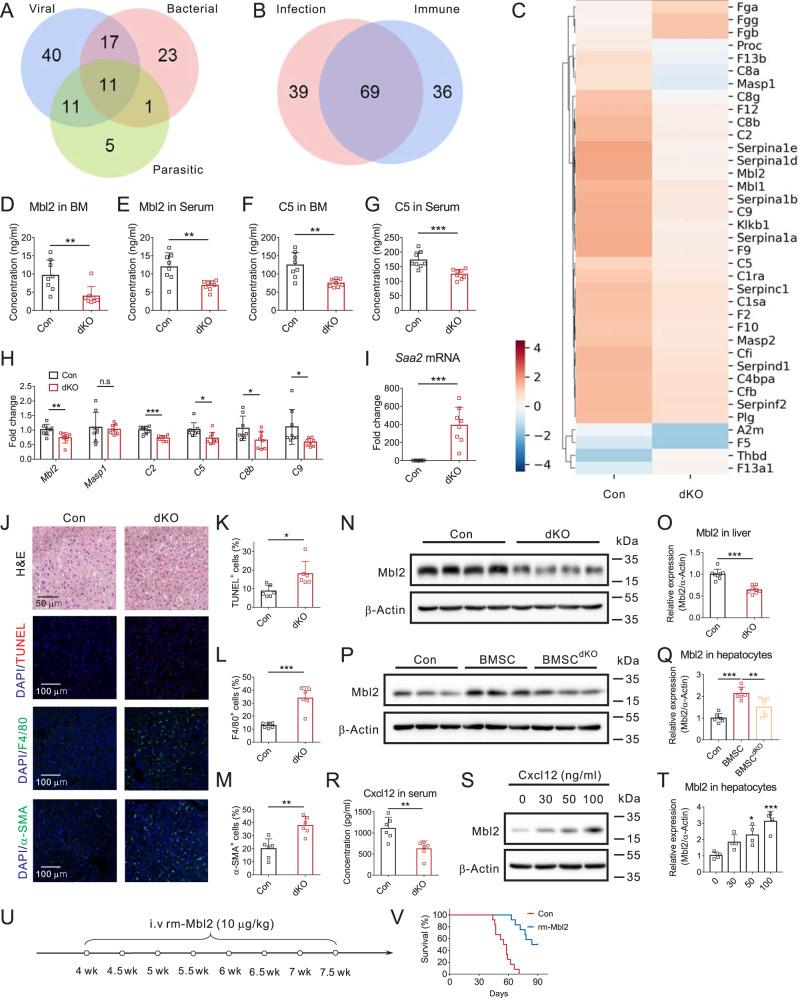
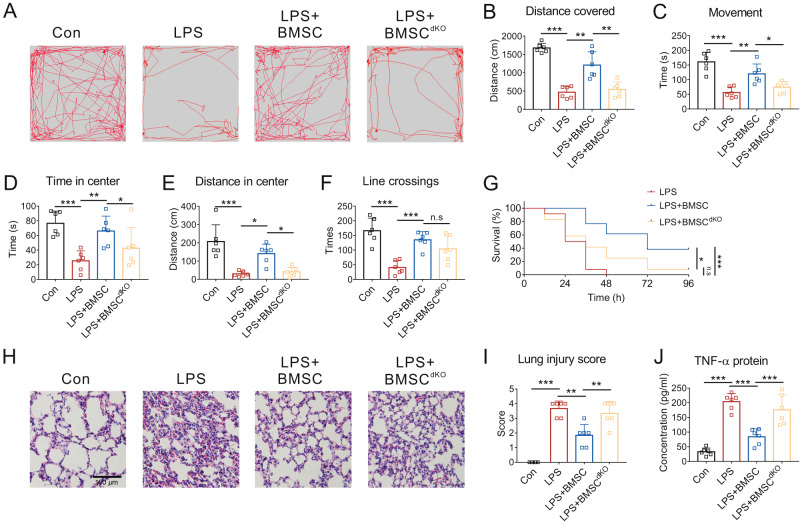
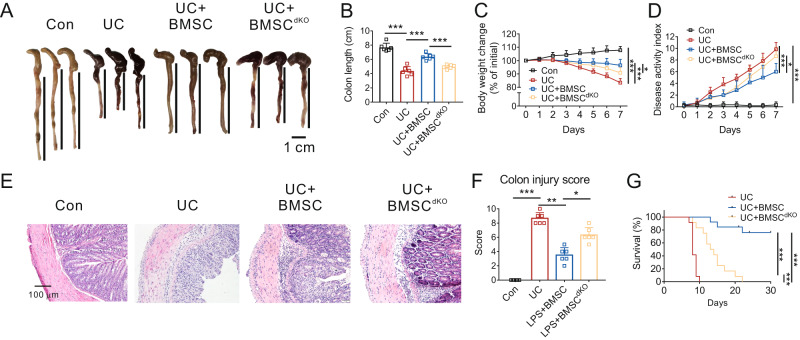
Mesenchymal stromal cells (MSCs) are used to treat infectious and immune diseases and disorders; however, its mechanism(s) remain incompletely defined. Here we find that bone marrow stromal cells (BMSCs) lacking Pinch1/2 proteins display dramatically reduced ability to suppress lipopolysaccharide (LPS)-induced acute lung injury and dextran sulfate sodium (DSS)-induced inflammatory bowel disease in mice. Prx1-Cre; Pinch1f/f; Pinch2-/- transgenic mice have severe defects in both immune and hematopoietic functions, resulting in premature death, which can be restored by intravenous injection of wild-type BMSCs. Single cell sequencing analyses reveal dramatic alterations in subpopulations of the BMSCs in Pinch mutant mice. Pinch loss in Prx1+ cells blocks differentiation and maturation of hematopoietic cells in the bone marrow and increases production of pro-inflammatory cytokines TNF-α and IL-1β in monocytes. We find that Pinch is critical for expression of Cxcl12 in BMSCs; reduced production of Cxcl12 protein from Pinch-deficient BMSCs reduces expression of the Mbl2 complement in hepatocytes, thus impairing the innate immunity and thereby contributing to infection and death. Administration of recombinant Mbl2 protein restores the lethality induced by Pinch loss in mice. Collectively, we demonstrate that the novel Pinch-Cxcl12-Mbl2 signaling pathway promotes the interactions between bone and liver to modulate immunity and hematopoiesis and may provide a useful therapeutic target for immune and infectious diseases.


Conflict of interest statement

The authors declare no competing interests.

Figures

Fig. 1
Fig. 1. Pinch1Prx1; Pinch2-/- (dKO) mice display abnormal appearance, cell population structure and gene expression patterns.
A Representative pictures of 6-wk-old male control (Pinch1f/f; Pinch2−/−), and Pinch1Prx1; Pinch2−/− (dKO) mice removing the skin. B Representative pictures of organs from 6-wk-old male control and dKO mice. Scale bar, 1 cm. C Whole bone marrow cells of the tibia or femur from control and dKO mice. Visualization of bone marrow Lepr+ cells in UMAP. Lepr+ cells from control group and dKO group were visualized together (D) or separately (E). Cells were colored by their clusters. F Cell proportion of major cell types in control group and dKO group. G Proportion of each cluster in each major cell type in control group and dKO group. Color of each cluster was indicated as in (D). H Expression of top differential genes and connectivity analysis in each Lepr+ BMSCs clusters. Functional enrichment analysis using differentially expressed genes (absolute log2 fold change >0.2) between control group and dKO group for cluster 0 (I), cluster 1 (J) cluster 2 (K), and cluster 15 (L). M Expression of immune response related genes across four Lepr+ BMSCs clusters.
Fig. 2
Fig. 2. Pinch loss dramatically altered hematopoietic progenitors and linages.
A Tail bleeding time measured in control and dKO mice (n = 6). BF Routine blood examination of 6-wk-old male control and dKO mice (n = 6). GN FACS analysis of bone marrow cells in 6-wk-old male control and dKO mice (n = 3). Data are mean ± SD of 3 independent experiments. *P < 0.05; **P < 0.01; ***P < 0.001.
Fig. 3
Fig. 3. Pinch loss significantly stimulates inflammatory response related genes in monocytes.
A Visualization of bone marrow hematopoietic cells in 6-wk-old male control and dKO mice in UMAP using scRNA-seq. B Cell proportion of each cell type in 6-wk-old male control and dKO mice using scRNA-seq. C Cell proportion of monocyte lineage cells in control group and dKO group. D Expression levels of immune related genes in GMPs, monocyte progenitors (MoPro), and Monocytes (Mo) in 6-wk-old male control and dKO mice. E Expression level of Cxcr4 in neutrophil progenitors, immature neutrophils, mature neutrophils, monocyte progenitors, and monocytes. F A diagram of co-culture system. BMSCs are seeded in the top wells, and RAW264.7 cells or primary bone marrow monocytes were seeded in the bottom wells, with pretreatment with or without LPS. TNF-α (G) and IL-1β (H) concentrations in the culture medium of RAW264.7 cells after co-cultured with BMSC or BMSCdKO followed by LPS challenge (n = 6). Data are mean ± SD of 3 independent experiments. TNF-α (I) and IL-1β (J) concentrations in the culture medium of primary bone marrow monocytes after co-cultured with BMSC or BMSCdKO followed by LPS challenge (n = 6). Data are mean ± SD of 3 independent experiments. K Serum TNF-α and IL-1β concentrations in 6-wk-old male control and dKO mice (n = 6). Data are mean ± SD of 3 independent experiments. *P < 0.05; **P < 0.01; ***P < 0.001.
Fig. 4
Fig. 4. Intravenous injection of BMSCs ameliorates immune and hematopoietic function of dKO mice.
A Survival curves of mice after treatment of BMSCs (106 BMSCs dissolved in normal saline per mouse, n = 12). B, C Body weight change of mice after treatment of BMSCs (n = 6–12 at each time point). D Representative pictures of 1 to 4-month-old male control and dKO mice subjected to BMSCs. E Serum TNF-α and IL-1β concentrations in male control and dKO mice 2 months after subjected to BMSCs or 1 month after subjected to corresponding vehicle (n = 6). F Representative pictures of organs from male control and dKO mice subjected to BMSCs or corresponding vehicle. G Whole bone marrow cells of the tibia or femur from male control and dKO mice subjected to BMSCs or corresponding vehicle. H Tail bleeding time measured in male control and dKO mice subjected to BMSCs or corresponding vehicle (n = 6). IM Routine blood examination of male control and dKO mice subjected to BMSCs or corresponding vehicle (n = 6). NV FACS analysis of bone marrow cells in male control and dKO mice subjected to BMSCs or corresponding vehicle (n = 6). Data are mean ± SD of 3 independent experiments. *P < 0.05; **P < 0.01; ***P < 0.001.
Fig. 5
Fig. 5. Complement lectin pathway contributes to hematopoietic and immune-regulatory roles of Pinch1/2.
A Venn diagram of dysregulated factors related to infectious diseases in the bone marrow supernatant of dKO mice. B Venn diagram of dysregulated factors in the bone marrow supernatant of dKO mice (infectious disease or immune disease). C Heatmap of dysregulated factors in the complement and coagulation cascades identified through MS in the bone marrow supernatant from control mice and dKO mice. The level of Mbl2 in bone marrow supernatant (D) or serum (E) from control mice and dKO mice (n = 8). The level of Complement component 5 in bone marrow supernatant (F) or serum (G) from control mice and dKO mice (n = 8). H, I qPCR analysis of some dysregulated factors in the complement and coagulation cascades identified through MS in the bone marrow supernatant from control mice and dKO mice (n = 8). J Representative images of H&E staining, TUNEL staining, and IF staining of F4/80 and α-SMA. Quantification of TUNEL+ cells (K), F4/80+ cells (L) and α-SMA+ cells (M) in the liver (n = 6). Data are mean ± SD of 3 independent experiments. N, O Representative protein expression level (n = 8 in total) and quantification of Mbl2 in the liver (n = 8 in total). Data are mean ± SD of 3 independent experiments. P, Q Representative protein expression level (n = 6 in total) and quantification of Mbl2 in primary hepatocytes co-cultured with BMSC or BMSCdKO. Data are mean ± SD of 3 independent experiments. R The level of Cxcl12 in serum from control mice and dKO mice (n = 6). S, T Representative protein expression level and quantification of Mbl2 in primary hepatocytes stimulated with Cxcl12 for 24 h (n = 4). Data are mean ± SD of 3 independent experiments. U A schematic diagram illustrating the experimental design of rm-Mbl2 administration. V Survival curves of mice after treatment rm-Mbl2 (dissolved in normal saline, n = 12). *P < 0.05; **P < 0.01; ***P < 0.001.
Fig. 6
Fig. 6. Depletion of Pinch impairs the effects of BMSCs in treatment of acute lung injury induced by LPS.
AF Track plots (A), distance covered (B), movement time (C), distance covered in the center zone (E), and line crossing times (F) during the open field test. Mice were administrated with BMSC or BMSCdKO or corresponding vehicle (normal saline) followed by administration of LPS (10 mg/kg) or normal saline (n = 6). G Survival curve of LPS-induced acute lung injury. Mice were administrated with BMSC or BMSCdKO or corresponding vehicle (normal saline) followed by administration of LPS (30 mg/kg) or normal saline (n = 12). H, I Representative images of H&E staining for lung sections 24 h after acute lung injury model followed by quantification (scale bar = 100 μm). J Serum TNF-α concentrations in mice 24 h after administrated with BMSC or BMSCdKO followed by administration of LPS (n = 6) Results were normalized to Gapdh. Data are mean ± SD of 3 independent experiments. *P < 0.05; **P < 0.01; ***P < 0.001.
Fig. 7
Fig. 7. Depletion of Pinch impairs the effects of BMSCs in treatment of DSS-induced experimental colitis in mice.
A Macroscopic appearances of colons in each group mice. B The quantification of colon length (n = 6). C Loss of basal body weight from day 0 to day 7 (%) after DSS induction (n = 6). D Mean DAI evaluations from day 0 to day 7 in each group (n = 6). E, F H&E staining of colonic sections (scale bar = 100 μm) followed by quantification. G Survival curve of DSS-induced acute inflammatory bowel disease. Mice were administrated with BMSC or BMSCdKO or corresponding vehicle (normal saline) followed by freely drinking water containing DSS (4%) or normal drinking water for 7 days (n = 12). Data are mean ± SD of 3 independent experiments. *P < 0.05; **P < 0.01; ***P < 0.001.

Similar articles

Cited by

References

    1. Singer NG, Caplan AI. Mesenchymal stem cells: mechanisms of inflammation. Annu Rev Pathol. 2011;6:457–78. doi: 10.1146/annurev-pathol-011110-130230. - DOI - PubMed
    1. Uccelli A, Moretta L, Pistoia V. Mesenchymal stem cells in health and disease. Nat Rev Immunol. 2008;8:726–36. doi: 10.1038/nri2395. - DOI - PubMed
    1. Weiss ARR, Dahlke MH. Immunomodulation by Mesenchymal Stem Cells (MSCs): mechanisms of action of living, apoptotic, and dead MSCs. Front Immunol. 2019;10:1191. doi: 10.3389/fimmu.2019.01191. - DOI - PMC - PubMed
    1. Weissman IL. Developmental switches in the immune system. Cell. 1994;76:207–18. doi: 10.1016/0092-8674(94)90329-8. - DOI - PubMed
    1. Gotts JE, Matthay MA. Sepsis: pathophysiology and clinical management. BMJ. 2016;353:i1585. doi: 10.1136/bmj.i1585. - DOI - PubMed

Publication types