. 2023 Dec 7;24(1):281.
doi: 10.1186/s13059-023-03125-2.

GCLiPP: global crosslinking and protein purification method for constructing high-resolution occupancy maps for RNA binding proteins

Affiliations

GCLiPP: global crosslinking and protein purification method for constructing high-resolution occupancy maps for RNA binding proteins

Wandi S Zhu et al. Genome Biol. .

Abstract

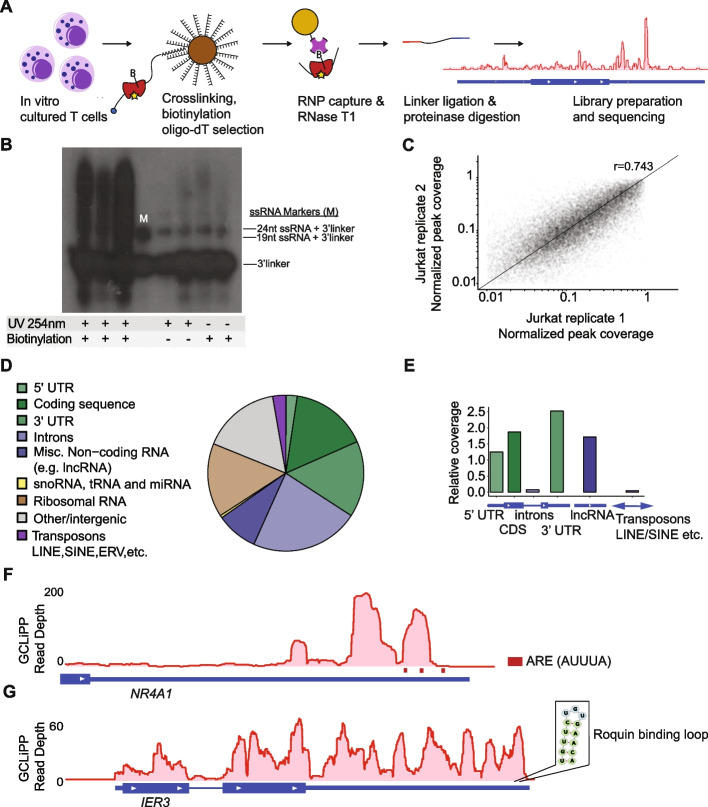
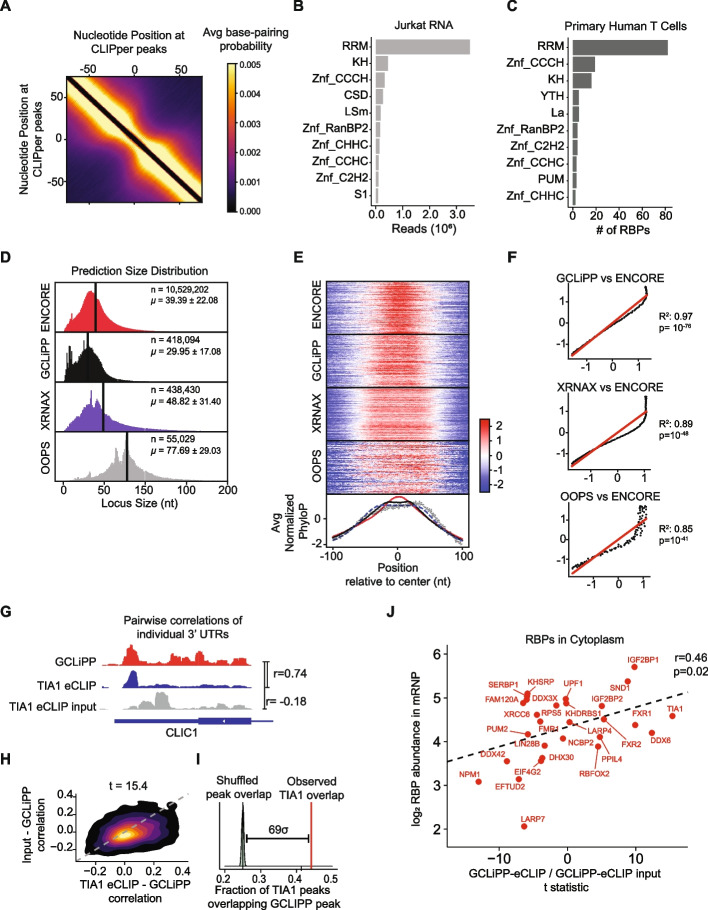
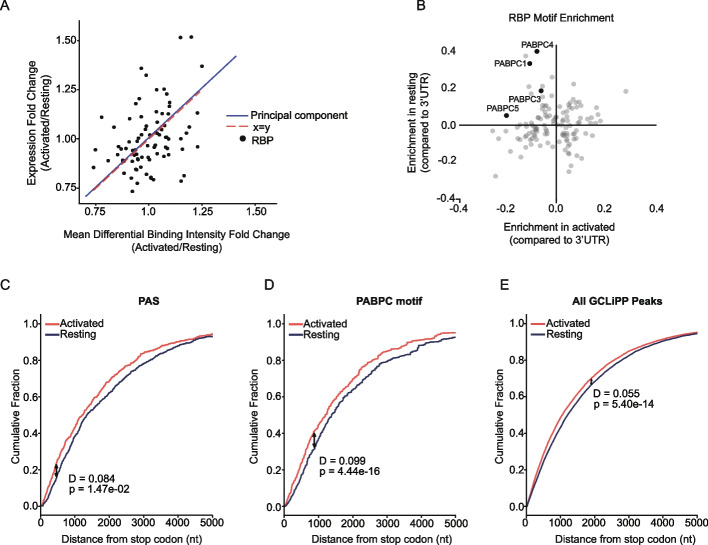
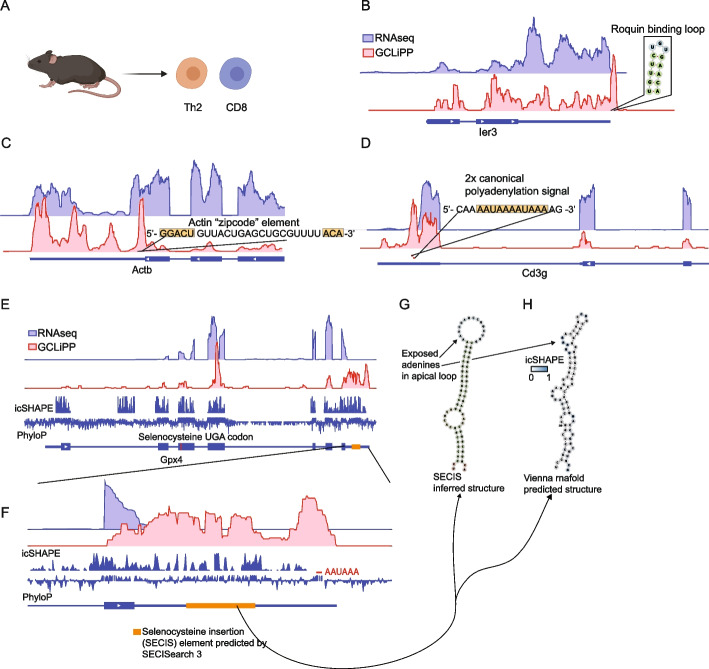
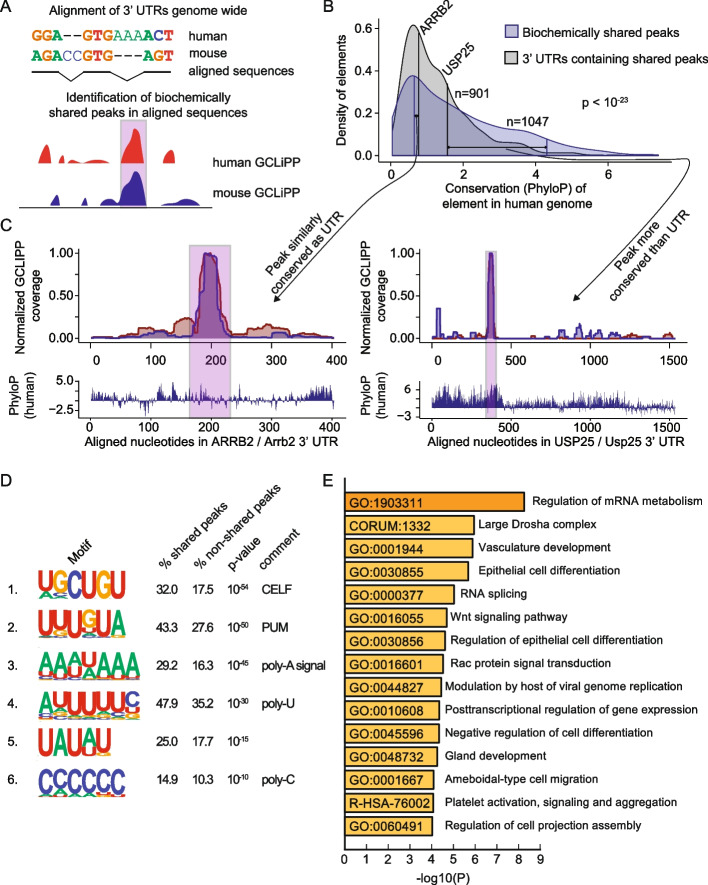
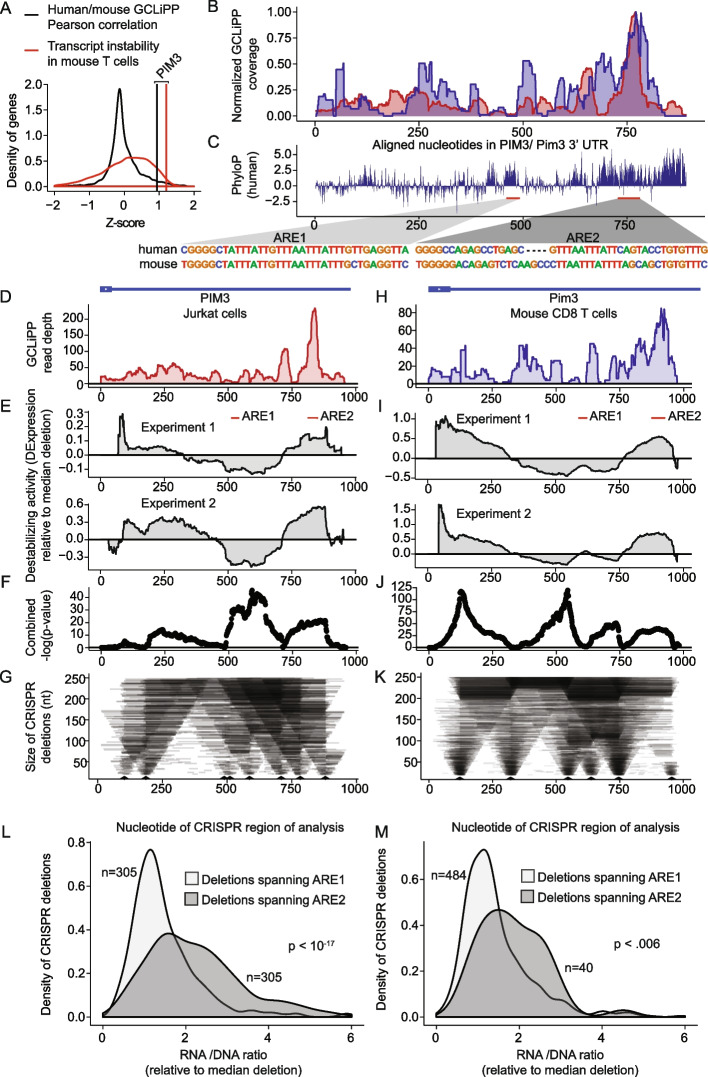
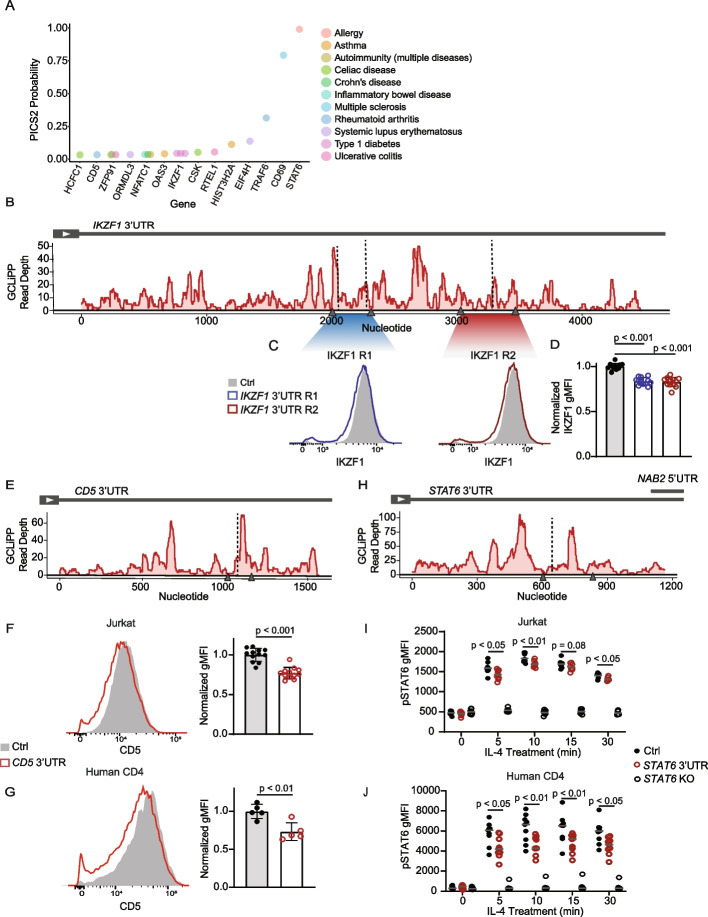
GCLiPP is a global RNA interactome capture method that detects RNA-binding protein (RBP) occupancy transcriptome-wide. GCLiPP maps RBP-occupied sites at a higher resolution than phase separation-based techniques. GCLiPP sequence tags correspond with known RBP binding sites and are enriched for sites detected by RBP-specific crosslinking immunoprecipitation (CLIP) for abundant cytosolic RBPs. Comparison of human Jurkat T cells and mouse primary T cells uncovers shared peaks of GCLiPP signal across homologous regions of human and mouse 3' UTRs, including a conserved mRNA-destabilizing cis-regulatory element. GCLiPP signal overlapping with immune-related SNPs uncovers stabilizing cis-regulatory regions in CD5, STAT6, and IKZF1.

Keywords: Cis-regulatory elements; Post-transcriptional regulation; RNA-binding proteins (RBP); T cells.


Conflict of interest statement

The authors declare that they have no competing interests.

Figures

Fig. 1
Fig. 1
GCLiPP sequencing reveals RNA transcript protein occupancy. A GCLiPP method of global RBP profiling. T cell RNAs are crosslinked to RBPs and lysates are biotinylated on primary amines. mRNAs are enriched with oligo-dT beads, and RBP-protected sites are digested, captured, sequenced, and aligned to the genome. B Film image of RBP-bound RNAs captured from Jurkats that underwent either UV crosslinking (UV 254 nm), protein biotinylation, or both. Lane marked “M” contains 19 and 24 nucleotide (nt) ssRNA ligated to radiolabeled 3′linker. RNA greater than 24nt + 3′linker size were extracted and processed for sequencing. C Normalized GCLiPP read depth (fraction of reads in called peak relative to all GCLiPP reads in annotated 3′ UTR) in two replicates of Jurkat cells. ρ represents Pearson correlation. D Proportion of mapped GCLiPP reads derived from genomic features. E Relative coverage of genomic features in GCLiPP sequencing reads relative to total length of genomic features of indicated class. F GCLiPP track of NR4A1 3′UTR. Red bars indicate presence of ARE motif (AUUUA). G GCLiPP track of IER3 gene along with predicted ROQUIN binding loop in the 3′UTR
Fig. 2
Fig. 2
GCLiPP detects cytosolic RBP binding sites with characteristic sequence conservation and structural properties. A Base-pairing probability was calculated for each pair of nucleotides within 200 bp peak called by CLIPper2.0 in Jurkat cells. The average base-pairing matrices for all peaks in the 3UTR is shown here as a heatmap. B Jurkat RNAseq reads mapped to known RBPs were categorized into different RBDs. Top 10 occurring domains were determined by total reads that can be ascribed to specific domain motif. C Number of RBPs identified through RNA-IC in activated primary human T cells that contain a certain domain. Only top 10 occurring motifs are shown. RBPDB databased was used as a reference for categorizing RBPs in B and C. D Size distribution of n CLIPper-called peaks from datasets of RBP binding detected by GCLiPP, phase-separation methods XRNAX and OOPS, and an amalgamation of 87 RBP eCLIP datasets from ENCORE. µ = mean ± standard deviation. E Sequence conservation of called peaks from D expressed as normalized PhyloP score relative to the peak center. Histograms at bottom show the global average for all peaks for each method. F Normalized PhyloP data from E transformed to display the correlation between eCLIP (y-coordinate) and the indicated methods (x-coordinate) as a function of the distance from peak center. Linear regression statistics and the line of unity (in red) are indicated on each plot. G Genomic snapshots of individual 3 UTR showing exemplary correlation between TIA1 eCLIP dataset and GCLiPP. GCLiPP is shown in red, while the indicated RBP eCLIP data is shown in blue, and matched control input samples are shown in gray for the 3 UTRs of the indicated gene. r indicates Pearson correlation between pairs of normalized read density at a given nucleotide for the indicated comparisons. H 2D density plots showing matched correlations between GCLiPP and TIA1 eCLIP (X-axis) and GCLiPP and the matched control input sample (Y-axis) for individual 3 UTR for all expressed genes in eCLIP and GCLiPP datasets. The t-statistic shown is for a paired t-test of the correlations. I Overlap of CLIPper-called peaks in 3 UTRs in GCLiPP and eCLIP. Red lines indicate observed overlap of GCLiPP peaks and eCLIP peaks. Gray distribution represents bootstrapped expected overlap, derived by computing overlap of GCLiPP-called peaks with eCLIP peaks shuffled within the same 3UTR. This analysis was repeated 500 times. The indicated distance represents the number of standard deviations above the mean shuffled overlap of the observed overlap. J Correlation of eCLIP-GCLiPP paired t-tests from H and cytosolic RBP abundance in mRNPs
Fig. 3
Fig. 3
Activation-induced changes in RBP binding. A Correlation between activation-induced changes in RBP expression and protein occupancy at corresponding binding sites in Jurkat cells. Mean differential binding intensities were calculated for sets of GCLiPP peaks defined by their overlap with specific RBP binding in ENCODE eCLIP datasets. Dots represent individual RBPs, and lines show the concordance between the first principal component (blue) describing variation within these data with the line of unity (red). B Enrichment of RBP consensus binding motifs centered within regions with increased GCLiPP signal in activated vs. resting Jurkat cells. Genomically encoded motifs recognized by 4 PABPC family members were enriched in regions differentially bound in resting, but not activated Jurkat cells. C–E Cumulative distribution function (CDF) plots depicting the distance from the translation stop codon for the top 10% of differentially bound regions in activated compared to resting Jurkat cells filtered for those containing a canonical PAS (C), genomic templated PABPC binding site (D), or any GCLiPP peak (E)
Fig. 4
Fig. 4
GCLiPP recapitulates previously described mRNA-RBP interactions in primary T cells. A GCLiPP was performed on primary mouse Th2 and CD8 T cells. RNAseq and GCLiPP tracks for B Ier3, C Actb, D Cd3g, and E–G Gpx4. RNAseq tracks are from resting Th2 cells. GCLiPP tracks show the sum of five experiments, three in Th2 and two in CD8 T cells. Location of known RBP binding determinants are shown as insets
Fig. 5
Fig. 5
Comparison between mouse and human GCLiPP reveals principles of shared post-transcriptional regulation. A Schematic illustration of 3′ UTR alignment and biochemically shared GCLiPP peak calling. B Distribution of conservation across 100 vertebrates (PhyloP score) of regions in the human genome. Blue indicates biochemically shared peaks and gray indicates the 3′ UTRs of the transcripts that those peaks are contained within. For both peaks within ARRB2 and USP25, their matched conservation of peak and UTR are indicated by connected vertical lines. C Human and mouse normalized GCLiPP density and conservation (PhyloP) across aligned nucleotides of the indicated 3′ UTRs. Biochemically shared peaks of GCLiPP read density are indicated in pink. D HOMER called motifs enriched in biochemically shared peaks. Percentages indicate the frequency of occurrence of the indicated motif in biochemically shared peaks versus non-shared background peaks. P-value indicates HOMER calculated p-value of enrichment. E Metascape called biological enrichment categories of genes containing biochemically shared peaks. The background set was all genes that contained peaks in both mouse and human GCLiPP datasets that did not contain a shared peak
Fig. 6
Fig. 6
Biochemically and functionally shared post-transcriptional regulation of PIM3 in human and mouse cells. A Z-scores of Pearson correlation between mouse and human GCLiPP (black distribution) and transcript instability as measured by comparing transcript read abundance in untreated versus actinomycin D-treated mouse T cells (red distribution) for 7541 genes with matched data. Vertical lines indicate observations for PIM3. B Normalized human and mouse GCLiPP read density and C PhyloP across aligned nucleotides of PIM3 3′ UTR (as depicted in Fig. 5). Insets show sequences of putative regulatory elements. D–G Dissection of human PIM3 3′UTR in Jurkat T cells. D GCLiPP peaks aligned to schematic illustration of 3′UTR. E Change in expression along the 3′UTR relative to median expression of all possible deletions. Per-nucleotide effect score was calculated by comparing median normalized RNA/gDNA ratio for all shown deletions spanning a given nucleotide with median of all shown deletions. Experiment 1 and 2 are biological duplicates which were transfected with 80 or 120 μM of gRNAs respectively. Red bars indicate putative ARE-containing cis-regulatory elements. F Unadjusted − log10 p-values from Welch’s two sample t-test comparing all deletions spanning a nucleotide with all other deletions across both replicate experiments in E. G Size of deletions generated using CRISPR-Cas9. Arrow heads represent gRNA placement. H–K Dissection of mouse PIM3 3′UTR. Data are represented identically to human data, except that mouse primary CD8 T cells were used, and both mouse experiments 1 and 2 used a gRNA concentration of 80 μM. L Effect of deletions spanning putative ARE-containing cis-regulatory elements. The RNA/DNA ratio for mutants deleting ARE1 and ARE2 are shown in human Jurkat T cells. M Same as in L but using data from mouse primary T cells
Fig. 7
Fig. 7
GCLiPP and PICS2-identified probable causal SNPs guide dissection of cis-regulatory elements in 3′UTR. A Top 15 PICS2 SNPs within GCLiPP peaks with gene location (x-axis) and ranked by PICS2 probability score (y-axis). Diseases associated with SNPs are marked by color. B GCLiPP track of IKZF1 3′UTR. Arrow heads represent gRNA placement to delete two regions (R1 and R2). Vertical dotted line indicates variant location. C Representative IKZF1 protein expression detected by intracellular flow cytometry in Jurkat cells edited with non-targeting control gRNAs (Ctrl), or paired gRNAs targeting IKZF1 3′UTR R1 (blue) or IKZF1 3′UTR R2 deletion (red). D Normalized IKZF1 gMFI for 3 replicate CRISPR targetings from 2 independent experiments. E GCLiPP track of CD5 3′UTR in Jurkats, similar annotations as B. F CD5 expression in Jurkats cells and G primary human CD4 T cells targeted with non-targeting control gRNAs (Ctrl; gray) or CD5 3′UTR gRNAs to induce deletion (red). Histogram shows representative flow cytometry data (left) and normalized geometric mean fluorescence intensity (gMFI) for F 3 replicate CRISPR targeting in 3 independent experiments for Jurkats and G 5 replicates of individuals or pooled individuals from 2 independent experiments for primary human T cells. H GCLiPP track of STAT6 3′UTR in Jurkats. I pSTAT6 gMFI of Jurkat cells or J primary human CD4 T cells polarized to Th2 cells targeted with non-targeting control (Ctrl), STAT6 coding region dual gRNAs (STAT6 KO) or STAT6 3′UTR paired gRNAs following treatment with IL-4 for 0, 5, 10, 15, or 30 min. Data are shown for I 2–3 replicate CRISPR targetings from 3 independent experiments for Jurkats and J 9 individuals or pooled individuals from 3 independent experiments for primary human CD4 T cells

References

    1. Garneau NL, Wilusz J, Wilusz CJ. The highways and byways of mRNA decay. Nat Rev Mol Cell Biol. 2007;8(2):113–26. doi: 10.1038/nrm2104. - DOI - PubMed
    1. Martin KC, Ephrussi A. mRNA Localization: gene expression in the spatial dimension. Cell. 2009;136(4):719–30. doi: 10.1016/j.cell.2009.01.044. - DOI - PMC - PubMed
    1. Reed R. Coupling transcription, splicing and mRNA export. Curr Opin Cell Biol. 2003;15(3):326–331. doi: 10.1016/S0955-0674(03)00048-6. - DOI - PubMed
    1. Keene JD. RNA regulons: coordination of post-transcriptional events. Nat Rev Genet. 2007;8(7):533–43. doi: 10.1038/nrg2111. - DOI - PubMed
    1. Castello A, Fischer B, Eichelbaum K, Horos R, Beckmann BM, Strein C, et al. Insights into RNA biology from an atlas of mammalian mRNA-Binding proteins. Cell. 2012;149(6):1393–406. doi: 10.1016/j.cell.2012.04.031. - DOI - PubMed

Publication types