. 2023 Dec 7;22(1):217.
doi: 10.1186/s12944-023-01942-9.

Comprehensive characterization of adipogenesis-related genes in colorectal cancer for clinical significance and immunogenomic landscape analyses

Affiliations

Comprehensive characterization of adipogenesis-related genes in colorectal cancer for clinical significance and immunogenomic landscape analyses

Jing Han et al. Lipids Health Dis. .

Abstract

Objective: Colorectal cancer (CRC) is a major global health concern, necessitating the identification of biomarkers and molecular subtypes for improved clinical management. This study aims to evaluate the clinical value of adipogenesis-related genes and molecular subtypes in CRC.

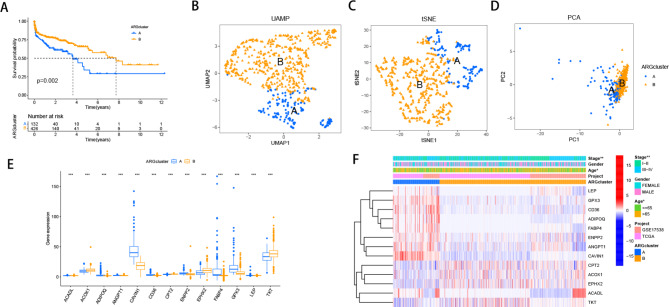
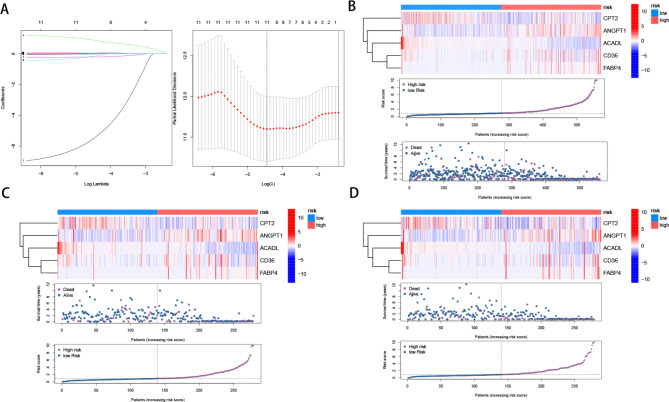
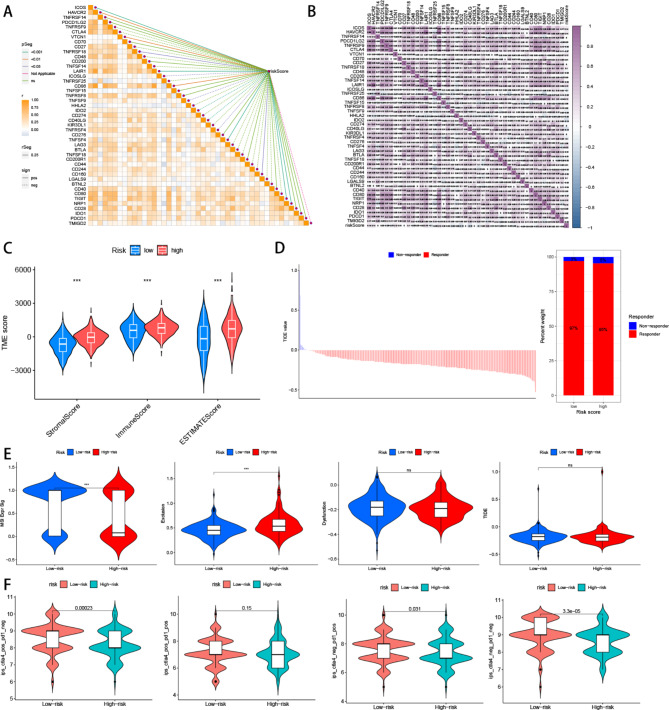
Methods: A comprehensive analysis of adipogenesis-related genes in CRC was performed using publicly available datasets (TCGA and GEO database) and bioinformatics tools. Unsupervised cluster analysis was employed to identify the molecular subtypes of CRC, while LASSO regression analysis was utilized to develop a risk prognostic model. The immunogenomic patterns and immunotherapy analysis were used to predict patient response to immunotherapy. Furthermore, qPCR analysis was conducted to confirm the expression of the identified key genes in vitro.

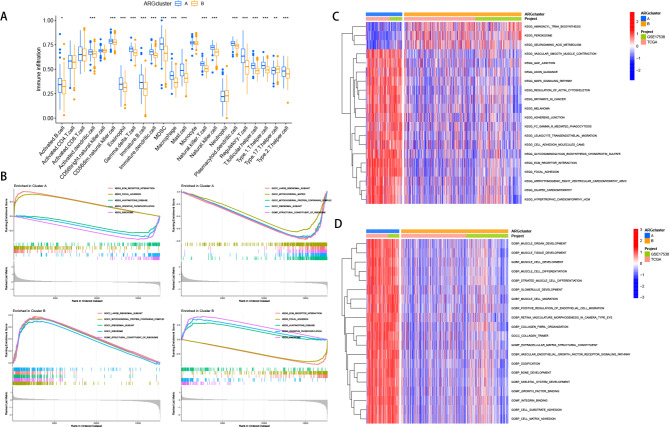
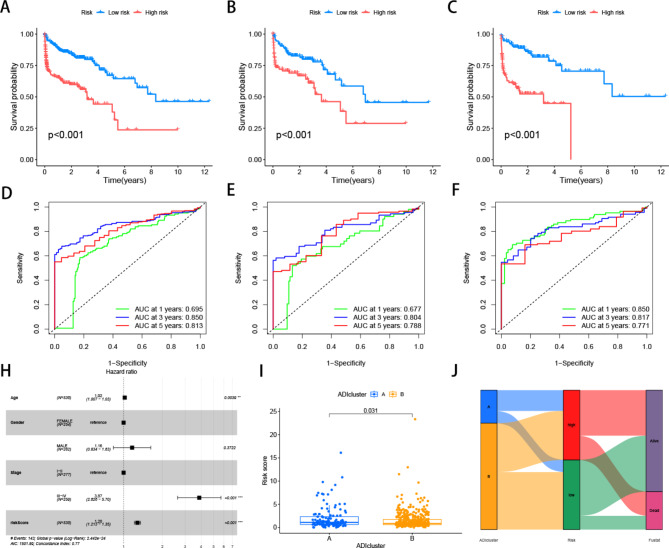
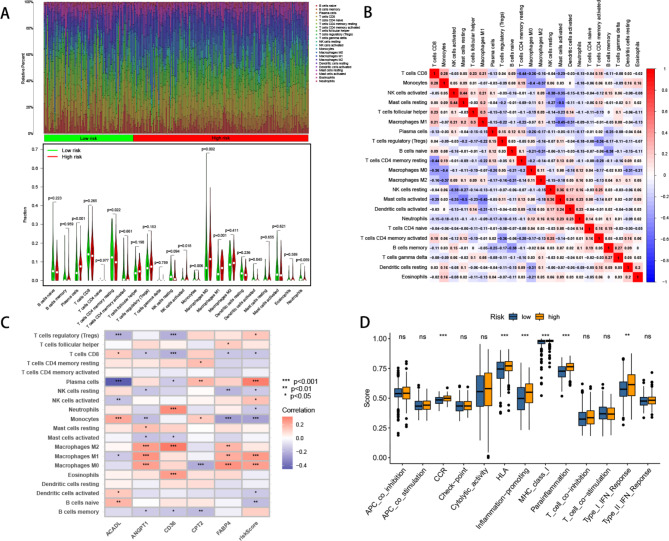
Results: Through the analysis of RNAseq data from normal and tumor tissues, we identified 50 differentially expressed genes. Unsupervised cluster analysis identified two subtypes (Cluster A and Cluster B) with significantly different survival outcomes. Cluster A and B displayed differential immune cell compositions and enrichment in specific biological pathways, providing insights into potential therapeutic targets. A risk-scoring model was developed using five ARGs, which successfully classified patients into high and low-risk groups, showing distinct survival outcomes. The model was validated and showed robust predictive performance. High-risk patients exhibited altered immune cell proportions and gene expression patterns compared to low-risk patients. In qPCR validation, four out of the five key genes were consistent with the results of bioinformatics analysis.

Conclusion: Overall, the findings of our investigation offer valuable understanding regarding the clinical relevance of ARGs and molecular subtypes in CRC, laying the groundwork for improved precision medicine applications and personalized treatment modalities.


Conflict of interest statement

The authors declare no competing interests.

Figures

Fig. 1
Fig. 1
Molecular subtypes based on ARGs in CRC and their clinicopathological features. (A) Kaplan-Meier survival analyses for the two molecular subtypes. UAMP(B), tSEN(C), and PCA(D) presented a great difference between the A and B subtypes. (E)The expression levels of prognosis related differentially expressed ARGs between A and B subtypes. (F) The heatmap showed the prognosis related differentially expressed ARGs expression profiles and clinicopathologic characteristics among subtypes A and B
Fig. 2
Fig. 2
Tumor microenvironment and Functional enrichment analysis of ARGs-based clusters in CRC. (A) Analysis of infiltrating immune cells between A and B subtypes. (B) Analysis of GSEA for subtypes A and B. C, D. Analysis of GSVA for subtypes A and B
Fig. 3
Fig. 3
Construction of prognostic model based on ARGs in CRC (A) LASSO Cox regression analysis. Distribution of the heatmap of ARGs (upper), survival time (middle), and risk score (below) in all cohorts (B), training cohort(C), and test cohort(D)
Fig. 4
Fig. 4
K-M survival curves of low- and high-risk patients in the training cohort(A), test cohort(B), and all cohort(C). D-F. The ROC curves at 1-, 3- and 5-year in the mentioned three cohorts. H. Forest plots showing the results of the multivariate Cox regression analysis. I. Differences in risk scores between clusters A and B J. Sankey diagram shows the relationship between different ARG scores, risk scores, and survival outcomes
Fig. 5
Fig. 5
Construction and validation of a nomogram (A) Nomogram for predicting the 1-, 3-, and 5-year OS of CRC patients. (B) Draw a cumulative risk map for high and low-risk groups (C) Calibration plots show the fits of 1-, 3- and 5-year predictions
Fig. 6
Fig. 6
Tumor microenvironment features related to the ARGs-based signature in CRC. (A) The proportions of immune cells in each sample of low- and high-risk groups according to CIBERSORT analysis. (B) The correlation of immune cells (C) The heatmap showed the relationship between ARGs and immune cells. (D) Immune function analysis
Fig. 7
Fig. 7
Immune checkpoint profiles and immunotherapy evaluation related to the ARGs-based signature in CRC. A, B. correlations between the immune checkpoint expression and risk score. C. Comparison of TEM scores between the high and low-risk groups. D. analyze immunotherapy responses in high and low-risk groups by TIDE E. Predictive immunotherapy by comparing the score of MSI, Exclusion, Dysfunction, and TIDE in high and low-risk groups. F. Immunotherapy response analysis of high and low-risk groups through TCIA

References

    1. Dekker E, Tanis PJ, Vleugels JLA, Kasi PM, Wallace MB. Colorectal cancer. Lancet. 2019;394(10207):1467–80. doi: 10.1016/S0140-6736(19)32319-0. - DOI - PubMed
    1. Baidoun F, Elshiwy K, Elkeraie Y, Merjaneh Z, Khoudari G, Sarmini MT, Gad M, Al-Husseini M, Saad A. Colorectal Cancer epidemiology: recent trends and Impact on outcomes. Curr Drug Targets. 2021;22(9):998–1009. doi: 10.2174/18735592MTEx9NTk2y. - DOI - PubMed
    1. Mukherjee A, Bilecz AJ, Lengyel E. The adipocyte microenvironment and cancer. Cancer Metastasis Rev. 2022;41(3):575–87. doi: 10.1007/s10555-022-10059-x. - DOI - PubMed
    1. Deng T, Lyon CJ, Bergin S, Caligiuri MA, Hsueh WA. Obesity, inflammation, and Cancer. Annu Rev Pathol. 2016;11:421–49. doi: 10.1146/annurev-pathol-012615-044359. - DOI - PubMed
    1. Wu Q, Li B, Li Z, Li J, Sun S, Sun S. Cancer-associated adipocytes: key players in Breast cancer progression. J Hematol Oncol. 2019;12(1):95. doi: 10.1186/s13045-019-0778-6. - DOI - PMC - PubMed