. 2023 Dec 19;57(50):21029-21037.
doi: 10.1021/acs.est.3c05079. Epub 2023 Dec 8.

Toxicokinetic-Toxicodynamic Model to Assess Thermal Stress

Affiliations

Toxicokinetic-Toxicodynamic Model to Assess Thermal Stress

Annika Mangold-Döring et al. Environ Sci Technol. .

Abstract

Temperature is a crucial environmental factor affecting the distribution and performance of ectothermic organisms. This study introduces a new temperature damage model to interpret their thermal stress. Inspired by the ecotoxicological damage model in the General Unified Threshold model for Survival (GUTS) framework, the temperature damage model assumes that damage depends on the balance between temperature-dependent accumulation and constant repair. Mortality due to temperature stress is driven by the damage level exceeding a threshold. Model calibration showed a good agreement with the measured survival of Gammarus pulex exposed to different constant temperatures. Further, model simulations, including constant temperatures, daily temperature fluctuations, and heatwaves, demonstrated the model's ability to predict temperature effects for various environmental scenarios. With this, the present study contributes to the mechanistic understanding of temperature as a single stressor while facilitating the incorporation of temperature as an additional stressor alongside chemicals in mechanistic multistressor effect models.

Keywords: TK–TD models; environmental risk assessment; temperature stress.


Conflict of interest statement

The authors declare no competing financial interest.

Figures

Figure 1
Figure 1
Conceptual representation of the temperature damage model. Model elements grouped in damage dynamics in blue (left box) and death mechanism in orange (right box) are accompanied by visual representations in the top panel and an example data representation in the lower panel. The model state variables (i.e., scaled damage and survival probability) are in squares, while the ellipses represent the temperature scenario (as a forcing variable) and the hazard rate (as integration from damage levels). Created with BioRender.com
Figure 2
Figure 2
Model calibration of the survival probability for G. pulex over time. Solid lines show the model for the respective exposure scenarios (i.e.,10, 15, 20, 25 °C), and dotted lines represent their lower and upper confidence intervals. The experiments’ mean measured survival is plotted as dots with their Wilson score. For this calibration, Tc was set to 11 °C. Source of original experimental data: Henry et al.
Figure 3
Figure 3
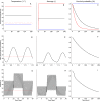
Model simulations of damage and survival probability for different scenario types. The different temperature scenario types are constant temperature scenarios (top row), daily temperature fluctuation (middle row), and daily temperature fluctuations with heatwaves (bottom row). Tc at 11 °C is marked with a dotted horizontal line. NOTE: While the survival probability is plotted for the whole simulation time (i.e., 200 days), the temperature and damage are plotted only for a representative period of the simulation (i.e., 2 and 30 days) for the daily temperature fluctuation and heatwave scenarios. Simulations were performed with hb = 0.
Figure 4
Figure 4
Heatmap for the survival probability at the end of the simulation period (t = 200 days) depending on different heatwave intensities and durations. During the heatwave, the base water temperature (daily temperature fluctuations of 4 °C around the average of 12 °C) was increased by the intensity. For each scenario, the heatwave starts on day 10. Simulations were done with hb = 0.

References

    1. Sunday J. M.; Bates A. E.; Dulvy N. K. Thermal Tolerance and the Global Redistribution of Animals. Nat. Clim. Change 2012, 2 (9), 686–690. 10.1038/nclimate1539. - DOI
    1. Kassahn K. S.; Crozier R. H.; Pörtner H. O.; Caley M. J. Animal Performance and Stress: Responses and Tolerance Limits at Different Levels of Biological Organisation. Biol. Rev. 2009, 84 (2), 277–292. 10.1111/j.1469-185X.2008.00073.x. - DOI - PubMed
    1. Pörtner H.; Bennett A. F.; Bozinovic F.; Clarke A.; Lardies M. A.; Lucassen M.; Pelster B.; Schiemer F.; Stillman J. H. Trade-Offs in Thermal Adaptation: The Need for a Molecular to Ecological Integration. Physiol. Biochem. Zool. 2006, 79 (2), 295–313. 10.1086/499986. - DOI - PubMed
    1. Stoks R.; Verheyen J.; Van Dievel M.; Tüzün N. Daily Temperature Variation and Extreme High Temperatures Drive Performance and Biotic Interactions in a Warming World. Curr. Opin. Insect Sci. 2017, 23, 35–42. 10.1016/j.cois.2017.06.008. - DOI - PubMed
    1. Kooijman B.Dynamic Energy Budget Theory for Metabolic Organisation; Cambridge University Press, 2010.