. 2024 Jan 23;9(1):e0069823.
doi: 10.1128/msystems.00698-23. Epub 2023 Dec 8.

Methylotrophy in the Mire: direct and indirect routes for methane production in thawing permafrost

Affiliations

Methylotrophy in the Mire: direct and indirect routes for methane production in thawing permafrost

Jared B Ellenbogen et al. mSystems. .

Abstract

While wetlands are major sources of biogenic methane (CH4), our understanding of resident microbial metabolism is incomplete, which compromises the prediction of CH4 emissions under ongoing climate change. Here, we employed genome-resolved multi-omics to expand our understanding of methanogenesis in the thawing permafrost peatland of Stordalen Mire in Arctic Sweden. In quadrupling the genomic representation of the site's methanogens and examining their encoded metabolism, we revealed that nearly 20% of the metagenome-assembled genomes (MAGs) encoded the potential for methylotrophic methanogenesis. Further, 27% of the transcriptionally active methanogens expressed methylotrophic genes; for Methanosarcinales and Methanobacteriales MAGs, these data indicated the use of methylated oxygen compounds (e.g., methanol), while for Methanomassiliicoccales, they primarily implicated methyl sulfides and methylamines. In addition to methanogenic methylotrophy, >1,700 bacterial MAGs across 19 phyla encoded anaerobic methylotrophic potential, with expression across 12 phyla. Metabolomic analyses revealed the presence of diverse methylated compounds in the Mire, including some known methylotrophic substrates. Active methylotrophy was observed across all stages of a permafrost thaw gradient in Stordalen, with the most frozen non-methanogenic palsa found to host bacterial methylotrophy and the partially thawed bog and fully thawed fen seen to house both methanogenic and bacterial methylotrophic activities. Methanogenesis across increasing permafrost thaw is thus revised from the sole dominance of hydrogenotrophic production and the appearance of acetoclastic at full thaw to consider the co-occurrence of methylotrophy throughout. Collectively, these findings indicate that methanogenic and bacterial methylotrophy may be an important and previously underappreciated component of carbon cycling and emissions in these rapidly changing wetland habitats.IMPORTANCEWetlands are the biggest natural source of atmospheric methane (CH4) emissions, yet we have an incomplete understanding of the suite of microbial metabolism that results in CH4 formation. Specifically, methanogenesis from methylated compounds is excluded from all ecosystem models used to predict wetland contributions to the global CH4 budget. Though recent studies have shown methylotrophic methanogenesis to be active across wetlands, the broad climatic importance of the metabolism remains critically understudied. Further, some methylotrophic bacteria are known to produce methanogenic by-products like acetate, increasing the complexity of the microbial methylotrophic metabolic network. Prior studies of Stordalen Mire have suggested that methylotrophic methanogenesis is irrelevant in situ and have not emphasized the bacterial capacity for metabolism, both of which we countered in this study. The importance of our findings lies in the significant advancement toward unraveling the broader impact of methylotrophs in wetland methanogenesis and, consequently, their contribution to the terrestrial global carbon cycle.

Keywords: EMERGE Biology Integration Institute; Stordalen Mire; methanogenesis; methylotrophy.


Conflict of interest statement

The authors declare no conflict of interest.

Figures

Fig 1
Fig 1
Phylogenomic and metagenomic analyses of Stordalen Mire methanogens. (A) Overview of substrate-specific physiology of methylotrophy, involving three-component (or corrinoid-dependent) methyltransferase systems to shuttle substrate-derived methyl groups into central methanogenesis (shown in gray). This includes a substrate:corrinoid methyltransferase (MtxB), a corrinoid-binding protein (MtxC), a methylated-corrinoid:carbon carrier methyltransferase (MtxA), and an activating enzyme (Ram or RamX). The internal “x” in the MtxABC protein/gene name (and the terminal “X” in RamX) is a generalized placeholder; the actual letter at this position varies to denote substrate specificity. Methyltransferase systems for methylated amines and oxygen compounds share a conserved architecture, while those for methylated sulfur compounds occur in two variations involving multi-functional proteins. (B) Heatmap showing the number of identified methylotrophic genes encoded in putative methylotrophic methanogen metagenome-assembled genomes (MAGs) from three orders. Each row represents a distinct MAG (grouped by taxonomic order), each column represents a different methylotrophic gene type, and cell color intensity denotes the number of identified genes. Gene columns are grouped by inferred substrate categories: methyl-N, methyl-O, and methyl-S, as in panel A, and “substrate ambiguous” for those with annotation uncertainty or known substrate flexibility. Genes only identified in the overall substrate category retain “x” in their names, and in the methyl-O substrate category, methoxylated substrates are indicated by the “methoxy” prefix. For more confident identification of methylotrophic gene homologs, columns are named as substrate-specific methyltransferase system member genes (e.g., the methanol-specific mtaB). The furthest right column indicates whether each MAG meets the threshold criteria to be defined as methylotrophic (purple cell) or not (white cell). (C) Bar chart showing the number of Stordalen Mire-derived methanogen MAGs per order present in the data set. (D) Overlay of phylogeny and genomically inferred function for these 367 methanogen MAGs. MAGs were placed onto the GTDB r207 tree using 53 concatenated archaeal marker genes, and the tree was rooted with a GTDB-derived MAG from the archaeal phylum Undinarchaeota. Methanogen orders are delineated by color shading of the tree, and adjacent to each, the genome-inferred methanogen pathway for the representatives at Stordalen Mire is denoted by colored squares for past metabolic designation and circles for this study’s updated designation.
Fig 2
Fig 2
Methanogen abundance and methane flux increased significantly across the Stordalen Mire permafrost thaw gradient in July 2016. (A) Cartoon showing the structure of the methanogenic habitats in Stordalen Mire. Red arrows represent the average methane flux from July 2016, with actual values shown in the table on the right. Flux from the fen is significantly higher than from the bog as per Tukey’s Honest Significant Difference (HSD) (P-adjusted < 0.0001). (B) Bar chart showing the site- and depth-stratified metagenome-based relative abundance of methanogenic orders within the methanogen community, colored by inferred metabolic potential. The dashed line represents the average water table depth at the time of field sampling. The overlayed red line plot shows the soil porewater methane concentrations from July 2016. Error bars represent one standard deviation for both plot types. The palsa habitat (not shown) showed near-negligible production, with values for methanogen relative abundance below detection. (C) Summed relative abundance of all methanogens within the archaeal fraction of the soil microbiota. Error bars represent one standard deviation (and the x-axis extends beyond 100% due to error bars). Significant differences were seen within the bog via Tukey’s HSD between the middle and deep (P-adjusted < 0.01) and the surface and deep (P-adjusted < 0.001). Further, a significant difference in the overall site abundance of methanogens between the fen and the bog was found (P-adjusted < 0.01). (D) Summed relative abundance of metabolic groups (methylotrophic orders, hydrogenotrophic orders, and acetoclastic orders) within the methanogen community. The relative abundance of acetoclastic methanogens was significantly lower than that of methylotrophs in the bog at middle depth (Tukey’s HSD, P-adjusted < 0.05); otherwise, no significant differences in the abundance of acetoclasts or hydrogenotrophs relative to methylotrophs were noted.
Fig 3
Fig 3
Diverse methylated metabolites are present across Stordalen Mire. (A) Known methanogenic precursors found in peat water extracts as detected by NMR. Points represent average concentrations, with error bars representing one standard deviation. Significant differences were assessed using Tukey’s HSD, with only acetate found to be significantly enriched in the fen compared to the palsa (P-adjusted < 0.05). (B) The summed LC-MS/MS peak area for five methylated amines and four methylated oxygen compounds across habitat and depth, which are implicated as potential methylotrophic substrates (Table S3; Fig. S3). Methylated amines were found to be significantly higher in the fen than in the bog (Tukey’s HSD, P-adjusted < 0.05), and a significant difference was observed for methylated oxygen compounds between each pair of sites via Tukey’s HSD (fen:bog, P-adjusted < 0.05; palsa:fen, P-adjusted < 0.05; palsa:bog, P-adjusted < 0.05). (C) Chemical structures of select known (solid box) and here proposed possible (dashed box) substrates identified in Stordalen Mire, with microbially available methyl groups circled in orange.
Fig 4
Fig 4
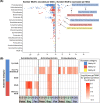
Methanogens with methylotrophic potential are active and expressing genes for methylotrophy across the Mire. (A) Summed relative transcriptional activity of methanogen orders across the Mire within the methanogen community, calculated as averaged geTMM values for all methanogen-expressed genes summed at the order level and normalized to the total sum of all methanogen-expressed genes. (B) Bar chart showing the percent of the total methanogen activity at each depth within the bog and the fen attributable to metabolic groups of hydrogenotrophs, acetoclasts, and methylotrophs. (C) Bar chart showing the absolute summed mean transcription of methanogen metabolic groups across the bog and fen. Total transcription is significantly higher in the fen than in the bog (Tukey’s HSD, P-adjusted < 0.05), but no significant intra-habitat differences were seen between the activity of individual metabolic groups. (D) Specific expression of methylotrophic genes by three methanogenic orders across the Mire. geTMM values for expressed methylotrophic methyltransferase genes averaged and normalized to MAG relative abundance within metatranscriptomes and plotted across depth profiles within the bog and fen. Expressed genes are categorized by inferred substrate category. Purple boxes are used to highlight the apparent primary substrate-specific genes expressed by each order. Evidence for active methylotrophic methanogenesis is presented across the bog and fen at every depth except the bog surface (which is likely the most oxygenated field compartment of the six represented here).
Fig 5
Fig 5
Anaerobic methylotrophic metabolism extends to the bacterial component of the soil microbiota in Stordalen Mire. (A) Plots showing the number of mtxB genes encoded (left) and expressed (right) per MAG within bacterial phyla, colored by inferred substrate specificity, in Stordalen Mire. Approximately 1,700 bacterial MAGs spanning 19 phyla encode mtxB genes, of which 88 from 12 distinct phyla were found to be actively expressing these genes. The genus (and family) of some active methylotrophic bacteria is shown on the right plot to demonstrate the here-observed taxonomic diversity of the metabolism in Stordalen. (B) Specific expression of identified mtxB genes by the three phyla found to include the greatest number of putatively methylotrophic bacteria in the Mire. Bacterial methylotrophic gene expression is evident across the entirety of Stordalen Mire in both the methanogenic and non-methanogenic habitats.
Fig 6
Fig 6
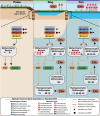
The anaerobic methylotrophic network in Stordalen Mire. Metatranscriptome-informed conceptual model summarizing the complexity of the microbial anaerobic methylotrophic food web in Stordalen Mire. Vertical dashed lines separate the palsa, bog, and fen, and the blue background is intended to represent the water table depth within sampled soil cores across habitats relative to microbial metabolic activity. Solid arrows represent metabolic reactions that can lead to the production of CH4 either directly or indirectly, while dashed arrows represent reactions not expected to result in CH4 production. Red arrows reflect substrate competition, while yellow arrows reflect cross-feeding of different metabolic groups. All represented bacterial taxa in the figure include MAGs found to express methylotrophic methyltransferase genes (mtxB) in Stordalen Mire. Substrate categories identified within each habitat per metabolite data are represented by stars (LCMS-identified) and hexagons (NMR-identified). Note that the metabolic versatility of the facultatively methylotrophic Methanosarcinales and Methanobacteriales is represented by their dual inclusion in multiple methanogenic metabolic groups.

References

    1. Bridgham SD, Cadillo-Quiroz H, Keller JK, Zhuang Q. 2013. Methane emissions from wetlands: biogeochemical, microbial, and modeling perspectives from local to global scales. Glob Chang Biol 19:1325–1346. doi:10.1111/gcb.12131 - DOI - PubMed
    1. Saunois M, Jackson RB, Bousquet P, Poulter B, Canadell JG. 2016. The growing role of methane in anthropogenic climate change. Environ Res Lett 11:120207. doi:10.1088/1748-9326/11/12/120207 - DOI
    1. Schuur EAG, McGuire AD, Schädel C, Grosse G, Harden JW, Hayes DJ, Hugelius G, Koven CD, Kuhry P, Lawrence DM, Natali SM, Olefeldt D, Romanovsky VE, Schaefer K, Turetsky MR, Treat CC, Vonk JE. 2015. Climate change and the permafrost carbon feedback. Nature 520:171–179. doi:10.1038/nature14338 - DOI - PubMed
    1. Conrad R. 2020. Importance of hydrogenotrophic, aceticlastic and methylotrophic methanogenesis for methane production in terrestrial, aquatic and other anoxic environments: a mini review. Pedosphere 30:25–39. doi:10.1016/S1002-0160(18)60052-9 - DOI
    1. Thauer RK, Kaster A-K, Seedorf H, Buckel W, Hedderich R. 2008. Methanogenic archaea: ecologically relevant differences in energy conservation. Nat Rev Microbiol 6:579–591. doi:10.1038/nrmicro1931 - DOI - PubMed

LinkOut - more resources