. 2024 Feb 1;212(3):455-465.
doi: 10.4049/jimmunol.2300038.

TLR9 plus STING Agonist Adjuvant Combination Induces Potent Neopeptide T Cell Immunity and Improves Immune Checkpoint Blockade Efficacy in a Tumor Model

Affiliations

TLR9 plus STING Agonist Adjuvant Combination Induces Potent Neopeptide T Cell Immunity and Improves Immune Checkpoint Blockade Efficacy in a Tumor Model

Melisa D Castro Eiro et al. J Immunol. .

Abstract

Immune checkpoint blockade (ICB) immunotherapies have emerged as promising strategies for the treatment of cancer; however, there remains a need to improve their efficacy. Determinants of ICB efficacy are the frequency of tumor mutations, the associated neoantigens, and the T cell response against them. Therefore, it is expected that neoantigen vaccinations that boost the antitumor T cell response would improve ICB therapy efficacy. The aim of this study was to develop a highly immunogenic vaccine using pattern recognition receptor agonists in combination with synthetic long peptides to induce potent neoantigen-specific T cell responses. We determined that the combination of the TLR9 agonist K-type CpG oligodeoxynucleotides (K3 CpG) with the STING agonist c-di-AMP (K3/c-di-AMP combination) significantly increased dendritic cell activation. We found that immunizing mice with 20-mer of either an OVA peptide, low-affinity OVA peptides, or neopeptides identified from mouse melanoma or lung mesothelioma, together with K3/c-di-AMP, induced potent Ag-specific T cell responses. The combined K3/c-di-AMP adjuvant formulation induced 10 times higher T cell responses against neopeptides than the TLR3 agonist polyinosinic:polycytidylic acid, a derivative of which is the leading adjuvant in clinical trials of neoantigen peptide vaccines. Moreover, we demonstrated that our K3/c-di-AMP vaccine formulation with 20-mer OVA peptide was capable of controlling tumor growth and improving survival in B16-F10-OVA tumor-bearing C57BL/6 mice and synergized with anti-PD-1 treatment. Together, our findings demonstrate that the K3/c-di-AMP vaccine formulation induces potent T cell immunity against synthetic long peptides and is a promising candidate to improve neoantigen vaccine platform.


Conflict of interest statement

The authors have no financial conflicts of interest.

Figures

FIGURE 1.
FIGURE 1.
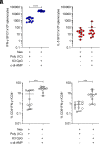
Potent CD8+ T cell response against 20-mer peptide is induced by K3/c-di-AMP adjuvant combination. C57BL/6 mice were immunized once per week for 3 wk in the left flank with 100 µl of each vaccine containing 20-mer OVA(252-271) SLP and different adjuvants individually or combined, AddaVax, or saline as controls. One week after the last immunization, mice were harvested, and the frequencies of OVA(257-264)-specific CD8+ T cells in blood, spleen, and lymph nodes were analyzed by MHC tetramer staining followed by flow cytometry (A). Each circle depicts an individual animal, and means and ranges are shown (n = 6–11 mice, three independent experiments). The frequencies of IFN-γ– and TNF-α–producing CD8+ T cells were analyzed by intracellular staining after restimulation with SIINFEKL peptide (B). Differences between the groups were analyzed by Kruskal–Wallis test followed by Dunn posttest after analyzing the data distribution. *p < 0.05, **p < 0.01, ***p < 0.001, ****p < 0.0001.
FIGURE 2.
FIGURE 2.
Vaccines containing low-affinity OVA peptides and K3/c-di-AMP adjuvant combination induce robust Ag-specific CD8+ T cells. C57BL/6 mice were immunized once per week for 3 wk in the left flank with 100 µl of each vaccine containing low-affinity 20-mer OVA(252-271) SLP (E1 or R4) with or without K3/c-di-AMP or AddaVax. One week after the last immunization, mice were harvested, and splenocytes were restimulated with E1 or R4 8-mer OVA(257-264) peptides for 6 h, and cytokine expression was analyzed by intracellular staining. The frequencies of IFN-γ– and TNF-α–expressing CD8+ T cells are shown. Symbols represent individual mice (data from three independent experiments), and the bars represent the mean and range. Differences between the groups were analyzed by Kruskal–Wallis test followed by Dunn posttest after analyzing the data distribution. *p < 0.05, **p < 0.01, ***p < 0.001.
FIGURE 3.
FIGURE 3.
Potent neoantigen-specific T cell responses are induced by vaccines containing neopeptides with K3/c-di-AMP adjuvant. Vaccine containing 20-mer peptide pools of neoantigens from two different tumor models, B16-F10 and AE-17, were used to vaccinate C57BL/6 mice. Vaccines included K3/c-di-AMP, c-di-AMP alone, or AddaVax as adjuvants. Mice were immunized once per week for 3 wk. One week after the last immunization, mice were harvested, and the numbers of IFN-γ–producing (left panels) and IL-5–producing (right panels) cells were measured by ELISPOT after 24-h restimulation of splenocytes with or without the pool of peptides used for immunization. The number of spot-forming cells (SFCs) in response to the different pools is shown for B16-F10 (A) and AE-17 (B) neoantigens. Each dot represents an individual mouse (n = 12 or 18 per group from two independent experiments), and the bars represent the mean and range. Differences between the groups were analyzed by Kruskal–Wallis test followed by Dunn posttest after analyzing the data distribution. *p < 0.05, **p < 0.01, ***p < 0.001, ****p < 0.0001.
FIGURE 4.
FIGURE 4.
K3/c-di-AMP adjuvant is more potent than poly(I:C) at inducing neoantigen-specific T cell immunity. C57BL/6 mice were immunized three times, once per week. Vaccines contained a 20-mer neoantigen peptide pool from B16-F10 tumor in combination with K3/c-di-AMP or poly(I:C) as adjuvants. One week after the third immunization, the numbers of IFN-γ– and IL-5–producing T cells were determined by ELISPOT after 24-h restimulation of splenocytes with the 20-mer neoantigen peptide pool (A). The frequencies of IFN-γ–producing CD4+ and CD8+ T cells were determined by intracellular staining after restimulation with 20-mer peptide pool (B). Dots represent individual mice (n = 11 or 12 per group from three independent experiments). Differences between the groups were analyzed by Mann–Whitney U test after analyzing the data distribution. ***p < 0.001, ****p < 0.0001.
FIGURE 5.
FIGURE 5.
Vaccine containing 20-mer OVA(252-271) SLP and K3/c-di-AMP reduces tumor growth and improves survival of mice with established B16-F10-OVA tumors. C57BL/6 mice were injected s.c. with 0.5 × 10⁶ B16-F10-OVA cells in the back. After 7 d, when the tumors were established, the immunization schedule started, and the mice were immunized with 100 µl of each vaccine containing 20-mer OVA(252-271) SLP and adjuvants or saline. Mice were vaccinated three times as indicated in the depicted time schedule (A). The tumor size was measured for 37 d for each group of mice, and individual mice are shown (n = 8–12 per group from three independent experiments) (B). Survival curves and the mean of tumor growth per group are shown (arrows depict vaccinations). For the mean tumor growth line, the last values of sacrificed mice due to reaching humane endpoint were kept in the tumor growth curve after mice were sacrificed (C). The frequencies of OVA(257-264)-specific CD8+ T cells in blood, spleen, and lymph nodes are depicted when mice reached the humane endpoint. Each dot represents one mouse, and means and ranges are shown (D). Differences between OVA + K3/c-di-AMP and other groups in the survival curve were analyzed by log-rank (Mantel–Cox) test. aap < 0.01 compared with saline, bbbp < 0.001 compared with OVA + AddaVax, cp < 0.05 compared with OVA + c-di-AMP (C). Differences in tumor growth between OVA + K3/c-di-AMP and other groups were analyzed by two-way ANOVA followed by Dunnett posttest. ap < 0.05 compared with saline, bp < 0.05 compared with OVA + AddaVax, cp < 0.05 compared with OVA + c-di-AMP (C). Differences between the groups were analyzed by Kruskal–Wallis test followed by Dunn posttest after analyzing the data distribution. *p < 0.05, **p < 0.01, ***p < 0.001, ****p < 0.0001 (D).
FIGURE 6.
FIGURE 6.
K3/c-di-AMP without Ag cannot protect from established B16-F10-OVA tumors. C57BL/6 mice were s.c. injected with 0.5 × 10⁶ B16-F10-OVA cells. Seven days later, when tumors were established, mice were vaccinated once per week for 3 wk with K3/c-di-AMP or saline (arrows depict vaccinations). The tumor size and survival were monitored for 37 d (n = 4–8 per group from two independent experiments). Survival curves and the mean of tumor growth per group are shown, and the last values of sacrificed mice were retained in the tumor growth curve after mice were sacrificed due to reaching the humane endpoint.
FIGURE 7.
FIGURE 7.
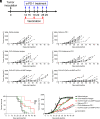
Vaccines containing 20-mer OVA(252-271) SLP combined with K3/c-di-AMP synergize with anti–PD-1 treatment in mice with established tumors. C57BL/6 mice were injected s.c. with 0.5 × 10⁶ B16-F10-OVA cells, and, 12 d later, mice were vaccinated with vaccines containing 20-mer OVA(252-271) SLP and K3/c-di-AMP or AddaVax. Mice were vaccinated once per week for 3 wk. Additionally, anti–PD-1 treatment or isotype control was administered i.p. twice per week for 3 wk. Ab treatment was started after day 12 after tumor injection (A). Tumor size was measured for 49 d, and tumor growth for individual mice (n = 8–11 per group from three independent experiments) is shown (B). Survival curves and the mean of tumor growth per group are shown with the last values of mice retained in the tumor growth curve after mice were sacrificed due to reaching the humane endpoint (arrows depict vaccinations) (C). Differences between OVA + K3/c-di-AMP and other groups in the survival curve were analyzed by log-rank (Mantel–Cox) test. aaaap < 0.0001 compared with saline + isotype, bbbbp < 0.0001 compared with saline + anti-PD1, cccp < 0.001 compared with AddaVax + isotype, ddp < 0.01 compared with AddaVax + anti-PD1, eep < 0.01 compared with OVA + K3/c-di-AMP + isotype (C). Differences in the tumor growth between OVA + K3/c-di-AMP and other groups were analyzed by two-way ANOVA followed by Dunnett posttest. ap < 0.05 compared with saline + isotype, bp < 0.05 compared with saline + anti-PD-1, cp < 0.001 compared with AddaVax + isotype, dp < 0.01 compared with AddaVax + anti-PD-1, ep < 0.01 compared with OVA + K3/c-di-AMP + isotype (C).
FIGURE 8.
FIGURE 8.
Vaccines containing OVA peptide combined with K3/c-di-AMP do not induce severe systemic inflammation. C57BL/6 mice were immunized once per week for 3 wk s.c. in the left flank with 100 µl of each vaccine containing 20-mer OVA(252-271) SLP and K3/c-di-AMP or saline as a control or i.p. with 100 µl of 20-mer OVA(252-271) SLP and LPS as a control. At 6 h and 24 h after each vaccination, inflammatory cytokines (A) and circulating activated immune cells (B) were measured in blood. OVA + LPS was not analyzed at 24 h (marked as X in the figure) (A and B). The body weight of the mice was monitored for 24 d (C). Each value represents the mean ± SD (n = 4 or 8 per group) (A–C). Differences between the groups were analyzed at each time point individually after analyzing the data distribution. *p < 0.05, **p < 0.01, ***p < 0.001, ****p < 0.0001. For 6-h data, differences between groups were analyzed by one-way ANOVA or Kruskal–Wallis test followed by Tukey or Dunn posttest, respectively. For 24-h data, differences between the groups were analyzed by Mann–Whitney U test or unpaired t test (A and B). Differences in the body weight curve between the groups were analyzed by two-way ANOVA followed by Tukey posttest. *p < 0.05, **p < 0.01, ***p < 0.001, OVA + LPS compared with saline. ††p < 0.01, †††p < 0.001, OVA + LPS compared with OVA + K3/c-di-AMP (C).

References

    1. Topalian, S. L., Hodi F. S., Brahmer J. R., Gettinger S. N., Smith D. C., McDermott D. F., Powderly J. D., Carvajal R. D., Sosman J. A., Atkins M. B., et al. . 2012. Safety, activity, and immune correlates of anti-PD-1 antibody in cancer. N. Engl. J. Med. 366: 2443–2454. - PMC - PubMed
    1. Galluzzi, L., Vacchelli E., Bravo-San Pedro J. M., Buqué A., Senovilla L., Baracco E. E., Bloy N., Castoldi F., Abastado J. P., Agostinis P., et al. . 2014. Classification of current anticancer immunotherapies. Oncotarget 5: 12472–12508. - PMC - PubMed
    1. Topalian, S. L., Drake C. G., Pardoll D. M.. 2015. Immune checkpoint blockade: a common denominator approach to cancer therapy. Cancer Cell 27: 450–461. - PMC - PubMed
    1. Garon, E. B., Rizvi N. A., Hui R., Leighl N., Balmanoukian A. S., Eder J. P., Patnaik A., Aggarwal C., Gubens M., Horn L., et al. KEYNOTE-001 Investigators . 2015. Pembrolizumab for the treatment of non-small-cell lung cancer. N. Engl. J. Med. 372: 2018–2028. - PubMed
    1. Rosenberg, J. E., Hoffman-Censits J., Powles T., van der Heijden M. S., Balar A. V., Necchi A., Dawson N., O’Donnell P. H., Balmanoukian A., Loriot Y., et al. . 2016. Atezolizumab in patients with locally advanced and metastatic urothelial carcinoma who have progressed following treatment with platinum-based chemotherapy: a single-arm, multicentre, phase 2 trial. Lancet 387: 1909–1920. - PMC - PubMed

Publication types