. 2023 Dec 4;13(23):3075.
doi: 10.3390/nano13233075.

Microfluidic Vaterite Synthesis: Approaching the Nanoscale Particles

Affiliations

Microfluidic Vaterite Synthesis: Approaching the Nanoscale Particles

Ivan Reznik et al. Nanomaterials (Basel). .

Abstract

The challenge of continuous CaCO3 particle synthesis is addressed using microfluidic technology. A custom microfluidic chip was used to synthesize CaCO3 nanoparticles in vaterite form. Our focus revolved around exploring one-phase and two-phase synthesis methods tailored for the crystallization of these nanoparticles. The combination of scanning electron microscopy, X-ray diffraction, dynamic light scattering, and small-angle scattering allowed for an evaluation of the synthesis efficiency, including the particle size distribution, morphology, and polymorph composition. The results demonstrated the superior performance of the two-phase system when precipitation occurred inside emulsion microreactors, providing improved size control compared with the one-phase approach. We also discussed insights into particle size changes during the transition from one-phase to two-phase synthesis. The ability to obtain CaCO3 nanoparticles in the desired polymorph form (∼50 nm in size, 86-99% vaterite phase) with the possibility of scaling up the synthesis will open up opportunities for various industrial applications of the developed two-phase microfluidic method.

Keywords: CaCO3; additive manufacturing; microfluidic synthesis; nanoparticles; one-phase synthesis; two-phase synthesis; vaterite.


Conflict of interest statement

The authors declare no conflict of interest.

Figures
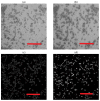
Figure A1
Figure A1
Stages of image processing: the original image taken from the center of the LSM Z-stack (a), the image after Z-projection of the entire Z-stack with pixel value averaging based on the minimum value (b), the image after applying the Canny edge detection operator (c), the image with detected circles after the Hough transform (d). Scale bar is 10 μm.
Figure A2
Figure A2
Size distributions of CaCO3 particles identified manually (a) and through digital image processing (b). Size distribution analysis performed on data set provided by LSM measurements. Mean and standard deviation were calculated through Gaussian fitting of experimental data.
Figure 1
Figure 1
(a)—Parametric model of the microfluidic chip with three inputs and one output. The input and channel for oil delivery are highlighted in red. The inputs and channels for precursor delivery into the chip are marked in green. The glass tube, where the formation of microbubbles with the reaction mixture occurs, is marked in blue. (b)—Photograph of the assembled chip connected to syringe pumps and placed under the microscope. (c)—Photograph of the hardware part of the syringe pump system connected to the microfluidic chip.
Figure 2
Figure 2
CaCO3 size distribution dependency on concentrations of reactants (0.1 M—(a), 0.33 M (b), 0.5 M (c), 1 M (d)). Each graph presents four curves corresponding to a separate synthesis with the indicated reactant concentration. The insets show images of particles obtained using a confocal microscope (scale bar is 10 μm) and utilized for size distribution analysis using the methodology described in the Materials and Methods Section 2.4.
Figure 3
Figure 3
Size distribution comparison between several synthesis iterations of CaCO3 microparticles depending on the reagent concentration ((a) 0.5 M, (b) 1 M) and solution used to prepare the reagents (deionized water for the green and blue shaded curves, and deionized water and EG mix for the red and violet shaded curves). Insets contain the fitting parameters of the experimentally obtained data. Size distribution analysis performed using the methodology described in the Appendix A section on a data set provided by LSM measurements.
Figure 4
Figure 4
(a)—Schematic representation of the internal structure of the microfluidic chip used for the two-phase synthesis of calcium carbonate microspheres. The red indicates the inlet and channels for oil delivery, while the green indicates the inlets and channels for reactant delivery. The reactant channels intersect with each other at a 45-degree angle. The blue represents the glass tube through which the reactant mixture is transported to the chip’s outlet. (b,c)—Microphotographs of the generated microbubbles when using reactants in pure water and when using a mixture of water and ethylene glycol (EG) in a 1:1 ratio. Scale bar is 1 mm.
Figure 5
Figure 5
(a,b)—SEM images of calcium carbonate particles synthesized through one-phase and two-phase methods, respectively, using a reactant mixture with EG at a 1:1 ratio. (c)—Comparison of size distribution and average diameter of calcium carbonate particles synthesized in three consecutive runs using one-phase (blue curves) and two-phase (red curves) methods. Scale bar is 10 μm. Size distribution analysis performed using the methodology described in the Appendix A section on a data set provided by the SEM measurements.
Figure 6
Figure 6
X-ray powder diffraction patterns of CaCO3 synthesized via one- or two-phase routes (red and green curves, respectively), at a reagent concentration of 0.5 M (top panel) and 1M (bottom panel) and water–EG ratio of 1:1. Inset: calcite–vaterite ratio calculated through full-profile analysis usng the Rietveld method.
Figure 7
Figure 7
The dependence of the average diameter and size distribution (FWHM) of calcium carbonate particles on the synthesis type (top panel for one-phase synthesis and bottom panel for two-phase synthesis) and the water–ethylene glycol ratio in the reactant mixture and different reagent concentration ((a) 0.5 M, (b) 1 M). Average size and size distribution analysis performed using the methodology described in the Appendix A section on data set provided by the LSM measurements.
Figure 8
Figure 8
(a) SEM images of CaCO3 nanoparticles synthesized by the two-phase route in a water–EG ratio of 1:1 and concentration of 0.5 M (a) and 1 M (b). (c) Dependence of the average size and size distribution of calcium carbonate particles on the H20:EG ratio. Red arrows highlight the reduction in particles sizes during transition from low to high H20:EG ratio. Size distribution analysis performed using the methodology described in the Appendix A section on the data set provided by the SEM measurements.
Figure 9
Figure 9
Experimental SAXS curves (a) and functions of particle volume distribution by size Dv(r) in the approximation of spherical particles (b) for CaCO3 synthesized with a reagent concentration of 1 M and various water–EG ratios.

References

    1. Volodkin D. CaCO3 templated micro-beads and-capsules for bioapplications. Adv. Colloid Interface Sci. 2014;207:306–324. doi: 10.1016/j.cis.2014.04.001. - DOI - PubMed
    1. Wei W., Ma G.H., Hu G., Yu D., Mcleish T., Su Z.G., Shen Z.Y. Preparation of hierarchical hollow CaCO3 particles and the application as anticancer drug carrier. J. Am. Chem. Soc. 2008;130:15808–15810. doi: 10.1021/ja8039585. - DOI - PubMed
    1. Chen Y., Ji X., Zhao G., Wang X. Facile preparation of cubic calcium carbonate nanoparticles with hydrophobic properties via a carbonation route. Powder Technol. 2010;200:144–148. doi: 10.1016/j.powtec.2010.02.017. - DOI
    1. Haložan D., Riebentanz U., Brumen M., Donath E. Polyelectrolyte microcapsules and coated CaCO3 particles as fluorescence activated sensors in flowmetry. Colloids Surfaces A Physicochem. Eng. Asp. 2009;342:115–121. doi: 10.1016/j.colsurfa.2009.04.024. - DOI
    1. Fujiwara M., Shiokawa K., Morigaki K., Zhu Y., Nakahara Y. Calcium carbonate microcapsules encapsulating biomacromolecules. Chem. Eng. J. 2008;137:14–22. doi: 10.1016/j.cej.2007.09.010. - DOI

LinkOut - more resources