

T-TAS® 01 as a new tool for the evaluation of hemostasis in thrombocytopenic patients after platelet transfusion
- PMID: 38063791
- PMCID: PMC10920067
- DOI: 10.2450/BloodTransfus.550
T-TAS® 01 as a new tool for the evaluation of hemostasis in thrombocytopenic patients after platelet transfusion
Abstract
Background: Current laboratory tests fail to evaluate the hemostatic function of platelets in patients with thrombocytopenia. We investigated the use of the Total Thrombus-Formation Analysis System (T-TAS® 01 [Fujimori Kogyo Co, Tokyo, Japan]) to evaluate hemostasis under conditions of experimental thrombocytopenia, and in patients before and after platelet transfusion.
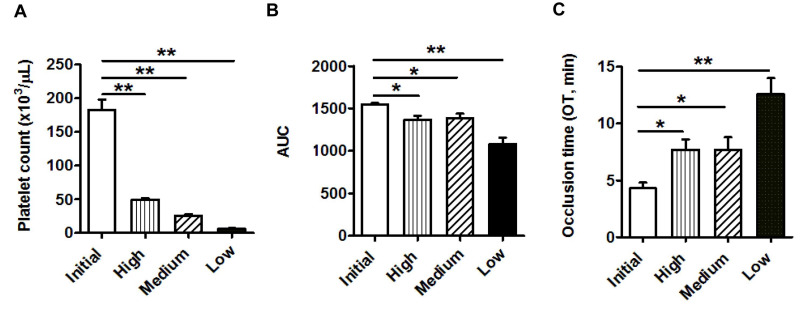
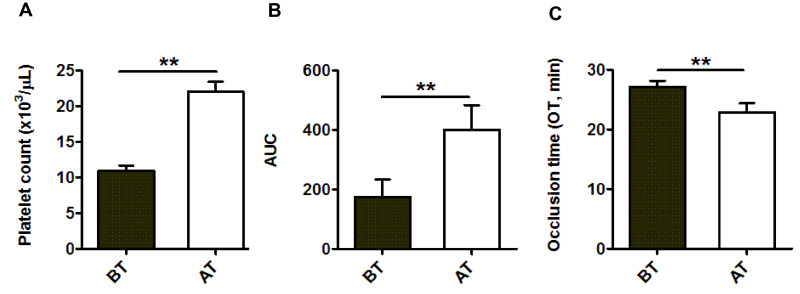
Materials and methods: Specific T-TAS 01 chips, for thrombocytopenic conditions, were used. The area under the curve (AUC) and occlusion time (OT, min) were measured in: (i) experimentally induced thrombocytopenia (183±15 to 6.3±1.2×10³ platelets/μL) in blood samples from healthy donors (No.=13), and (ii) blood from oncohematological thrombocytopenic patients (No.=48), before and after platelet transfusion. The influences of hematocrit and number of transfusions were analyzed in these patients.
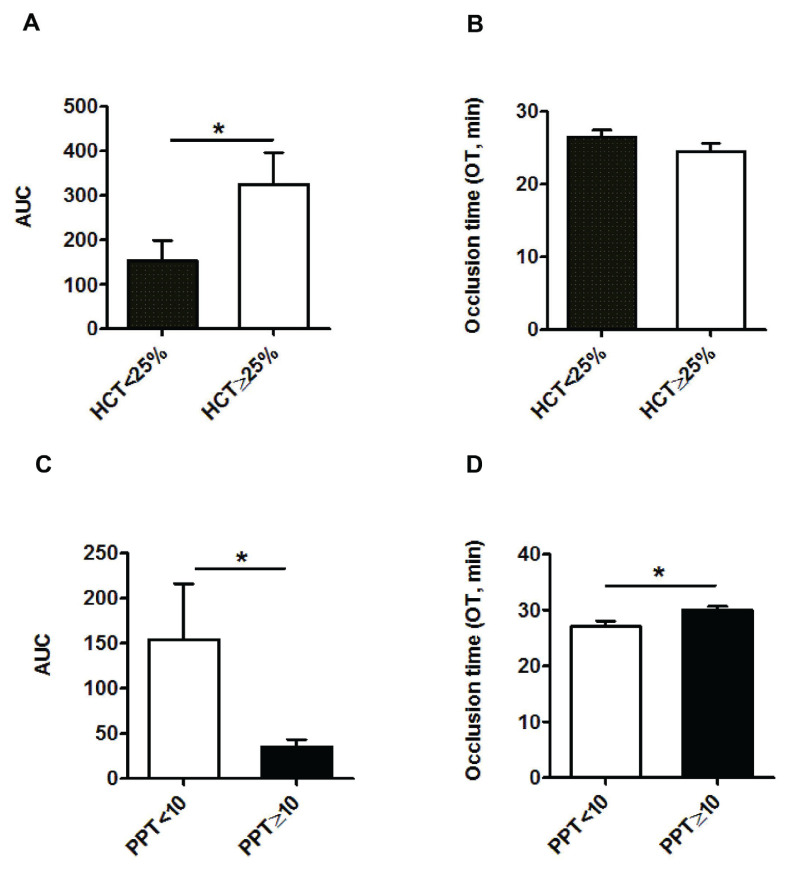
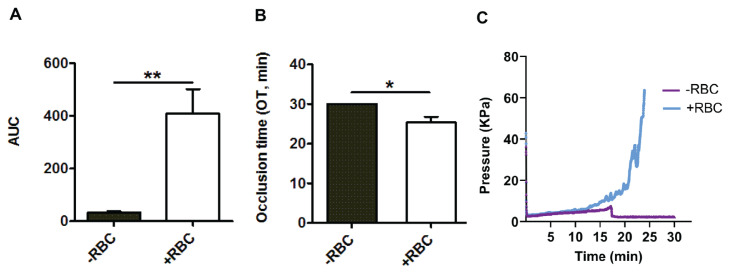
Results: Progressive reductions of AUC and prolongations of OT related significantly to decreasing platelet counts (p<0.05 for all) in experimental thrombocytopenia. In samples from thrombocytopenic patients, platelet counts, AUC and OT were, respectively, 10.8±0.6×10³/μL, 175.2±59, and 27.2±1 min before transfusion; and 22±1.5×10³/μL, 400.8±83 and 22.9±1.5 min after platelet transfusion (p<0.01 for all). A hematocrit below 25% or exposure to ten or more previous platelet transfusions had a negative impact on the T-TAS 01 performance in patients. In vitro correction of the hematocrit improved the hemostatic response in thrombocytopenic patients.
Discussion: T-TAS 01 measurements were sensitive to low platelet counts in the experimental setting. The technology was sensitive to evaluate the hemostatic capacity of platelet transfusions. Exposure to multiple medications, repeated platelet transfusions and lower hematocrits may interfere with the hemostatic performance in oncohematological patients with thrombocytopenia.
Conflict of interest statement
DISCLOSURE OF CONFLICTS OF INTEREST: MDR has received honoraria from Jazz and research funding from Zacros (Fujimori Kogyo Co., [Japan], Cellphire Therapeutics [USA], CSL Behring [Spain], and Sysmex Europe GmbH [Germany]). No company participated in the content of the manuscript in any way. The remaining Authors have no conflicts of interest directly related to this work.
Figures
References
Publication types
MeSH terms
Substances
LinkOut - more resources
Full Text Sources
